Transcription
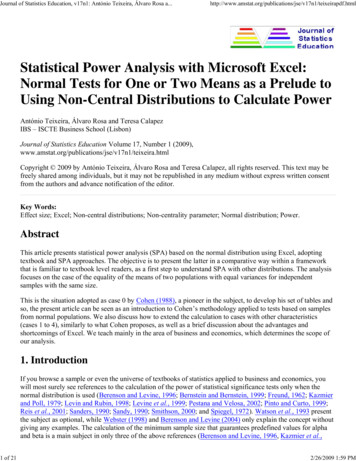
Using EXCEL for Statistical AnalysisBrian W. SlobodaUniversity of Phoenixbsloboda@email.phoenix.eduJune 25, 2020Brian W. Sloboda (University of Phoenix)EXCEL for StatisticsJune 25, 20201 / 47
Purpose of this Session1First SectionThe purpose of this presentation is to learn how to use EXCEL toconduct statistical analysis.Brian W. Sloboda (University of Phoenix)EXCEL for StatisticsJune 25, 20202 / 47
Descriptive StatisticsThe first part of this session is to review the procedures to calculatethe descriptive statistics using EXCEL.(This step only needs to be done once.) Go to TOOLS-ADD INS andselect the Analysis Toolpaks and OK. This will add the analysis toolsto your EXCEL.If for some reason, when you use Data Analysis in the future and it isnot there, just download it again.Brian W. Sloboda (University of Phoenix)EXCEL for StatisticsJune 25, 20203 / 47
Descriptive StatisticsHere is sample data to illustrate descriptive statisticsObservation NumberVariable 1Variable 041041151189685106111100111105Table: Sample DataBrian W. Sloboda (University of Phoenix)EXCEL for StatisticsJune 25, 20204 / 47
Descriptive StatisticsTo run the descriptive statistics on the data, go to TOOLS-DATAANALYSIS (it should be the last option in the TOOLS menu and willenable once you have loaded it after Step 1). Select DESCRIPTIVESTATISTICS and OK.Brian W. Sloboda (University of Phoenix)EXCEL for StatisticsJune 25, 20205 / 47
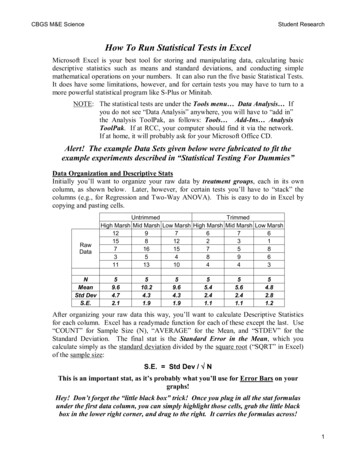
Descriptive StatisticsYou should now have a table that looks like this.The INPUT RANGE is the data that will analyzed. Either select the redbox and highlight the range, or enter the cell ranges of the data. The cellsto be analyzed are A1 to C14. Whenthe data are highlighted,Junehit25, ENTER.Brian W. Sloboda (University of Phoenix)EXCEL for Statistics20206 / 47
Descriptive StatisticsNext, select the Summary Statistics box (which will do a summarystatistics table).Brian W. Sloboda (University of Phoenix)EXCEL for StatisticsJune 25, 20207 / 47
Descriptive StatisticsFinally, decide where the output should be produced. If you would like thesummary table on the same sheet as the data, select the first option(Output Range). If you would like the table in the same Excel workbook,but on a different sheet, select the second option (New Worksheet Ply).Finally, the output can be generated to a whole new Excel file (the thirdoption).Let’s select the second option.Brian W. Sloboda (University of Phoenix)EXCEL for StatisticsJune 25, 20208 / 47
Descriptive StatisticsSelect OK and a summary table will be displayed that should look like this:Brian W. Sloboda (University of Phoenix)EXCEL for StatisticsJune 25, 20209 / 47
Descriptive StatisticsHere is an explanation of what each of the descriptive statistics isdescribing:Brian W. Sloboda (University of Phoenix)EXCEL for StatisticsJune 25, 202010 / 47
Confidence IntervalsNow we will shift gears from descriptive statistics and start some statisticalinference, namely confidence intervals. So we need to go to DescriptiveStatistics boxBrian W. Sloboda (University of Phoenix)EXCEL for StatisticsJune 25, 202011 / 47
Confidence IntervalsThen, in the following box select, Confidence Interval for Means. Thedefault in EXCEL is 95 percentBrian W. Sloboda (University of Phoenix)EXCEL for StatisticsJune 25, 202012 / 47
Confidence IntervalsThe confidence interval is not calculated directly by EXCEL, so you willneed to take the formula for a confidence interval and translate intoEXCEL language. Recall the formula for the confidence interval for a largesample: µ, 95% confidence interval (µ̂L , µ̂U ) of µ is an interval thatsatisfiesP(µ̂L µ µ̂U ) 0.95.We usually make the interval centered so thatP(µ̂L µ) P(µ µ̂U ) 0.025.Brian W. Sloboda (University of Phoenix)EXCEL for StatisticsJune 25, 202013 / 47
Table of Data for Confidence IntervalsObs. 099511110689761116411291896211175Table: Sample Data- Not all is givenBrian W. Sloboda (University of Phoenix)EXCEL for StatisticsJune 25, 202014 / 47
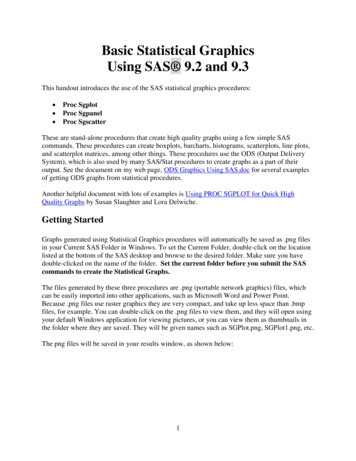
Confidence IntervalsHere is the output from the EXCELYou will see the confidence interval information in the last row.Brian W. Sloboda (University of Phoenix)EXCEL for StatisticsJune 25, 202015 / 47
Confidence IntervalsA 95% confidence interval for the population mean is the sample meanplus or minus the ”confidence level” reported by EXCEL.Here this yields 119.90-2.59 and 119.90 2.59 (117.31, 122.49).Interpretation: This means that the data are consistent 95% of the timewith a data generating process with population mean of mu in the range117.31 to 122.49.Brian W. Sloboda (University of Phoenix)EXCEL for StatisticsJune 25, 202016 / 47
Inferential Statistics for Test of Means of Two SamplesAs long as you have the size of the sample, mean, and standard deviation,a t-test will work on small sample comparison, even if the total sample isnot provided. But the t-test is not limited to small sample research designsand can also be used for large samples and can be a fairly robust. Thereare actually a variety of different designs that compare mean differences.Brian W. Sloboda (University of Phoenix)EXCEL for StatisticsJune 25, 202017 / 47
Inferential Statistics for Tests of Means of Two SamplesOpen an Excel spreadsheet and enter the values from the followingexample. Go to Tools-Data Analysis-“t-test: Two Sample Assuming EqualVariances.”Brian W. Sloboda (University of Phoenix)EXCEL for StatisticsJune 25, 202018 / 47
Inferential Statistics for Tests of Means of Two SamplesGo to Tools-Data Analysis-“t-test: Two Sample Assuming EqualVariances.”Brian W. Sloboda (University of Phoenix)EXCEL for StatisticsJune 25, 202019 / 47
Inferential Statistics for Tests of Means of Two SamplesEnter the data from N1 into Variable 1 Range (A1:A6) and the data fromN2 into Variable 2 Range (B1:B7). Don’t forget to check the labels box!Notice that the default alpha is .05. What is the alpha of this data? Youwill need to change the level of significance to .10. Let’s make the outputon the same page beginning in cell D1. Select OK.Brian W. Sloboda (University of Phoenix)EXCEL for StatisticsJune 25, 202020 / 47
Inferential Statistics for Tests of Means of Two SamplesHere is the boxes that need to be filled out.”Brian W. Sloboda (University of Phoenix)EXCEL for StatisticsJune 25, 202021 / 47
Inferential Statistics for Tests of Means of Two SamplesHere are the results from EXCELBrian W. Sloboda (University of Phoenix)EXCEL for StatisticsJune 25, 202022 / 47
Analysis of Variance (ANOVA)An ANOVA (Analysis of Variance), sometimes called an F test, isclosely related to the t test. The major difference is that, where the ttest measures the difference between the means of two groups, anANOVA tests the difference between the means of two or more groupsA one-way ANOVA, or single factor ANOVA as mentioned in EXCEL,tests differences between groups that are only classified on oneindependent variable which is called the treatments.Brian W. Sloboda (University of Phoenix)EXCEL for StatisticsJune 25, 202023 / 47
Analysis of Variance (ANOVA)Example (Using One Way ANOVA) Comparing Hotel Prices Someprofessional associations are reluctant to hold meetings in New Yorkbecause of high hotel prices and taxes. Are hotels in New York moreexpensive than hotels in other major cities?We have a random sample of eight hotels and their prices that weretaken from the 1992 Mobil Travel Guide to Major Cities.Brian W. Sloboda (University of Phoenix)EXCEL for StatisticsJune 25, 202024 / 47
Analysis of Variance 0210215Table: Hotel DataBrian W. Sloboda (University of Phoenix)EXCEL for StatisticsJune 25, 202025 / 47
Analysis of Variance (ANOVA)Click on Tools, then on Data Analysis. When you do this, you will see thefollowing screen.Brian W. Sloboda (University of Phoenix)EXCEL for StatisticsJune 25, 202026 / 47
Analysis of Variance (ANOVA)ANOVA: Single Factor is the first tool on the list. Click on it, then clickOK. You will see the following.Brian W. Sloboda (University of Phoenix)EXCEL for StatisticsJune 25, 202027 / 47
Analysis of Variance (ANOVA)Choose New Worksheet Ply and type the name, ANOVA, to the right.After you have entered all of these values, the screen should look like thefollowing.Brian W. Sloboda (University of Phoenix)EXCEL for StatisticsJune 25, 202028 / 47
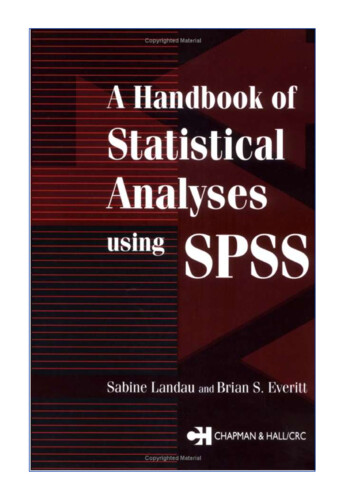
Analysis of Variance (ANOVA)After you have entered all the data, click OK. Excel will calculate theANOVA table. You should see a table like the following.Brian W. Sloboda (University of Phoenix)EXCEL for StatisticsJune 25, 202029 / 47
Analysis of Variance (ANOVA)Basically, the ANOVA compares two variances: the between-cityvariance vs. the within-city variance. If the between-city variance ismuch higher than the within-city variation, the cities are significantlydifferent.The p-value is 0.025 (cell F13), which is less than the alpha value wespecified so we should reject the hypothesis of equal city means at the5% level.Therefore, we could say that, at the 5% significance level, it appearsthat the expected price of a hotel room is not the same in the fourcities.Brian W. Sloboda (University of Phoenix)EXCEL for StatisticsJune 25, 202030 / 47
ANOVA: Two-Factor Without Replication AnalysisThis analysis tool performs a two-factor ANOVA that does notinclude more than one sampling per group, testing the hypothesisthat means from two or more samples are equal (drawn frompopulations with the same mean).For example, if the experimenter in the above Cola example hadtested only one can of soda for each of the eight trials instead ofusing a new can for each trial, we would use the two factor withoutreplication.Brian W. Sloboda (University of Phoenix)EXCEL for StatisticsJune 25, 202031 / 47
ANOVA: Two-Factor Without Replication AnalysisExample: As a production manager, you want to see if 3 filling machineshave different mean filling times when used with 5 types of boxes. At the.05 level, is there a difference in machines, in boxes? The data can begiven as follows:BoxMachine 1Machine 2Machine 021.6020.0022.2019.7520.6020.40Table: Production DataBrian W. Sloboda (University of Phoenix)EXCEL for StatisticsJune 25, 202032 / 47
ANOVA: Two-Factor Without Replication AnalysisThe results from this ANOVA are given as follows:Brian W. Sloboda (University of Phoenix)EXCEL for StatisticsJune 25, 202033 / 47
ANOVA: Two-Factor Without Replication AnalysisBy looking at the p values we can determine the results. Looking atthe columns (the machines also called the treatments), the p value is.055 which is greater than the level of significance of .05. So thereare no differences between the means.For the rows, which represents the boxes. Its p-value is .933 which isgreater than the level of significance of .05. So there are nodifferences between the block means.Remark: Though the means differ, we cannot say there is adifference because this is based on causal observation which isscientific as was just done here.Brian W. Sloboda (University of Phoenix)EXCEL for StatisticsJune 25, 202034 / 47
Regression AnalysisIt is standard convention to list the x variable before the y variable in atable. You should notice that in Excel, the y-variable is listed first. If thevariables are not entered properly—you will end up with the wrong results(GIGO).Brian W. Sloboda (University of Phoenix)EXCEL for StatisticsJune 25, 202035 / 47
Regression AnalysisButler’s Trucking Company is an independent trucking Company insouthern California. A major portion of Butler’s business involves deliveriesthroughout its local area. To develop better work schedules, the managerswant to estimate the total daily travel time for their drivers.Initially the managers believed that the total daily travel time would beclosely related to the number of miles traveled in making the dailydeliveries. A simple random sample of 10 driving assignments is providedBrian W. Sloboda (University of Phoenix)EXCEL for StatisticsJune 25, 202036 / 47
Regression AnalysisHere is the random sample of 10 observations for this exampleBrian W. Sloboda (University of Phoenix)EXCEL for StatisticsJune 25, 202037 / 47
Regression AnalysisHere is the entering the data into the EXCEL regression.Brian W. Sloboda (University of Phoenix)EXCEL for StatisticsJune 25, 202038 / 47
Regression AnalysisThe results from EXCELBrian W. Sloboda (University of Phoenix)EXCEL for StatisticsJune 25, 202039 / 47
Regression AnalysisIn the first summary table, you will find the Coefficient ofDetermination, R2. Interpretation: 66.4% of the variation in traveltime is explained by miles traveled. So 23.6 percent is not explainedby the regression.For the multiple R, this is the correlation coefficient which .81.Interpretation: It is a strong positive correlation between the milestraveled and travel times.The ANOVA table gives the F statistic for testing the claim that thereis no significant relationship between your independent and dependentvariables. The sig. value is your p value. Interpretation: Since the.004 is less than .05, the model as a whole is good.The Columns below the Coefficients box gives the b0 and b1 valuesfor the regression equation. The intercept value is always b0. Theb1value is next to your independent variable, x. The regressionequation is Travel Miles 1.23 .067*MILES TRAVELEDBrian W. Sloboda (University of Phoenix)EXCEL for StatisticsJune 25, 202040 / 47
Regression AnalysisInterpretation: Now we can interpret the slope. The slope is .067 inthis simple regression. If there is one additional mile traveled, thentravel miles would increase by .067.In the last P-value column of the coefficient outp
Brian W. Sloboda (University of Phoenix) EXCEL for Statistics June 25, 202030/47. ANOVA: Two-Factor Without Replication Analysis This analysis tool performs a two-factor ANOVA that does not include more than one sampling per group, testing the hypothesis that means from two or more samples are equal (drawn from populations with the same mean). For example, if the experimenter in the above Cola .