Transcription
GenoDup Pipeline: a tool to detectgenome duplication using the dS-basedmethodYafei MaoMarine Genomics Unit, Okinawa Institute of Science and Technology Graduate University, Onna, Okinawa,JapanABSTRACTUnderstanding whole genome duplication (WGD), or polyploidy, is fundamental toinvestigating the origin and diversification of organisms in evolutionary biology. Thewealth of genomic data generated by next generation sequencing (NGS) has resultedin an urgent need for handy and accurate tools to detect WGD. Here, I presenta useful and user-friendly pipeline called GenoDup for inferring WGD using thedS-based method. I have successfully applied GenoDup to identify WGD in empiricaldata from both plants and animals. The GenoDup Pipeline provides a reliable and usefultool to infer WGD from NGS data.Subjects Bioinformatics, Evolutionary Studies, GenomicsKeywords Polyploidy, Whole-genome duplication (WGD), dS-based, Next generation sequenc-ing (NGS), Software, Age distribution, GenoDupINTRODUCTIONSubmitted 5 October 2018Accepted 16 December 2018Published 23 January 2019Corresponding authorYafei Mao, yafei.mao@oist.jpAcademic editorJoseph GillespieAdditional Information andDeclarations can be found onpage 8DOI 10.7717/peerj.6303Copyright2019 MaoDistributed underCreative Commons CC-BY 4.0OPEN ACCESSWhole (large-scale)-genome duplication (WGD), or polyploidy, has been regarded asan evolutionary landmark in the origin and diversification of animals, plants, and otherevolutionary lineages (Van De Peer, Mizrachi & Marchal, 2017). Previous studies haveshown that WGD plays an important role in enhancing speciation and reducing risksof extinction. Moreover, evolutionary novelty can be generated by duplicated genes viasubfunctionalization, neofunctionalization, and dosage effects under WGD (Glasauer& Neuhauss, 2014; Van De Peer, Mizrachi & Marchal, 2017). Therefore, identification ofWGD is the first step to understanding the impacts of WGD and the fates of duplicatedgenes. WGD is now known to be a common event in plants, since the availability of genomicdata generated by next generation sequencing (NGS) (Jiao, 2018; Jiao & Paterson, 2014;Soltis et al., 2009; Soltis et al., 2015). Meanwhile, recent studies also suggest that WGD is acommon evolutionary force in animals (Li et al., 2018; Van De Peer, Mizrachi & Marchal,2017). Hence, an easy-to-use pipeline is urgently needed to infer WGD using NGS data.There are three main approaches to infer WGD with NGS data (Tiley, Ane & Burleigh,2016). First, identification of synteny blocks is the most straightforward method to detectWGD, but it requires high-quality genome assembly, and sadly, many genomes have not yetreached that assembly quality (Bowers et al., 2003). Second, phylogenetic analysis of genefamilies can unravel WGD when organisms have undergone extensive gene loss or genomeshuffling (Jiao et al., 2011; Jiao et al., 2014), but the uncertainty of gene tree reconstructionHow to cite this article Mao Y. 2019. GenoDup Pipeline: a tool to detect genome duplication using the dS-based method. PeerJ 7:e6303http://doi.org/10.7717/peerj.6303
is a serious limitation as well as heavy computation is required. Finally, analysis of ratesof synonymous substitutions per synonymous site (dS) of duplicated genes (the dS-basedmethod or age distribution method) is the most common and widely used approach toinfer WGD (Lynch & Conery, 2000; Tiley, Barker & Gordon Burleigh, 2018).Synonymous substitutions are usually under little selection, thus, rates of synonymoussubstitutions per synonymous site (dS) between two genes can be regarded as a proxyfor the time of their divergence (Lynch & Conery, 2000). In addition, the process ofgene duplication and loss is assumed as a steady birth and death model. Therefore,the distribution of dS values for paralogs should be an ‘‘L-shape’’ curve (Maere et al.,2005). WGD usually generates numerous paralogs simultaneously and thus a peak in thedistribution of dS values can be considered as a WGD event. Compared to phylogenomicand synteny block approaches, assembled genome information and heavy computationare not required for the dS-based method. Yet because of the effects of synonymoussubstitution saturation and gene retention rates, it is difficult for the ds-based methodto infer WGD events, which are too ancient or under lower gene retention rates (Tiley,Barker & Gordon Burleigh, 2018; Van De Peer, Mizrachi & Marchal, 2017). Despite all that,the dS-based method is still a relatively quick and easy way to infer WGD as the firststep, and then the inferred WGD could be confirmed by phylogenomic and synteny blockapproaches.The dS-based method is a fragmented step-wise process (Vanneste et al., 2014). Multiplesoftware packages are required to build gene pairs, align sequences, and calculate dS values.Usually, there are two ways to build gene pairs using the dS-based method. The first one isto use paralogous gene pairs, generated by gene family cluster (orthogroup) informationor gene pair information. Gene pair information is usually created by all-against-all BLASTdirectly while orthogroup information can be generated by a clustering algorithm basedon all-against-all BLAST result (e.g., OrthoMCL Li, Stoeckert Jr & Roos, 2003, OrthoFinderEmms & Kelly, 2015). Generally, orthogroups provide more accurate information ofduplicated genes rather than gene pairs. Secondly, paralogs located at the same syntenyblock are considered as anchor gene pairs. Thus, we could use synteny information togenerate anchor gene pairs. Anchor gene pairs accurately represent duplicated genes andusually provide more information about ancient duplication events. Together, consistentresults from both approaches yield a credible conclusion for the dS-based method.DupPipe is a web-based method to infer WGD using the dS-based method (Barker etal., 2010). In addition, FASTKs is a pipeline to calculate dS values for gene pairs (McKain etal., 2016). Both DupPipe and FASTKs calculate dS values based on gene pair information,but not based on orthogroup information, to infer WGD. Here, an open-source scriptcalled GenoDup Pipeline is developed to infer WGD using the dS-based method based onorthogroup or/and (paralogous or anchor) gene pair information.MATERIALS & METHODSGenoDup Pipeline architectureGenoDup Pipeline is written in Python integrating with alignment of sequences, buildinggene pairs, and dS value calculations. BioPython must be installed and three more executableMao (2019), PeerJ, DOI 10.7717/peerj.63032/11
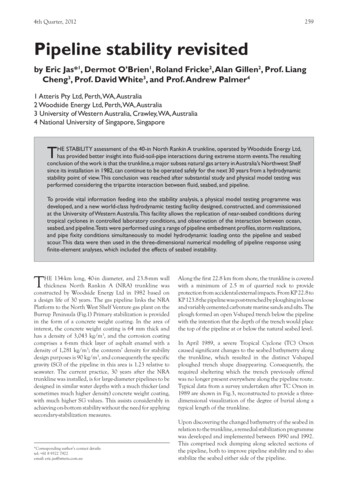
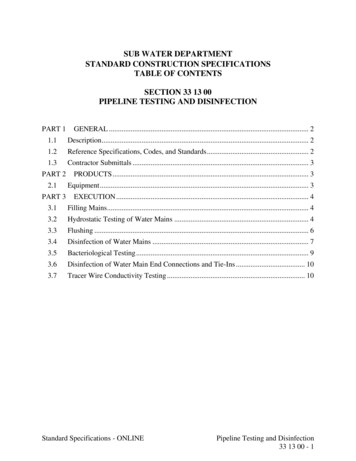
Protein sequences Coding sequencesInputGenoDup PipelineOutputOrthogroup fileGene pair fileFiltering ambiguous sequences(Custom python script)Building gene pairs(Custom python script)Alignments of protein sequences ofeach gene family(MAFFT)Filtering ambiguous sequences(Custom python script)Alignments of protein sequences ofeach gene pair(MAFFT)Alignments of coding sequences based onthe alignments of protein sequences(Translatorx)Building paralogous gene pairs(Custom python script)Alignments of coding sequences based onthe alignments of protein sequences(Translatorx)dS values calculation(Codeml)dS values calculation(Codeml)aln genefamdirectoryPAML resultdirectorydS value.txttext fileFigure 1 Workflow in GenoDup Pipeline. Orange oval boxes represent inputs. Blue boxes representthree subroutines in the GenoDup Pipeline. Red boxes represent outputs generated by GenoDup Pipeline.Full-size DOI: 10.7717/peerj.6303/fig-1dependencies are needed: MAFFT (Katoh et al., 2002), Translatorx (Abascal, Zardoya &Telford, 2010), and Codeml package in PAML (Yang, 2007). Nuclear protein codingsequences (CDS) and the corresponding protein sequences are mandatory inputs torun GenoDup Pipeline. In addition, orthogroup information or gene pair informationis another mandatory input for orthogroup and gene pair approach, respectively. Oncemandatory files have been inputted appropriately, 3 subroutines in GenoDup run as follows(Fig. 1).(1) Alignment of gene pairs: GenoDup Pipeline can automatically align gene pairs orgene families using MAFFT and Translatorx. Before performing gene pair or gene familyalignments, GenoDup firstly filters ambiguous sequences that contain ‘N’, and removesCDS that mis-match to the corresponding protein sequences. Then, MAFFT is used toperform alignments of protein sequences with parameters: localpair and maxiterate: 1000;and Translatorx is used to align CDS based on alignments of the corresponding proteinsequences.(2) Building gene pairs: there are two ways to build gene pairs in GenoDup Pipeline.The first way requires an orthogroup information file and a number (N) as inputs.Only the orthogroups, which contain less than N genes, can be used to build gene pairs.GenoDup Pipeline builds n(n-1)/2 paralogous gene pairs within a gene family (n is thenumber of genes in a gene family). OrthoMCL is recommended to generate orthogroupMao (2019), PeerJ, DOI 10.7717/peerj.63033/11
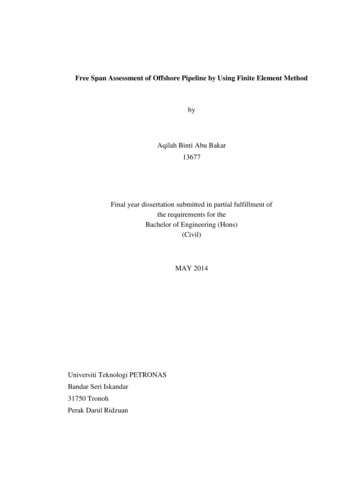
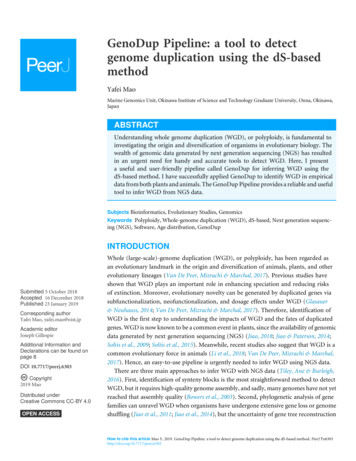
(Li, Stoeckert Jr & Roos, 2003). The second way requires a gene pair information file.Paralogous gene pairs can be generated by all-against-all BLAST. Or, MCScanX (Wang etal., 2012) and i-ADHoRe (Proost et al., 2011) can be used to generate anchor gene pairs.(3) dS value calculations: based on alignments of CDS, GenoDup can automaticallybuild a control file, required by Codeml, for each gene pair. Codeml package in PAMLis used to calculate dS values with parameters: noisy 9, verbose 1, runmode 2,seqtype 1, CodonFreq 2, model 0, NSsites 0, icode 0, fix kappa 0, kappa 1, fix omega 0, and omega 0.5.All of the three subroutines above can automatically run in the GenoDup Pipeline, andfinally generate two directories and a text file as outputs. One directory called aln genefamcontains all CDS alignments in Fasta format. The other directory, called PAML result,contains all results generated by Codeml. A text file called dS value.txt contains all dS valuesof gene pairs. An R script (plot GenoDup.r) is also provided to plot dS distributions.RESULTSEmpirical data validationTo evaluate the performance of the GenoDup Pipeline, I applied it to two empirical data:one is a model plant (Arabidopsis thaliana) and the other is a model animal (Oncorhynchusmykiss). Arabidopsis thaliana has undergone two independent WGDs (alpha and betaWGD) and Oncorhynchus mykiss has experienced four independent WGDs (Ss4R, Ts3R,and Two-rounds WGD) (Berthelot et al., 2014; Vanneste et al., 2014).The CDS, protein sequences, and genome annotation files of Arabidopsis thaliana weredownloaded from Ensembl Plants (http://plants.ensembl.or/Arabidopsis thaliana/Info/Index). Orthogroup information was generated with OrthoMCL and 48,307 genes ofArabidopsis thaliana were clustered into 5,962 orthogroups. N was set as 15, meaning thatthe orthogroups containing less than 15 genes were used to build gene pairs, and 68,231paralogous gene pairs were generated in total. The entire analysis ran in 8 .8 h with 4 cores.The result showed a clearly visible peak (dS value range: 0.5 1) in the dS distribution ofparalogous gene pairs (Fig. 2A). On the other hand, MCScanX was used to generate 99,309anchor gene pairs and the entire analysis ran in 76.8 h with 4 cores (Table 1). The resultshowed the same peak (dS value range: 0.5 1) in the dS distribution of anchor gene pairs(Fig. 2B). Based on assumptions of the dS-based method, the peak represents a WGD eventand the Genodup Pipeline properly detected a WGD event (alpha WGD) in Arabidopsisthaliana.The CDS, protein sequences, and genome annotation files of Oncorhynchus mykiss weredownloaded from GENEOSCOPE (http://www.genoscope.cns.fr/trout/data/). Orthogroupinformation was generated by OrthoMCL and 46,585 genes of Oncorhynchus mykiss wereclustered into 6,562 orthogroups. N was set as 15, meaning that the orthogroups containingless than 15 genes were used to build gene pairs, and 42,888 paralogous gene pairs weregenerated in total. The entire analysis ran in 7.63 h with four cores. The result showedtwo clearly visible peaks (dS value ranges: 0.1 0.5 and 1.2 2) in the dS distribution ofparalogous gene pairs (Fig. 3A). On the other hand, MCScanX was used to generate 26,880Mao (2019), PeerJ, DOI 10.7717/peerj.63034/11
002506000300A01243012dS values34dS valuesFigure 2 dS distributions of paralogous gene pairs and anchor gene pairs in Arabidopsis thaliana.(A) The peak (dS value range: 0.5 1) marked with a red box represents a signal as alpha WGD in the dSdistributions of paralogous gene pairs generated by orthogroups. (B) The peak (dS value range: 0.5 1)marked with a red box represents a signal as alpha WGD in the dS distributions of anchor gene pairs.Full-size DOI: 10.7717/peerj.6303/fig-2Table 1 Statistics of empirical data validation in GenoDup Pipeline.Arabidopsis thalianaOncorhynchus mykissOrthogroupAnchor gene pairsOrthogroupAnchor gene pairsThe number of genepairs68,23199,30942,88826,880Running Time (h)*8.8876.87.6317.65Notes.*The running time includes the OrthoMCL running, each of run of OrthoMCL is less than 10 min.anchor gene pairs and the entire analysis ran in 17.65 h with four cores (Table 1). Theresult showed a peak (dS value range: 0.1 0.5) in the dS distribution of anchor gene pairs(Fig. 3B).GenoDup Pipeline represented consistent result as the previous study on Arabidopsisthaliana and Oncorhynchus mykiss, respectively (Berthelot et al., 2014; Vanneste et al.,2014), indicating that GenoDup Pipeline is a reliable tool to infer WGD using the dS-basedmethod.Comparison GenoDup with FASTKsThe dS-based method have been applied to many studies to infer WGD (Jiao et al., 2012;Vanneste et al., 2014; Zhao et al., 2017) and some software has been built to make thisprocess easier, such as DupPipe, FASTKs, and CoGe. DupPipe and CoGe are web-basedmethods (Barker et al., 2010; Lyons et al., 2008), while FASTKs is an open source pipeline(McKain et al., 2016). Hence, I compared the
method or age distribution method) is the most common and widely used approach to infer WGD (Lynch & Conery, 2000; Tiley, Barker & Gordon Burleigh, 2018). Synonymous substitutions are usually under little selection, thus, rates of synonymous substitutions per synonymous site (dS) between two genes can be regarded as a proxy for the time of their divergence (Lynch & Conery, 2000). In addition .