Transcription
Precast, Prestress BridgeGirder Design ExamplePGSuper TrainingRichard Brice, PEWSDOT Bridge and Structures Office
Precast, Prestressed Girder Design Example – PGSuper Training (2/4/2020)Table of Contents1Introduction. 11.123Bridge Description . 12.1Site Conditions . 12.2Roadway . 12.3Bridge Layout . 2Design Preliminaries . 43.1Construction Sequence. 43.2Girder Length . 43.3Section Properties . 53.3.1Effective Flange Width . 53.3.2Composite Girder Properties. 63.3.3First Moment of Area of deck slab, . 73.3.4Section Property Summary . 73.44Sign Convention . 1Structural Analysis . 83.4.1Girder Construction (Casting Yard) . 83.4.2Erected Girder . 93.4.3Analysis Results Summary . 123.4.4Limit State Responses . 123.4.5Live Load Distribution Factors . 13Flexure Design . 154.1Step 1 Design for Final Service Conditions . 164.1.1Stresses due to loads on non-composite section. 164.1.2Stresses due to loads on the composite section . 174.1.3Check Estimate of Final Concrete Strength . 194.2Step 2 - Design for Lifting without Temporary Top Strands . 204.2.1Proportion Strands . 204.2.2Prestress losses . 204.2.3Check girder stability . 224.2.4Determine Concrete Strength at Lifting . 284.3Step 3 - Design for Shipping . 284.3.1Estimate Prestress Losses at Shipping . 284.3.2Check Girder Stability . 304.3.3Check concrete strength . 394.4Step 4 - Design for Lifting with Temporary Top Strands . 394.5Step 5 – Check Erection Stresses . 40i
Precast, Prestressed Girder Design Example – PGSuper Training (2/4/2020)4.5.1Losses between Transfer to Deck Placement . 404.5.2Stresses . 414.656Step 6 – Check Final Conditions. 424.6.1Losses from Deck Placement to Final . 424.6.2Stresses . 444.6.3Moment Capacity . 464.7Check Splitting Resistance . 504.8Check Confinement Zone Reinforcement . 51Shear Design . 515.1Locate Critical Section for Shear . 515.2Check Ultimate Shear Capacity . 525.2.1Compute Nominal Shear Resistance . 525.2.2Check Requirement for Transverse Reinforcement . 545.2.3Check Minimum Transverse Reinforcement . 545.2.4Check Maximum Spacing of Transverse Reinforcement. 555.3Longitudinal Reinforcement for Shear. 555.4Check Horizontal Interface Shear . 555.4.1Check Nominal Capacity . 565.4.2Check Minimum Reinforcement . 57Check Haunch Dimension . 576.1Slab and Fillet . 576.2Profile Effect . 586.2.1Vertical Curve . 596.2.2Horizontal Curve . 596.2.3Profile Effect . 606.3Girder Orientation Effect . 606.4Excess Camber . 606.4.1Compute Creep Coefficients . 626.4.2Compute Deflections . 626.5Check Required Haunch . 636.6Compute Lower Bound Camber at 40 days . 636.6.1Creep Coefficients . 636.6.2Compute Deflections . 636.7Check for Possible Girder Sag . 637Bearing Seat Elevations . 648Design Summary . 649Load Rating . 64ii
Precast, Prestressed Girder Design Example – PGSuper Training (2/4/2020)9.1Inventory Rating . 649.1.1Moment . 649.1.2Shear . 659.1.3Bending Stress – Service III limit state . 659.2Operating Rating . 669.2.1Moment . 669.2.2Shear . 669.3Legal Loads. 669.3.1Moment . 679.3.2Shear . 679.3.3Bending Stress – Service III limit state . 689.4Permit Loads . 6810Software . 6911References. 69iii
Precast, Prestressed Girder Design Example – PGSuper Training (2/4/2020)List of FiguresFigure 2-1: Bridge Section at Station 7 65 . 2Figure 2-2: Girder Dimensions . 2Figure 2-3: Slab Detail . 3Figure 3-1 Assumed Construction Sequence . 4Figure 3-2 Connection Geometry . 5Figure 3-3 Effective Flange Width . 5Figure 3-4 Centroid of Non-composte and Composite Section . 7Figure 3-5: Slab Haunch . 10Figure 3-6: HL93 Live Load Model . 12Figure 3-7: eg Detail . 13Figure 4-1: Optimized Fabrication Girder Design Procedure . 16Figure 4-2: Optimum Strand Arrangement . 20Figure 4-3: Equilibrium of Hanging Girder . 22Figure 4-4: Girder Self-Weight Deflection during Lifting. 22Figure 4-5: Offset Factor . 24Figure 4-6: Equilibrium during Hauling . 30Figure 4-7: Prestress induced Deflection based on Storage Datum . 31Figure 4-8: Discretized Girder Section for Strain Compatibility Analysis . 48Figure 4-9: Graphical method to Determine Critical Section Location . 51Figure 5-1: Slab Fillet Effect . 58Figure 5-2: General Method for Profile Effect . 58Figure 5-3: Vertical Curve Effect . 59Figure 5-4: Horizontal Curve Effect . 60Figure 5-5: Top Flange Effect . 60Figure 5-6: Camber Effect . 61Figure 5-7: Camber Diagram . 61iv
Precast, Prestressed Girder Design Example – PGSuper Training (2/4/2020)1 IntroductionThe purpose of this document is to illustrate how the PGSuper computer program performs its computations. PGSuper is acomputer program for the design, analysis, and load rating of precast, prestressed concrete girder bridges.A design example followed by a load rating analysis illustrates the engineering computations performed by PGSuper.PGSuper uses a state-of-the-art iterative design algorithm and other iterative computational procedures. Only the finaliterative steps are of interest. To avoid lengthy iterations in this document, trial variables are “guessed” based on the finaliterations produced by the software.PGSuper uses 16 decimals of precision. There will be minor differences between these “hand” calculations and numbersreported by PGSuper. When noted, these calculations adopt numeric values reported by PGSuper.1.1Sign ConventionThis document and PGSuper use the following sign convention.ItemValueCompression 0Tension 0Upward Deflection 0Downward Deflection 0Top Section Modulus 0Bottom Section Modulus 0Strand Eccentricity above Centroid 0Strand Eccentricity below Centroid 02 Bridge Description2.1Site ConditionsNormal ExposureAverage Ambient Relative Humidity: 75%2.2RoadwayAlignmentPI StationBack TangentDeltaRadius10 00N 34 45’ 32” W12 34’ 15” L6000 ftProfilePVI StationPVI Elevation9 00100.00Grade in (𝒈𝒈𝟏𝟏 )-2%Grade out (𝒈𝒈𝟐𝟐 )-1.5%Length600 ftSuperelevationsLeft ���𝑓𝑓𝑓𝑓𝑓𝑓1
Precast, Prestressed Girder Design Example – PGSuper Training (2/4/2020)2.3Bridge LayoutBack of Pavement Seat, Abutment 1, 7 00Back of Pavement Seat, Abutment 2, 8 30Abutments are oriented at 𝑆𝑆 51 47′ 43" 𝑊𝑊Abutment 1, Skew Angle 0 Abutment 2, Skew Angle 1 14′ 29.54" 𝑅𝑅Figure 2-1: Bridge Section at Station 7 65GirdersA 874.531 in2Ix 556339.2 in4Iy 71865.3 in4Yt 34.196 inYb 31.804 inSt 16268.9 in3Sb 17493.0 in3Perimeter 273.284 inWtf 49.0 inWbf 38.375 intweb 6.125 in49.000in.6.125in.66.000in.7 WF66G @ 6’-0”measured radial at BPSf’ci to be determinedf’c to be determinedγc 155 lb/ft3γc 165 lb/ft3 (including rebar)38.375in.Prestressing to be determinedFigure 2-2: Girder DimensionsHarping points at 0.4L from the end of the girder.Interior DiaphragmsRectangular – Between girders only.H 31.5 inT 8.00 inLocated at 0.25Ls, 0.5Ls, and 0.75Ls.2
Precast, Prestressed Girder Design Example – PGSuper Training (2/4/2020)SlabGross Depth 7.5 inOverhang 2’-6”Slab Offset (“A” Dimension) To bedeterminedFillet ¾”Sacrificial Depth ½”f’c 4 ksiγc 150 lb/ft3γc 155 lb/ft3 (including rebar)Future Wearing Surface, 0.035 k/ft2Figure 2-3: Slab DetailStrands0.6” DiameterGrade 270Low Relaxationfpu 270.0 ksifpy 243.0 ksiEps 28500 ksiaps 0.217 in2/per strandTraffic Barrier42” Single SlopeDesign weight 0.690 kip/ft/barrierLoad is distributed to 3 exterior girdersLoad ModifiersDuctilityηD 1.0RedundancyηR 1.0ImportanceηI 1.0CriteriaDesign in accordance with the AASHTO LRFD Bridge Design Specification, Eighth Edition, 2017and the WSDOT Bridge Design ManualLoad Rate in accordance with AASHTO, The Manual for Bridge Evaluation, Second Edition, 2011with 2015 interim revisions and the WSDOT Bridge Design ManualWSDOT policy is to design using gross section properties (BDM 5.6.2.I) usingrefined estimate of prestress losses (BDM 5.4.1.C). PGSuper supports stressanalysis with transformed section properties, the LRFD approximate method forestimating prestress losses, and a non-linear time-step analysis.3
Precast, Prestressed Girder Design Example – PGSuper Training (2/4/2020)3 Design PreliminariesDesign and load rate the first interior girder (Girder B).3.1Construction SequenceFigure 3-1 shows the assumed construction sequence. PGSuper models the various construction stages with ConstructionEvents.Event 1 – Construct Girders and Erect PiersEvent 2 – Erect GirdersEvent 3 – Remove Temporary Strandsand Cast DiaphragmsEvent 4 – Cast DeckEvent 5 – Construct Traffic BarriersEvent 6 & 7– Open to TrafficFigure 3-1 Assumed Construction Sequence3.2Girder LengthFor a typical stub abutment with a Type A connection, the centerline of bearing is located 2’-8.5” from, and measured normalto, the back of pavement seat. The distance from the centerline bearing to the end of the girder is 1’-8.5” measured normal tothe CL Bearing, which is parallel to the back of pavement seat.4
Precast, Prestressed Girder Design Example – PGSuper Training (2/4/2020)Figure 3-2 Connection GeometryThe bearing-to-bearing span length is 𝐿𝐿𝑠𝑠 130𝑓𝑓𝑓𝑓 2.7083𝑓𝑓𝑓𝑓 (2.7083𝑓𝑓𝑓𝑓)/cos(1.241539) 124.58𝑓𝑓𝑓𝑓.The overall girder length is 𝐿𝐿𝑔𝑔 124.58𝑓𝑓𝑓𝑓 1.7083𝑓𝑓𝑓𝑓 (1.7083𝑓𝑓𝑓𝑓)/cos(1.241539) 127.997𝑓𝑓𝑓𝑓.3.3Section PropertiesCompute the composite section properties. The basic girder section properties are in the bridge description.3.3.1 Effective Flange WidthThe effective flange width of a composite concrete deck slab is the tributary width of the member (LRFD 4.6.2.6.1).6'-0"6'-0"6'-0"Figure 3-3 Effective Flange Width𝑤𝑤𝑒𝑒𝑒𝑒𝑒𝑒 6.0𝑓𝑓𝑓𝑓 72𝑖𝑖𝑖𝑖5
Precast, Prestressed Girder Design Example – PGSuper Training (2/4/2020)3.3.2 Composite Girder PropertiesTransform the slab to equivalent girder material and use the parallel axis theorem to compute the composite girder properties.At mid-span the bottom of the slab is above the top of the girder by the fillet amount (¾ “). If the actual camber exceeds thepredicted camber, the ¾” fillet can be easily lost. Assume the bottom of the slab is directly on top of the girder. This providesthe least stiff section where the maximum demand occurs. For simplicity, use this section model at all locations (BDM5.6.2.B.1).PGSuper has options to include the haunch depth in the section properties calculations. Each sectioncan use the minimum haunch depth (fillet dimension) or the actual haunch depth. Using the actualhaunch depth means there is a different set of section properties at every cross section. Using moreprecise section properties may be desirable for load rating.Modulus of elasticity of slab concrete𝐸𝐸𝑐𝑐 120,000𝐾𝐾1 𝑤𝑤𝑐𝑐2 𝑓𝑓𝑐𝑐′0.33 (120,000)(1.0)(0.150)2 (4.0)0.33 4266.223 𝑘𝑘𝑘𝑘𝑘𝑘𝐸𝐸𝑐𝑐 120,000𝐾𝐾1 𝑤𝑤𝑐𝑐2 𝑓𝑓𝑐𝑐′0.33 (120,000)(1.0)(0.155)2 (6.3)0.33 5292.088 𝑘𝑘𝑘𝑘𝑘𝑘Modulus of elasticity of girder concrete assuming a concrete strength of 𝑓𝑓𝑐𝑐′ 6.3𝑘𝑘𝑘𝑘𝑘𝑘𝑛𝑛 4266.223𝑘𝑘𝑘𝑘𝑘𝑘𝐸𝐸𝑐𝑐 𝑠𝑠𝑠𝑠𝑠𝑠𝑠𝑠 0.806𝐸𝐸𝑐𝑐 𝑔𝑔𝑔𝑔𝑔𝑔𝑔𝑔𝑔𝑔𝑔𝑔 5292.088𝑘𝑘𝑘𝑘𝑘𝑘The sacrificial wearing surface is not part of the structural section. Use the structural slab depth for computing 𝑠𝑠 𝑡𝑡𝑔𝑔𝑔𝑔𝑔𝑔𝑔𝑔𝑔𝑔 𝑠𝑠𝑠𝑠𝑠𝑠𝑠𝑠 𝑑𝑑𝑑𝑑𝑑𝑑𝑑𝑑ℎ ��𝑠𝑠𝑠𝑠𝑠𝑠𝑠𝑠𝑠 𝑑𝑑𝑑𝑑𝑑𝑑𝑑𝑑ℎ 7.5𝑖𝑖𝑖𝑖 0.5𝑖𝑖𝑖𝑖 ���)(7.0𝑖𝑖𝑖𝑖) 406.300𝑖𝑖𝑖𝑖66.0𝑖𝑖𝑖𝑖 𝐴𝐴𝑐𝑐 𝑏 ���𝑖𝑖𝑖 ��� � ) 56051.434𝑖𝑖𝑛𝑛3 43.762𝑖𝑖𝑖𝑖 𝑛𝑛2𝑌𝑌𝑡𝑡𝑡𝑡 𝑔𝑔𝑔𝑔𝑔𝑔𝑔𝑔𝑔𝑔𝑔𝑔 𝐻𝐻𝑔𝑔 𝑌𝑌𝑏𝑏𝑏𝑏 66.0𝑖𝑖𝑖𝑖 43.762𝑖𝑖𝑖𝑖 22.238𝑖𝑖𝑖𝑖7.0𝑖𝑖𝑖𝑖2 43.762𝑖𝑖𝑖𝑖 25.768𝑖𝑖𝑖𝑖66.0𝑖𝑖𝑖𝑖 31.804𝑖𝑖𝑖𝑖 43.762𝑖𝑖𝑖𝑖 ���𝑖𝑖𝑖)(7.0𝑖𝑖𝑖𝑖)312 356051.434𝑖𝑖𝑛𝑛3Io (Area)(d2 𝐼𝐼𝑥𝑥 952201.679𝑖𝑖𝑛𝑛46
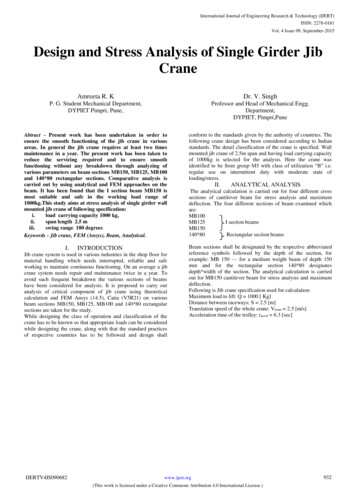
Precast, Prestressed Girder Design Example – PGSuper Training (2/4/2020)𝑆𝑆𝑏𝑏𝑏𝑏 𝑆𝑆𝑡𝑡𝑡𝑡 𝑔𝑔𝑔𝑔𝑔𝑔𝑔𝑔𝑔𝑔𝑔𝑔 𝐼𝐼𝑥𝑥952201.679𝑖𝑖𝑛𝑛4 𝑡𝑡𝑡 𝑔𝑔𝑔𝑔𝑔𝑔𝑔𝑔𝑔𝑔𝑔𝑔 3.3.3 First Moment of Area of deck slab,𝑄𝑄𝑠𝑠𝑠𝑠𝑠𝑠𝑠𝑠 𝐴𝐴𝑠𝑠𝑠𝑠𝑠𝑠𝑠𝑠 𝑌𝑌𝑡𝑡𝑡𝑡 𝑔𝑔𝑔𝑔𝑔𝑔𝑔𝑔𝑔𝑔𝑔𝑔 3.3.4 Section Property Summary952201.679𝑖𝑖𝑛𝑛4 �𝑖 406.3𝑖𝑖𝑛𝑛2 22.238𝑖𝑖𝑖𝑖 10457.349𝑖𝑖𝑛𝑛322Below are the section properties from PGSuper. They are slightly different then the properties computed above. Use thesection properties reported by PGSuper for better agreement between these calculations and the software.72"34.196"66"31.804"Composite CGNoncomposite CG22.239"73"43.761"Figure 3-4 Centroid of Non-composte and Composite SectionTable 3-1: Section Properties from PGSuperGirderComposite Girder𝑰𝑰𝒙𝒙556339.2 𝒕𝒕𝒕𝒕𝒕𝒕 .196 𝑖𝑖𝑖𝑖22.239 𝑖𝑖𝑖𝑖31.804 𝑖𝑖𝑖𝑖43.761 𝑖𝑖𝑖𝑖Area, ��𝒕 4.531 𝑖𝑖𝑛𝑛271865.3 𝑖𝑖𝑛𝑛4-1280.808 𝑖𝑖𝑛𝑛2-29.239 𝑖𝑖𝑖𝑖𝑺𝑺𝒕𝒕𝒕𝒕𝒕𝒕 268.9 𝑖𝑖𝑛𝑛342816.4 𝑖𝑖𝑛𝑛3𝑺𝑺𝒃𝒃17493.0 𝑖𝑖𝑛𝑛321759.0 𝑖𝑖𝑛𝑛3Effective Flange Width, ���𝒕𝒕𝒕 ��𝒔𝒔𝒔𝒔𝒔Perimeter-273.284 𝑖𝑖𝑖𝑖40396.8 𝑖𝑖𝑛𝑛310457.2 𝑖𝑖𝑛𝑛371.996 𝑖𝑖𝑖𝑖-7
Precast, Prestressed Girder Design Example – PGSuper Training (2/4/2020)3.4Structural AnalysisThere are several significant stages during the life of a prestressed girder. PGSuper automatically models these stages asConstruction Events. The events are:1) Construct girders (aka Casting Yard Stage)a)Tension strands, form girders, cast concrete, concrete curing. Initial relaxation of the prestressing strand occurs.b) Strip forms and impart the precompression force into the girder (aka Release)c)Move girders into storage area (Initial lifting)d) Elapsed time during storage (creep, shrinkage, and relaxation losses occur)2) Erect girdersa)Prior to erection, the girders must be transported from the fabrication facility to the bridge siteb) Erect and brace girdersc)De-tension temporary strands (if applicable)3) Cast diaphragms and deck (dead load applied to non-composite girder section)4) Install railing system (traffic barriers, sidewalks, etc). (dead load applied to composite section)5) Final without Live Load (includes future overlay if applicable)6) Final with Live LoadPGSuper models the individual steps within a Construction Event with Analysis Intervals. For example, Event 1 – ConstructGirders, models five analysis intervals: Tension Strands and Cast Concrete, Elapsed Time during Curing, Prestress Release,Lifting, Placement into Storage, and Elapsed Time during Storage.The analysis intervals are a general modelling approach associated with time-step analysis. Precast girder design normallyuses a pseudo time-step analysis. However, the PGSuper can perform a refined non-linear time-step analysis. PGSplice usesthe non-linear time-step analysis as well.3.4.1 Girder Construction (Casting Yard)Girder construction at the casting yard consists of tensioning strands, placing mild reinforcement, installing girder forms, andplacing concrete. Stripping of girder forms occurs after the concrete r
and the WSDOT Bridge Design Manual Load Rate in accordance with AASHTO, The Manual for Bridge Evaluation, Second Edition, 2011 with 2015 interim revisions and the WSDOT Bridge Design Manual . WSDOT policy is to design using gross section properties (BDM 5.6.2.I) using refined estimate o