Transcription
Yin et al. BMC Oral Health(2020) ARCH ARTICLEOpen AccessCorrelation between clinical parameters ofcrown and gingival morphology of anteriorteeth and periodontal biotypesXiao-jie Yin1,2, Bang-yan Wei1, Xiu-ping Ke1, Ting Zhang1, Meng-yang Jiang1, Xia-yan Luo1 and Hui-qiang Sun1,2*AbstractBackground: In this study, we conducted a quantitative analysis of the clinical parameters of crown and gingivalmorphology (CGM) of the maxillary anterior teeth (MAT). We also analyzed the correlation of these parameters withperiodontal biotype (PB), with a view to providing objective standards for PB diagnosis.Methods: The three-dimensional (3D) maxillary digital models of 56 individuals were obtained using an intra-oralscanner. The following parameters were measured with the SpaceClaim software: gingival angle (GA), papilla width(PW), papilla height (PH), crown length (CL), crown width (CW), crown width/crown length ratio (CW/CL), buccolingual width of the crown (BLW), contact surface width (CSW), and contact surface height/crown length ratio (CS/CL). The PB were determined based on the transparency of the periodontal probe through the gingival sulcus.Independent factors influencing PB were analyzed by logistic regression, and the optimal cutoff values for theindependent influencing factors were analyzed using receiver operating characteristic curves (ROC curves).Results: There was no significant difference in the parameters of CGM of the MAT at the left and right sides. Thethick biotype accounted for 69.6%, and the parameters of GA, PW, PH, CW, CW/CL and CS/CL were significantlycorrelated with PB (P 0.2). GA (odds ratio (OR) 1.206) and PW (OR 5.048) were identified as independentpredictive factors of PB, with areas under the ROC curve (AUC) of 0.807 and 0.881, respectively, and optimal cutoffvalues of 95.95 and 10.01 mm, respectively.Conclusion: The CGMs of the MAT at the left and right side are symmetrical. The thin biotype accounts for a smallproportion, and GA and PW are independent influencing factors of PB. GA of 95.95 and PW of 10.01 mm are theoptimal cutoff values for categorization of individuals as thick biotype. This indicates that when the GA and PW ofthe right maxillary central incisor are G 95.95 and 10.01 mm, respectively, there is a higher probability thatthese individuals will be categorized as thick biotype.Keywords: Periodontal biotype, Gingival morphology, Crown morphology, Digital models, Cutoff valueBackgroundIn 1989, Seibert and Lindhe [1] proposed the concept ofPB, that is, the thickness of the bucco-lingual gingivacan be divided into thick and thin biotypes. The CGMcoordination and the stability of the gingival margin differ between different PBs, which directly influences theesthetic effect of restoration and patient satisfaction.* Correspondence: whitedove69@163.com1Department of Prosthodontics, School of Stomatology, ShandongUniversity, Jinan 250012, Shandong, China2Shandong Key Laboratory of Oral Tissue Regeneration & ShandongEngineering Laboratory for Dental Materials and Oral Tissue Regeneration,Jinan, Shandong, ChinaFurthermore, it has been proposed that PB has an important influence on the treatment effect and prognosis of periodontal surgery, plantation and orthodontics[2–4]. Therefore, correct classification of the PB iscritically important in dental treatment.In recent years, the correlation of PB with clinical parameters such as gingival thickness, crown morphology,and alveolar bone morphology has received increasingattention [5–12]. De Rouck et al. [5] measured intra-oralindexes including CW/CL, keratinized gingival width,and papilla height using calipers and a periodontalprobe, and divided PBs into thin-scalloped biotype, The Author(s). 2020 Open Access This article is distributed under the terms of the Creative Commons Attribution 4.0International License (http://creativecommons.org/licenses/by/4.0/), which permits unrestricted use, distribution, andreproduction in any medium, provided you give appropriate credit to the original author(s) and the source, provide a link tothe Creative Commons license, and indicate if changes were made. The Creative Commons Public Domain Dedication o/1.0/) applies to the data made available in this article, unless otherwise stated.
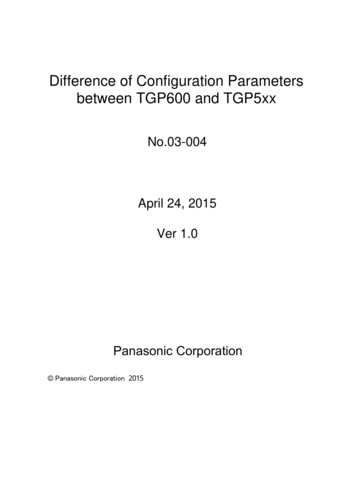
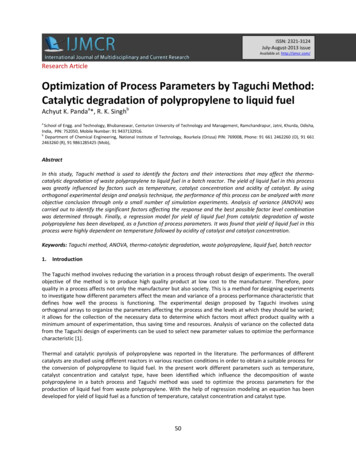
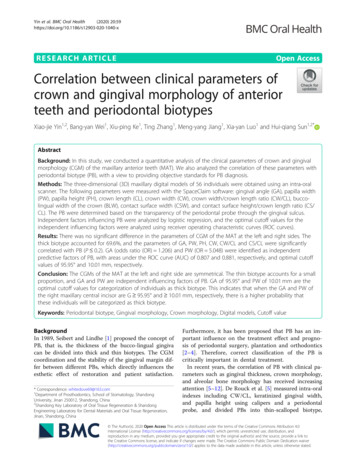
Yin et al. BMC Oral Health(2020) 20:59thick-flat biotype and thick-scalloped biotype using thecluster analysis method. Stein et al. [10] conductedintra-oral measurements of keratinized gingival widthand gingival thickness using a periodontal probe, measured the CW/CL and papilla height using image analysis software, and explored the correlation ofparameters such as gingival thickness and CW/CL.However, the correlation of PBs with maxillary marginand papilla width, in addition to the independent influencing factors of PBs, remain to be clarified.The use of calipers and periodontal probes to measurethe clinical parameters of gingival morphology are subject to the disadvantages of inconvenience and low accuracy. The results obtained using image analysissoftware are inclined to be influenced by the position ofthe head although most reports do not include a unifiedstipulation of the spatial position of head [9, 13]. Withthe rapid development of computer technology,computer-aided design/computer-aided manufacturing(CAD/CAM) technology has been introduced for the esthetic restoration of anterior teeth. Lee et al. [14] analyzed the correlation between PB and the gingival papillaof the MAT using 3D digital models, while Wong et al.[15] explored the esthetic relationship between the incisal edge of the MAT and the upper border of the lowerlip using 3D digital models.In this study, we conducted a quantitative analysis ofthe clinical parameters of MAT, including GA, PW andPH, using an intra-oral scanner and SpaceClaim software, with a view to providing a more accurate referencefor the computer-aided esthetic analysis and design ofanterior teeth. The transparency of the periodontalprobe through the gingival sulcus was used for periodontal biotyping, thereby exploring the correlation ofthe PB of the right maxillary central incisor with theclinical parameters of the gingiva and crown, and analyzing the cutoff value of independent influencing factorswith the aim of providing objective standards for periodontal biotyping.Page 2 of 8no sleep bruxism history, no attrition of full dentition(attrition score 2); 4) normal or incomplete overbiteand overjet; 5) normal occlusal curve; 6) no administration of gingival hyperplasia-related medicines within thelatest 3 months; 7) no obvious gingival color pigmentation; and 8) age: 18–40 years.3D digital model constructionThe maxillary casts of the study participants werescanned using an intra-oral scanner and the STL formatmodel files were numbered #1–#56. The *.STL files wereimported into SpaceClaim software to generate 3Ddigital models (Fig. 1).Determination of the reference plane and estheticlandmarksThe reference plane and esthetic landmarks were identified as previously described [16]. Briefly, for the description of the positional relationship between the maxillarydentition and gingival landmarks, an occlusal plane wasselected as the horizontal reference plane, with 22 esthetic landmarks including the gingival zenith and thevertical bisected middle surface along the long axis ofthe clinical crown (VBMS). The intersection betweenthe VBMS and gingival margin at the labial side wasmarked as the midpoint (Fig. 2).CGM index and measurement (accuracy: 0.01 mm)CGM indexes were measured according to specific definitions as follows: Gingival angle (GA): the angle between the gingivalzenith at the labial side and the top of thecorresponding mesial and distal papilla [9] (Fig. 2c). Papilla width (PW): the distance between thegingival zeniths of the two adjacent teeth. EachMethodsStudy participants and inclusion criteriaFrom January 2018 to June 2018, 56 study participants(13 males and 43 females) were selected from the oncampus students and young nurses from the School ofStomatology of Shandong University (China). The participants were Han nationality and the average age was23.6 2.8 years. The following inclusion criteria were applied: 1) the MAT and the maxillary first molar on bothsides were in orderly alignment and had no anodontia,interspersed diastema, wedge-shaped defect, dental caries, dental fillings or restorations; 2) healthy periodontaltissue: plaque index and gingival index 1, without obvious gingival recession or periodontal disease history; 3)Fig. 1 Intra-oral image and 3D digital models. a Intra-oral image (b)3D digital model
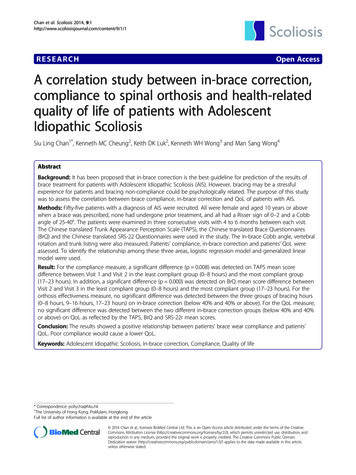
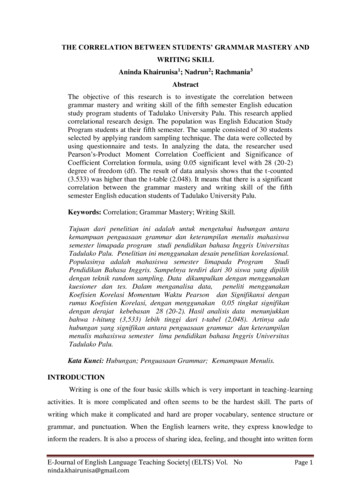
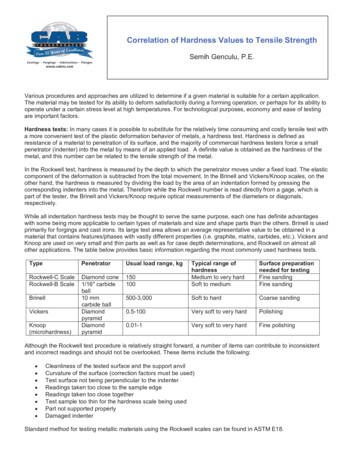
Yin et al. BMC Oral Health(2020) 20:59Page 3 of 8Fig. 2 Esthetic-related landmarks (a) Landmarks 1 and 2, the mesio-incisal angle of the maxillary central incisors on both sides; Landmark 3, themidpoint of the mesio-incisal angle ligature between the maxillary central incisors on both sides; Landmarks 4 and 5, the mesio-buccal cusp tipof the maxillary right and left first molars; Landmarks 6–11, the gingival edge apical top of the MAT on the labial side; Landmark 12–16, the topof the gingival papilla of the MAT; Landmark 23, the midpoint of the right maxillary central incisors at the gingival edge midpoint. b Landmarks17–22, the top at the direction of the gingival edge of the MAT on the palate side value was then associated with the mesiallypositioned tooth (Fig. 2c).Papilla height (PH): the shortest distance from the topof the papilla to the segment PW [14]. The mesial PHwas recorded for every tooth position (Fig. 2c).Crown length (CL): the distance from the gingivalzenith to the midpoint of incisal edge (or dentalcusp). (Fig. 2c).Crown width (CW): the distance between theapproximal tooth surfaces was recorded at theborder between the middle and cervical portions.(Fig. 2c).Bucco-lingual width of the crown (BLW): thedistance from the gingival margin at the side of thepalate side to the apex to the gingival midpoint onthe labial side [9]. (Fig. 2b).Contact surface width (CSW): the distance betweenthe contact areas of the most apical portion and themost incisal portion. The mesial CSW was recordedfor every tooth position. (Fig. 2c).Contact surface height (CS): the shortest distancefrom the most apical point in the mesial contactarea to the incisal edge [13]. The mesial contact areaheight was recorded for every tooth position, andCS/CL value was calculated (Fig. 2c).All measurement data were obtained by the same clinical researcher. After an interval of 1 month, six sampleswere randomly selected from the master samples for remeasurement.Evaluation of PBs based on the transparency of theperiodontal probe through the gingival sulcusStudy participants lay in the supine position on thetreatment chair, with the occlusal plane perpendicular tothe ground. After the area of the MAT was dried and ablack background put into the mouth, the standardWilliams periodontal probe (KPW, Shanghai KangqiaoDental Instruments Factory, Shanghai, China) wasplaced into the sulcus at the midfacial aspect of the rightmaxillary central incisor. The periodontal probe wasplaced parallel to the long axis of the clinical crown at aprobing depth of 1 mm (the probe would reach to thebottom of the gingival sulcus at a probing depth 1 mm)[17]. A digital camera (Nikon D750, Nikon Corporation,Tokyo, Japan) equipped with a Microspur 105 mm lens(AF-S VR 105 mm f/2.8G IF-ED, Nikon Corporation)and a Microspur flashlight (Nikon R1C1, Nikon Corporation) was used to take photos in a standardized manneras follows: 1) unified shooting conditions with respect tofactors such as light, background, and distance; 2) adoption of the same camera setting parameters; and 3) theteeth evaluated were placed at the center of photos,which should include around two natural teeth. All theexaminations were completed by the same postgraduatestudent, and all photos were obtained by the samenurse.The photos of all experimental subjects were randomlyplaced into the PPT file (Microsoft). After training andalignment by examiners, three postgraduates independently conducted qualitative periodontal biotyping according to the following standards for PB classification[5, 10, 14, 18, 19]: 1) for thin biotypes, the probe was visible through the gingival tissue when placed within thegingival sulcus (Fig. 3a); 2) for thick biotypes, the probewas not visible through the gingival tissue when placedwithin the gingival sulcus (Fig. 3b).After an interval of 2 weeks, the qualitative periodontalbiotyping repeated independently, with the aim of lowering the bias in the first assessment. The determination
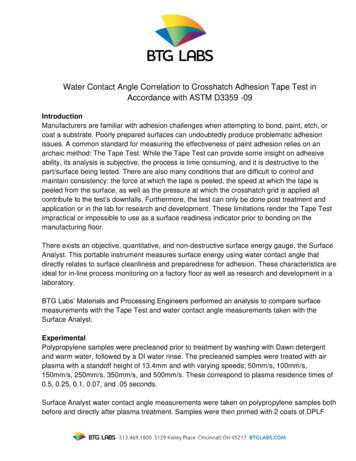
Yin et al. BMC Oral Health(2020) 20:59Page 4 of 8Fig. 3 Periodontal biotype. a Probe visible through marginal tissue; thin biotype. b Probe not visible through marginal tissue; thick biotypeof PBs for every study participant was based on consistent biotyping by two out of three examiners, with Kappaadopted to verify the reliability.Statistical analysisFor all the continuous variables (e.g., GA and PW), thetest-retest reliability of the examiners was evaluatedthrough the Pearson correlation coefficient test usingSPSS Statistics 24.0 software (IBM, Chicago, USA), whilethe intra-examiner repeatability was evaluated with theKappa test. In addition, the Shapiro–Wilks test was usedto verify the normal distribution of data. The averagevalues of clinical parameters were further analyzed byverifying that there was no significant difference in measurements of clinical parameters of the teeth at the sameposition on both sides of the mouth using the Wilcoxonsigned-rank test and paired sample t-test. The normaldistribution of data was confirmed, with measurementdata expressed in mean standard deviation (SD). Analysis of variance (ANOVA) was used to evaluate differences between groups. Enumeration data were expressedas frequencies, and the chi-square test (χ2 test) was usedto evaluate differences between groups. PB was assignedas a dependent variable, while the factors with ANOVAP 0.2 were assigned as independent variables. Forward:LR method was used for logistic regression to study theindependent influence factors of PBs (inclusion equationstandard 0.05, elimination standard 0.10). ROC curveanalysis was repeated to evaluate the value of the factorsthat were finally entered into the logistic regressionmodel for the diagnosis of PBs. P-values 0.05 wereconsidered to indicate statistical significance.ResultsTest-retest reliability analysis showed relatively high reliability of all indexes (r 0.916, P 0.001), except thePearson correlation coefficient in the PH associated withthe mesial aspect of the maxillary canines (r 0.657, P 0.001), indicating the repeatability of the data. Theaverage Kappa coefficient of the transparency of theperiodontal probe through the gingival sulcus was 0.733(P 0.001), indicating the high degree of reliability of theevaluation method. The Wilcoxon signed-rank test andpaired sample t-test. Results showed that there were nosignificant differences in the measurements of clinicalparameters such as GA and PW for the teeth at thesame location and interdental position on both sides ofthe mouth (P 0.069).The CGM characteristics of the MAT of the studyparticipants are as shown in Table 1.The periodontal biotyping of the study participants isshown in Table 2. Our results showed that among thethick biotype accounted for the largest proportion(69.6%) of the 56 study participants.The characteristic parameters of periodontal biotypes of different genders are shown in Table 3.ANOVA test showed that there were statistical differences in periodontal biotypes between different genders.(P 0.2).For different PBs, the CGM characteristics of the rightmaxillary central incisors are shown in Table 4. ANOVAshowed that there were significant differences amongthe PBs in terms of in GA, PW, PH, CW, CW/CL andTable 1 The CGM characteristics of MATFactorCentral incisorLateral incisorCanineMean SDMean SDMean SDGA( )98.19 7.6996.24 10.0389.45 6.63PW (mm)10.05 0.797.83 0.607.97 0.65PH (mm)3.65 0.593.37 0.533.28 0.57CL (mm)9.53 0.778.26 0.779.09 0.79CW (mm)7.51 0.625.84 0.486.64 0.52CW/CL0.791 0.0770.713 0.0810.735 0.070BLW (mm)7.22 0.536.56 0.528.38 0.48CSW (mm)4.39 0.723.56 0.562.62 0.57CS/CL0.597 0.0690.623 0.0700.635 0.057
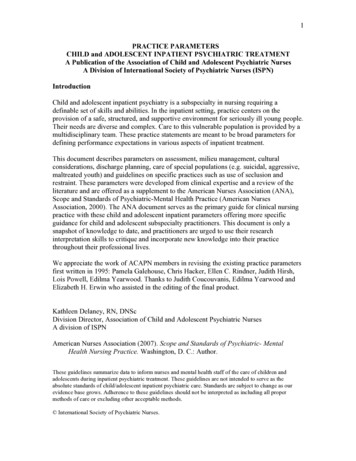
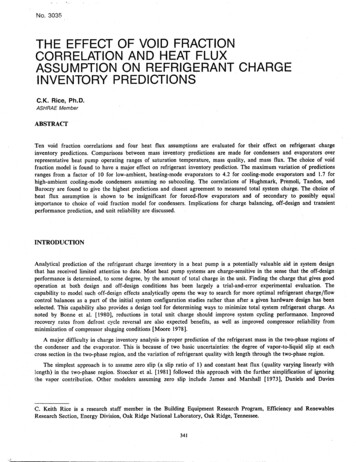
Yin et al. BMC Oral Health(2020) 20:59Page 5 of 8Table 2 The frequency distribution of PBsMale participants (n)Female participants (n)Total [n(%)]Table 4 The CGM characteristics of the right maxillary centralincisors in different PBsThin11617 (30.4)IndexThinThickΧ2/FPThick122739 (69.6)GA ( )92.73 6.21101.68 8.0316.7040.00056 (100)PW (mm)9.43 0.5310.39 0.6131.9550.000PH (mm)3.91 0.583.53 0.565.1630.027CL (mm)9.69 0.819.41 0.811.4280.237Total1343CS/CL (P 0.2), but no significant differences in termsof CL, BLW, and CSW (P 0.2).Table 5 presents the logistic regression results of multiple PB factors, showing that GA (OR 1.206, P 0.016) and PW (OR 5.048, P 0.002) were the independent influencing factors of PB. The logistic regression model was used to re-categorize PBs, with a totalaccuracy of 85.7%, as shown in Table 6.A ROC curve was generated with GA and PW as thetest variables as shown in Fig. 4. The AUCs of GA andPW were 0.807 and 0.881, respectively, and the optimalcutoff values of GA and PW were 95.95 and 10.01 mm,respectively. The combined AUC of GA and PW was0.935, which was larger than the singular AUC for GAand PW, showing that the combined diagnosis of GAand PW contributes to increasing the diagnostic efficiency of PBs. In other words, when the GA and PW ofthe right maxillary central incisor are 95.95 and 10.01mm, respectively, the optimal cutoff value for categorizing study participants as thick biotype, as shown inTable 7.DiscussionIn clinical practice, different PBs may react differentlyto inflammation and various types of dental treatment. Accurate pre-treatment diagnosis of the PB ofpatients is necessary to obtain the ideal effect. In thisstudy, we conducted a quantitative analysis of theCGM morphology in terms of the clinical parametersof upper anterior teeth using 3D digital models withthe aim of providing an accurate reference for the esthetic analysis and computer-aided design of anteriorteeth, determining the cutoff value of gingiva andcrown clinical parameters, and establishing clinicalguidelines to offer quantitative guidance for periodontal biotyping.Among the 56 participants included in this study,the thick biotype accounted for the largest proportion (69.6%), while thin biotype accounted for only30.4%. Furthermore, there was statistically significant difference in PBs between males and females,CW (mm)7.15 0.587.67 0.618.6440.005CW/CL0.736 0.0650.819 0.07814.4650.000BLW (mm)7.16 0.537.25 0.590.2640.61CSW (mm)4.33 0.704.50 0.820.550.462CS/CL0.575 0.0740.611 0.0742.7720.102as shown in Table 3, which is consistent with theresults reported by De Rouck et al. [5]. However,Lee et al. [14] found that sex had no significant influence on PBs, with the thin biotype accounting for21.8% of the individuals evaluated. In contrast, Frostet al. [18] reported that the thin biotype accountedfor only 7% of their study participants. It can bespeculated that sample size and ethnic differencesmay be the major factors contributing to the inconsistency in these results.The contour of the gingival margin is determined by parameters such as the gingival angle, papilla width, and papilla height. The GA averages of the maxillary centralincisor, lateral incisor and canines of all study participantswere 98.19 7.69 , 96.24 10.03 and 89.45 6.63 , respectively. However, Olsson et al. [9] reported GAs for themaxillary central incisor, lateral incisor and canines of86.60 , 82.80 and 80.29 , respectivel
lysis software, and explored the correlation of parameters such as gingival thickness and CW/CL. However, the correlation of PBs with maxillary margin and papilla width, in addition to the independent influ-encing factors of PBs, remain to be clarifi