Transcription
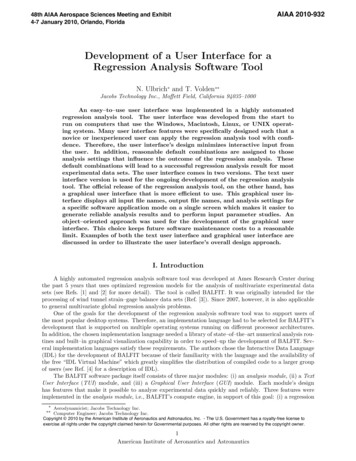
48th AIAA Aerospace Sciences Meeting and Exhibit4-7 January 2010, Orlando, Florida AIAA 2010-932 Development of a User Interface for aRegression Analysis Software ToolN. Ulbrich and T. Volden Jacobs Technology Inc., Moffett Field, California 94035–1000An easy–to–use user interface was implemented in a highly automatedregression analysis tool. The user interface was developed from the start torun on computers that use the Windows, Macintosh, Linux, or UNIX operating system. Many user interface features were specifically designed such that anovice or inexperienced user can apply the regression analysis tool with confidence. Therefore, the user interface’s design minimizes interactive input fromthe user. In addition, reasonable default combinations are assigned to thoseanalysis settings that influence the outcome of the regression analysis. Thesedefault combinations will lead to a successful regression analysis result for mostexperimental data sets. The user interface comes in two versions. The text userinterface version is used for the ongoing development of the regression analysistool. The official release of the regression analysis tool, on the other hand, hasa graphical user interface that is more efficient to use. This graphical user interface displays all input file names, output file names, and analysis settings fora specific software application mode on a single screen which makes it easier togenerate reliable analysis results and to perform input parameter studies. Anobject–oriented approach was used for the development of the graphical userinterface. This choice keeps future software maintenance costs to a reasonablelimit. Examples of both the text user interface and graphical user interface arediscussed in order to illustrate the user interface’s overall design approach.I. IntroductionA highly automated regression analysis software tool was developed at Ames Research Center duringthe past 5 years that uses optimized regression models for the analysis of multivariate experimental datasets (see Refs. [1] and [2] for more detail). The tool is called BALFIT. It was originally intended for theprocessing of wind tunnel strain–gage balance data sets (Ref. [3]). Since 2007, however, it is also applicableto general multivariate global regression analysis problems.One of the goals for the development of the regression analysis software tool was to support users ofthe most popular desktop systems. Therefore, an implementation language had to be selected for BALFIT’sdevelopment that is supported on multiple operating systems running on different processor architectures.In addition, the chosen implementation language needed a library of state–of–the–art numerical analysis routines and built–in graphical visualization capability in order to speed–up the development of BALFIT. Several implementation languages satisfy these requirements. The authors chose the Interactive Data Language(IDL) for the development of BALFIT because of their familiarity with the language and the availability ofthe free “IDL Virtual Machine” which greatly simplifies the distribution of compiled code to a larger groupof users (see Ref. [4] for a description of IDL).The BALFIT software package itself consists of three major modules: (i) an analysis module, (ii) a TextUser Interface (TUI) module, and (iii) a Graphical User Interface (GUI) module. Each module’s designhas features that make it possible to analyze experimental data quickly and reliably. Three features wereimplemented in the analysis module, i.e., BALFIT’s compute engine, in support of this goal: (i) a regression Aerodynamicist; Jacobs Technology Inc. Computer Engineer; Jacobs Technology Inc.Copyright 2010 by the American Institute of Aeronautics and Astronautics, Inc. - The U.S. Government has a royalty-free license toexercise all rights under the copyright claimed herein for Governmental purposes. All other rights are reserved by the copyright owner.1American Institute of Aeronautics and Astronautics
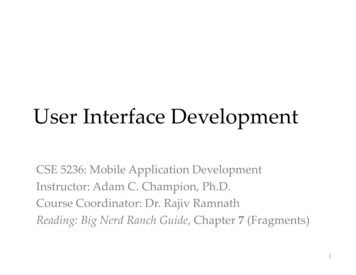
model optimization algorithm (see Ref. [1]), (ii) a simplified data input file format, and (iii) an automatedanalysis report generation feature. Both versions of BALFIT’s user interface, i.e., the TUI and the GUI,allow the user to interact with the analysis module. They assign (i) input file names, (ii) output file names,and (iii) analysis settings for a specific analysis task. Reasonable default combinations of the analysis settingsare used in both the TUI and the GUI that make it possible for a novice or inexperienced user to generateregression models of the given experimental data that meet strict statistical quality requirements.Differences between the TUI and the GUI exist because they were developed for different purposes. TheTUI primarily supports the ongoing development of the analysis module. The GUI, on the other hand, isintended for the efficient use of BALFIT in a production environment. Table 1 below lists advantages anddisadvantages of the two versions of BALFIT’s user interface.Table 1: Comparison of TUI and GUI (advantage [ ], disadvantage [ ])ATTRIBUTETUIGUIDEVELOPMENT EFFORT[ ][ ][ ][ ][ ][ ][ ][ ]MAINTENANCEEASE–OF–USERUN–TIME ENVIRONMENT COSTSBALFIT may be run on an analysis computer using either the TUI or the GUI version of the executable.The TUI version can only be run using the “IDL Development Environment,” i.e., a licensed version of theIDL software. It is written in sequential logic and can easily be modified. The GUI version, on the otherhand, can be run using a free runtime utility called “IDL Virtual Machine.” Therefore, the GUI version doesnot require a licensed version of the IDL software package. Overall, the GUI is easier to use than the TUI. Itwas developed (i) to provide a modern interface to the user and (ii) to minimize software distribution costs.A first version of the GUI was completed in 2006 (see Ref.[5]). Significant improvements of the analysismodule were made since that time. Now, the analysis module supports classical regression analysis as wellas wind tunnel strain–gage balance data analysis applications. Therefore, it became necessary to completelyrevise the original version of the GUI. It was also decided to rewrite the GUI using an object–orientedapproach. This improvement will make it easier to maintain the software in the future.In the next section of the paper the architecture of the BALFIT application is reviewed. Then, keyfeatures of the TUI and the GUI are discussed.II. Model–View–Controller ArchitectureThe BALFIT application uses the so–called “Model–View–Controller” (MVC) architecture. The MVCarchitecture is a design pattern that simplifies application development and maintenance (see Ref. [6] and[7] for more detail). The goal of the MVC design pattern is to separate the application object (Model) fromthe way it is represented to the user (View) and from the way in which the user controls it (Controller).It achieves this by splitting the application into the three logical components shown in Fig. 1a. The threecomponents are described as follows:Model – A model represents an application’s data and contains the logic for accessing and manipulatingthat data. In BALFIT, the model component is the analysis module. It contains all logic related to performingregression analysis tasks and provides an interface for the other components.View – The view controls the “look and feel” of the application and provides facilities (i) to collect datafrom the user and (ii) to display messages from the model (analysis module).Controller – The controller is responsible for intercepting and translating user input into actions to beperformed by the model (analysis module). Together, the View and the Controller define the “user interface”that the user sees when using the BALFIT application (see Fig. 1b).The MVC architecture supports multiple views of the same model and provides efficient modularitywhich allows development of components to proceed in parallel. These features have allowed both a TUIand GUI to be developed independently. In addition, this architecture simplifies growth which has allowed2American Institute of Aeronautics and Astronautics
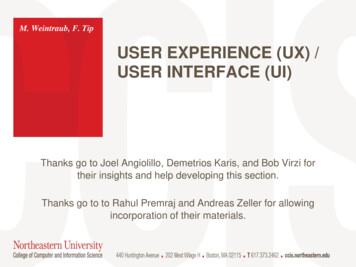
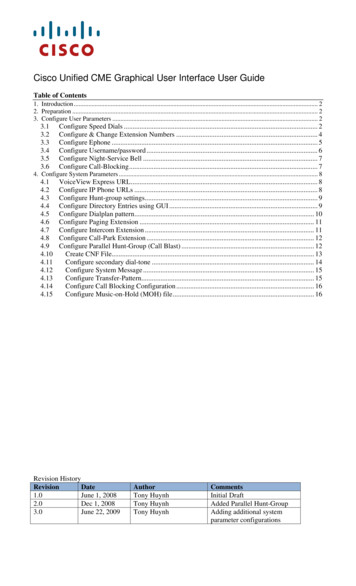
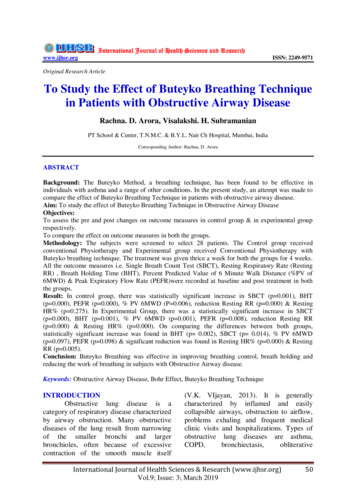
BALFIT to be extended to support both classical regression analysis and strain–gage balance data analysistasks. Each analysis task in BALFIT is implemented in a separate View and Controller object which istailored specifically for the task. This arrangement makes it possible to add analysis tasks to the GUIwithout concern for affecting other analysis tasks.Figure 2 shows the actual implementation of the MVC architecture in BALFIT. BALFIT’s user interfacemodule and the analysis module are depicted. The user interface module, i.e., the TUI or the GUI, is usedto select (i) the regression analysis type, (ii) the analysis task (by assigning the software application mode),(iii) the analysis settings, and (iv) the input and output file names. These selections are sent to the analysismodule. The user interface module also displays all diagnostic or error messages that it receives from theanalysis module. The analysis module is BALFIT’s data processing and compute engine. It processes theinput files, performs the data analysis as specified by the selected analysis settings, and creates output filesthat contain the results of the analysis. One of the output files, i.e., the analysis report, is prepared inPostScript format. It may be converted to the more convenient Portable Document Format (PDF) using aPostScript–To–PDF converter like GhostScript or Adobe Acrobat Distiller.BALFIT supports two regression analysis types: (i) classical regression analysis and (ii) strain–gagebalance data analysis. The first analysis type allows the user to solve regression analysis problems of generalmultivariate experimental data sets. The second analysis type performs the regression analysis of windtunnel strain–gage balance calibration data by applying an iterative technique that is used in the aerospacetesting community. Three software application modes are supported if classical regression analysis is chosen(see Fig. 3a). Seven software application modes are supported if strain–gage balance data analysis is chosen(see Fig.3b). Each software application mode uses different analysis settings that influence the final resultof the data analysis task. A combination of default assignments of these analysis settings was selected suchthat a good analysis result for most experimental data sets can be obtained. – In the next two sections ofthe paper key elements of both the TUI and the GUI are discussed in greater detail.III. Text User Interface (TUI)The basic layout of BALFIT’s TUI goes back to 2004 when the development of BALFIT first started.The TUI is the prototype of BALFIT’s user interface. It is primarily used (i) to develop features of theanalysis module and (ii) to test different combinations of analysis settings that influence the outcome ofthe data analysis. The TUI uses simple sequential logic. Therefore, it can easily be modified if changesin the analysis module cause changes in the user interface. All user interaction with the TUI is done in a“question–and–answer” like fashion. First, a selection (an input or output file name or an analysis setting)is made. Then, the user is asked to confirm the selection. These steps have to be repeated for every inputthat is needed for a selected software application mode.Many combinations of analysis settings for each software application mode were tested using the TUI inorder to find specific combinations of default settings for the user interface that will lead to a good analysisresult for each analysis task. This “expert” knowledge is hidden in the user interface’s combination of defaultanalysis settings. It makes it easier for an inexperienced user to produce good analysis results without gettinglost in the large number of possible setting combinations. The default choice for a specific analysis settingis the first option that is presented to the user in the user interface.A single software application mode has been chosen to illustrate the layout of both the TUI and theGUI screen. It is the “Data Reduction Matrix Calculation” mode that is needed for the regression analysisof strain–gage balance data (see also Fig. 3b). Figure 4 shows the typical layout of the TUI screen forthis example. In the TUI every input file name, analysis setting, and output file name must be selected insequential order. Hidden connections between different analysis settings and the contents of certain inputfiles may exist. The TUI’s logic takes these connections into account and will only request input for thoseanalysis settings that have not yet implicitly been assigned. This feature prevents the user from accidentlyselecting incompatible analysis settings that may lead to confusing analysis results.IV. Graphical User Interface (GUI)The official release of BALFIT has a GUI that is more efficient to use and has lower runtime environment3American Institute of Aeronautics and Astronautics
costs than the TUI. As an example, Fig. 5a shows the overall layout of the GUI for the software applicationmode that was used for the discussion of the TUI (see also Fig. 4). Several design patterns were used inthe GUI in order to improve its usability. A total of six so–called “interaction design patterns” were appliedduring the development of the GUI (see Refs. [8], and [9] for a detailed description of these patterns). Theycan be described as follows:Sovereign Posture – The GUI is setup such that BALFIT dominates the screen. It occupies the user’sfull attention and allows all controls for a task to be seen at once.Stack of Working Surfaces – Analysis tasks for each regression analysis type are arranged as a set oftabbed pages. This approach makes every task easily visible and gives each task space for its controls.Status Display – A panel is shared by all tasks that provides space for the application to display statusmessages.Form – All inputs, settings, and outputs for each task are arranged on a single screen, allowing the userto see every setting needed to perform the task at a glance.Small Set of Values – Every user–controlled setting has choices presented like the old–fashioned automobile radio buttons. This setup allows the user to simultaneously see all choices and select only one.Go Back to a Safe Place – This feature of BALFIT allows the user to return to a set of known analysissettings. The user does this operation using the “Reset Options” button.In contrast to the TUI, which uses a “question–and–answer” based workflow, the GUI’s workflow isdesigned to be much simpler. It is modeled on the familiar task of “filling out” and “submitting” a form.The user merely selects an analysis task by clicking on the corresponding tab. This action brings the task’sform to the foreground. The form is arranged with required inputs at the top, various analysis settings inthe middle, and outputs towards the bottom. The user simply supplies inputs and values for all settings and,after completion, submits the form by clicking on the “GO” button. This action signals the analysis module(i) to perform the requested task and (ii) to display its report in another window using a helper application.During the task execution, feedback is provided from the analysis module to the GUI’s status display at thebottom of the application window.Most challenges associated with the deployment of a cross–platform application like BALFIT wereaddressed by simply selecting IDL for its development. Some operating system related problems, however,still remained to be solved. These problems were addressed by separating details of the runtime environmentdifferences from the compiled application. Then, operating system dependent parameters can simply be readfrom a Preferences File and a GUI Properties File. This basic concept is depicted in Fig. 5b. The usefulnessof this approach can easily be illustrated using a few examples:Preferences File – BALFIT produces reports in the PostScript language. These reports must be viewedusing a “helper” application. The helper application may either view the PostScript file directly (e.g., usingGhostview or GSview), or translate it to PDF. The resulting PDF file may be viewed with the Acrobat Readerapplication. Once a report is generated, BALFIT executes the helper application which displays the report.Each desktop system can potentially use different applications to perform these functions. BALFIT allowsthe helper application to be specified in the Preferences File that is read at application start. This makes itpossible to specify this detail independent of the compiled application, and allows a user to choose the helperapplication(s) based on their preference. The Preferences File is also a convenient place to store the path tothe user’s working directory, so that the application can “remember” where the user was last working andresume in this directory at startup.GUI Properties File – The GUI’s presentation is dependent on the user’s screen resolution and thefonts available. These details vary from installation to installation. BALFIT uses a GUI Properties File tohold font name and size information that allows these properties to be specified separate from the compiledapplication.In some cases, there are interactions between different analysis settings or between a single analysissetting and the contents of an input file. BALFIT automatically takes care of these dependencies in order tokeep things simple for the user. In a TUI, these interactions are easy to handle since the user interface logicis sequential and the order of setting specification is predictable. A GUI, on the other hand, is event–driven,making the order of specification impossible to predict. BALFIT’s GUI design models the dependencybetween settings explicitly using a “behaviorial design pattern” called mediator (cf. Ref. [7]). This designpattern makes it possible to clearly define relationships between settings and to enforce logic that controls4American Institute of Aeronautics and Astronautics
how the settings behave independent of the order of specification. In addition, this design pattern simplifiesmaintenance, since the interaction between settings is defined in one place and not spread throughout theapplication’s logic.Figures 6a and 6b provide an example of how BALFIT handles the dependency between two settings.The settings are called “Write Regression Coefficient Matrix to file” and “Output File, Regression CoefficientMatrix.” In Fig. 6a, the setting “Write Regression Coefficient Matrix to file” is set to “no”, meaning that aregression coefficient matrix will not be written to a file. Because of this, the widget allowing an output filename to be specified is disabled. In Fig. 6b, the user has changed the setting “Write Regression CoefficientMatrix to file” to “yes”, meaning that a regression coefficient matrix file should be written. BALFIT respondsby executing logic that makes the “Output File, Regression Coefficient Matrix” setting active, allowing thisfile name to be specified.V. Documentation of User Interface SelectionsIn regression analysis, like in any scientific analysis, it is of critical importance to record all steps andselections that were made in order to obtain the final analysis result. Only this approach makes it possible fora researcher to know how a specific analysis result was obtained if it has to be revisited at a future point intime. Therefore, all final user interface selections (input file names, output file names, and analysis settings)assigned in both the TUI and the GUI are automatically saved and reported on the analysis settings pageof BALFIT’s analysis report. The information shown on this page directly links the final analysis results toselections that were made in the user interface at the time the regression analysis was performed. Figure 7shows the contents of the analysis settings page from the analysis report file for the two user interfaceexamples that are depicted in Fig. 4 and Fig.
The authors chose the Interactive Data Language (IDL) for the development of BALFIT because of their familiarity with the language and the availability of the free “IDL Virtual Machine” which greatly simplifies the distribution of compiled code to a larger group of users