Transcription
Clinical DevelopmentSuccess Rates andContributing Factors2011–2020
About BIOBIO is the world’s largest trade association representing biotechnology companies, academic institutions, statebiotechnology centers, and related organizations across the United States and in more than 30 other nations.BIO members, from the entrepreneurial to the Fortune 500 multinationals, are involved in the research anddevelopment of innovative healthcare, agricultural, industrial, and environmental biotechnology products.BIO also produces industry-leading investor and partnering events to strengthen the innovator ecosystem.About Informa Pharma IntelligenceBiomedtracker, a subscription-based product of Informa Pharma Intelligence, tracks the clinical developmentand regulatory history of investigational drugs to assess their Likelihood of Approval (LOA) by the FDA.Biomedtracker is populated in near real-time with updated information from press releases, corporateearnings calls, investor and medical meetings, and numerous other sources. These data can be visualized,analyzed, and interpreted in the specifically designed R&D benchmarking tool Pharmapremia. This providesan exclusive window into drug development pipelines and paints a fuller, clearer picture of how the industryis performing. For more information visit www.pharmaintelligence.informa.com.About QLS AdvisorsQLS Advisors LLC is a technology and advisory company based in Cambridge, MA, dedicated to fosteringinnovation in the life sciences. QLS employs a unique blend of fundamental and quantitative tools to helpclients manage risk, assess reward, and develop investment and financing strategies for portfolios ofhealthcare-related assets. For more information visit www.qlsadvisors.com.2/ February 2021 BIO QLS Advisors Informa UK Ltd 2021 (Unauthorized photocopying prohibited.)
Executive SummaryThis is both an updated study of clinical drug development success rates from our 2016 report, and anexpansion into the drivers of success with the addition of machine learning modeling to analyze the predictivefactors contributing to drug development. A total of 12,728 clinical and regulatory phase transitions wererecorded and analyzed from 9,704 development programs over the last decade (2011–2020), across 1,779companies in the Biomedtracker database. Phase transitions occur when a drug candidate advances intothe next phase of development or is suspended by the sponsor. By calculating the number of programsprogressing to the next phase vs the total number progressing and suspended, we assessed the success rateat each of the four phases of development: Phase I, II, III, and regulatory filing. Having phase-by-phase datain hand, we then compared groups of diseases, drug modalities, and other attributes to generate the mostcomprehensive analysis yet of biopharmaceutical R&D success.This work was made possible due to the years of clinical program monitoring and data entry by InformaPharma Intelligence’s Biomedtracker, which subsequently populates the purpose-built Probability ofTechnical Success (PTS) tool, Pharmapremia. BIO has long worked with Biomedtracker to calculate successrates based on this data. More recently, BIO and Biomedtracker teamed up with QLS Advisors, a team ofexpert data scientists who apply machine learning (ML) and artificial intelligence (AI) to clinical trials dataand drug properties to assess the features that contribute the most amount, positively or negatively, to theprobability of approval. The computational analyses of over 200 different drug, trial, indication, and sponsormetrics that influence clinical success rates were applied in a predictive capacity to produce risk assessmentsand evaluations of R&D assets with increased accuracy.Key Takeaways The overall likelihood of approval (LOA) from Phase I for all developmental candidates over 2011–2020 was7.9%. Phase II development remains the largest hurdle in drug development, with just 28.9% of candidatesachieving this critical phase transition. Of the 14 major disease areas, Hematology therapies had the highest LOA from Phase I (23.9%), representinga seven-fold increase over the least successful group, Urology (3.6%). Immuno-oncology therapies provide a rare pocket of success in oncology R&D with an overall LOA of 12.4%vs 5.3% for all oncology approaches. Rare disease therapies were notably successful with an overall LOA of 17.0%. Chronic, high prevalence disease therapies were less successful with an overall LOA of 5.9%. Biological complexity in drug modalities generally leads to higher LOA, with CAR-T and RNA interferenceachieving the highest LOAs of 17.3% and 13.5%, respectively. Development programs with trials employing patient preselection biomarkers have two-fold higher LOAs(15.9%), driven by a Phase II success rate of nearly one-in-two. The top contributing factors toward phase success are disease indication, target, modality, and drugnovelty. On average, it takes 10.5 years for a Phase I asset to progress to regulatory approval. Disease areas withabove-average LOAs tend to have the shortest development timelines.3/ February 2021 BIO QLS Advisors Informa UK Ltd 2021 (Unauthorized photocopying prohibited.)
ContentsAbout BIO 2About Informa Pharma Intelligence 2About QLS Advisors 2Executive Summary3Introduction 5Part 1. Phase Transition Success and Likelihood of Approvals 6Phase Transition Success – By Disease Area 7Phase I Transition Success Rates 7Phase II Transition Success Rates 7Phase III Transition Success Rates 8NDA/BLA Submission Success Rates 9Likelihood of Approval (LOA) – By Disease Area 9Oncology and Non-Oncology Diseases 11Rare and Chronic High Prevalence Diseases 13Drug Classes and Modalities 15Patient Preselection Biomarkers 17Part 2. Predictive Analysis of Clinical Success 19Part 3. Drug Development Timelines 24Discussion 26Comparison with previous reports on attrition rates26Oncology: largest segment of industry, modest success rates27Challenges for Phase II proof-of-concept drive overall performance27Characteristics of rare disease R&D not found in highly prevalent chronic disease27Complexity of modality correlates with higher LOA28Increasing duration in clinical development typically carries elevated risk29Methods 30Appendix 33Contributing Authors 34 Informa UK Ltd 2021 (Unauthorized photocopying prohibited.)
IntroductionThis study aimed to measure clinical development success rates, contributing factors to those outcomes, andtimelines of clinical trials. With the goal of providing current benchmarking metrics for drug development,this study covers the most recent decade of individual drug program phase transitions from January 1,2011, to November 30, 2020. A phase transition is defined as the movement out of a clinical phase – forexample, advancing from Phase I to Phase II development, or being suspended after completion of Phase Idevelopment.Three separate analyses were conducted. Part 1 of this report includes clinical development success ratesbased on 12,728 transitions in the Biomedtracker database. These transitions occurred in 9,704 clinical drugdevelopment programs over the last decade. Within this broad set of data, we segmented and analyzedsuccess in drug development across levels of novelty, molecular modalities, and disease indications. As thisstudy cuts across 1,779 companies, roughly the entire spectrum of biopharma companies was included. Thisis illustrated with 15 companies each contributing more than 100 transitions, while 748 smaller biotechscontributed just one transition each. Only company-sponsored, FDA registration-enabling developmentprograms were included in this analysis. Investigator-sponsored studies and combinations with otherinvestigational drugs were excluded. A more detailed description of the data collection, composition, andanalysis methodologies is provided in the “Methods” section.The second analysis applies big data analytics to uncover the underlying drivers of drug developmentsuccess. Despite the successful application of machine learning techniques to libraries of billions of chemicaland biological compounds in order to identify potential drug candidates, most drug developers and financialanalysts still rely on historical observation to derive estimates of the clinical trial success rate when analyzingpipelines of investigational drugs. QLS Advisors, a technology and advisory company dedicated to fosteringinnovation in the life sciences, applies machine-learning techniques to predict the outcomes of randomizedclinical trials. In Part 2 of this report, QLS Advisors explores how investors in the biopharma industry can usemachine learning to characterize the probability of success for regulatory approval of a novel therapy.An analysis of clinical timelines is included in Part 3. Here we measure the time it takes for drug developmentprograms at each clinical phase to transition upon success to the next phase.5/ February 2021 BIO QLS Advisors Informa UK Ltd 2021 (Unauthorized photocopying prohibited.)
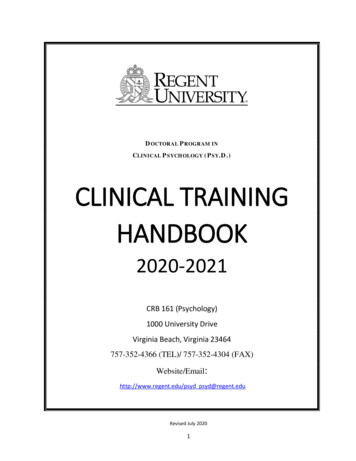
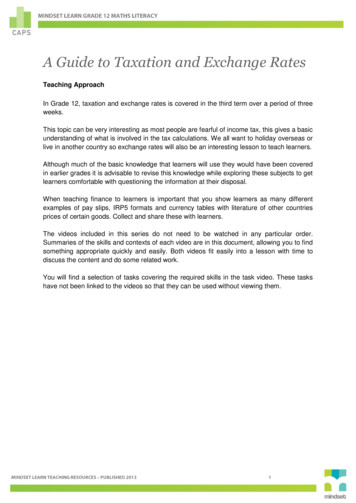
Part 1. Phase Transition Success and Likelihood of ApprovalsSuccess rates for individual phases of the drug development process were determined by dividing thenumber that successfully advanced to the next phase by the total number advanced and suspended. This“advanced and suspended” number is often referred to as “n” in this report and should be taken into accountwhen drawing conclusions from the success rate results.Consistent with previous studies of drug development phase transition success rates, we found Phase IIsuccess rates to be far lower than any other phase.1,2 Phase I and III rates were substantially higher thanPhase II, with Phase I slightly lower than Phase III. The highest success rate of the four development phaseswas the New Drug Application (NDA)/ Biologic License Application (BLA) filing phase (Figure 1).The Phase I transition success rate was 52.0% (n 4,414). As this phase is typically conducted for safety testingand is not dependent on efficacy for candidates to advance, it is common for this phase to have a highersuccess rate among the clinical phases across most categories analyzed in this report. However, Phase Isuccess rates also may benefit from delayed reporting or omission bias, as some larger companies may notdeem failed Phase I programs as material and thereby not report them in the public domain.The Phase II transition success rate (28.9%, n 4,933) was substantially lower than Phase I, and the lowestof the four phases studied. As this is generally the first stage where proof-of-concept is deliberately testedin human subjects, Phase II consistently has the lowest success rate of all phases. This is also the pointin development where industry must decide whether to pursue large, expensive Phase III studies, or toterminate development – this may be done for multiple reasons, including commercial viability. The secondhighest phase transition success rate was found in Phase III (57.8%, n 1,928). This is significant as mostcompany-sponsored Phase III trials are the longest and most expensive trials to conduct.The probability of FDA approval after submitting an NDA or BLA, taking into account re-submissions, was90.6% (n 1,453).Overall phase transition success ratesProbability of SuccessProbability of 52.0%28.9%Phase I to IIPhase II to IIIPhase III toNDA/BLANDA/BLA toApprovalFigure 1: Phase transition success rates from Phase I for all diseases, all modalities. Source: Biomedtracker and Pharmapremia , 2020.Hay M, Thomas D, Craighead JL, Economides C, Rosenthal J (2014). Clinical development success rates for investigational drugs.Nature Biotechnology, 32(1), 40–51. doi: 10.1038/nbt.27862Thomas D, Burns J, Audette J, Carroll A, Dow-Hygelund C, Hay M (2016) Clinical Development Success Rates 2006-2015. Available here [Accessed 15 January 2021].16/ February 2021 BIO QLS Advisors Informa UK Ltd 2021 (Unauthorized photocopying prohibited.)
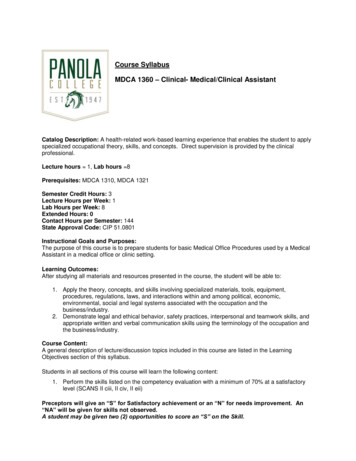
Phase Transition Success – By Disease AreaMajor disease areas were segmented according to the convention used by Biomedtracker and categorizedinto 21 major diseases and 623 indications for the 2011–2020 timeframe. For reporting at the diseasearea level, in Figure 2 we analyzed 14 major groupings: Allergy, Autoimmune, Cardiovascular, Endocrine,Gastroenterology (non-IBD), Hematology, Infectious disease, Metabolic, Neurology, Oncology, Ophthalmology,Psychiatry, Respiratory, and Urology. The remaining disease areas were placed into the “Other” category. Thisincludes Dermatology, Renal, Obstetrics, Rheumatology (for non-autoimmune indications), ENT/Dental, andOrthopedics. Beneath these major disease areas are 573 indications, which will be analyzed and discussedin subsequent reports.Phase transition success rates by disease areaPhase SuccessHematologyMetabolicInfectious nterologyAll OncologyCardiovascularUrologyPhase Ito %55.9%52.7%43.3%47.7%48.8%50.0%40.9%Phase IIto 8.9%21.9%26.8%26.6%26.8%24.6%21.0%15.0%Phase IIIto %64.5%56.3%66.2%53.1%47.7%55.2%69.2%NDA/BLAto 6%95.6%91.2%86.3%86.7%92.0%82.5%84.6%Figure 2: Phase transition success rates by disease area. The n value is the total ‘Advanced or Suspended’ transitions of all phases used to calculate LOA. ‘POS’ isthe probability of successfully advancing to the next phase. The ordering of disease areas is consistent with the overall likelihood of approval from Phase I, which isanalyzed later in Figure 5. Source: Biomedtracker and Pharmapremia , 2020Phase I Transition Success RatesSuccess rates by disease area for Phase I ranged from 40.9% to 71.6%, with the average for all diseaseindications coming in at 52.0%. Ophthalmology and Hematology were both well above the average rate,achieving respective successful Phase I transitions of 71.6% (n 88) and 69.6% (n 92). With the exception ofthese two major disease areas, the remainder were all within a reasonable distance from the mean.Phase II Transition Success RatesIn every disease area, Phase II had the lowest transition success rate of the four phases. As shown in Figure7/ February 2021 BIO QLS Advisors Informa UK Ltd 2021 (Unauthorized photocopying prohibited.)
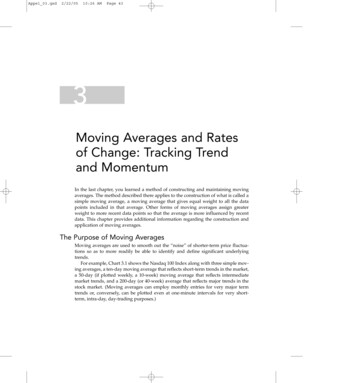
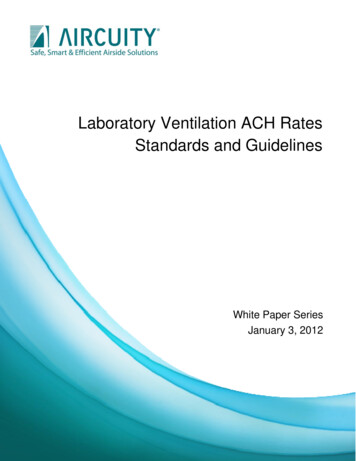
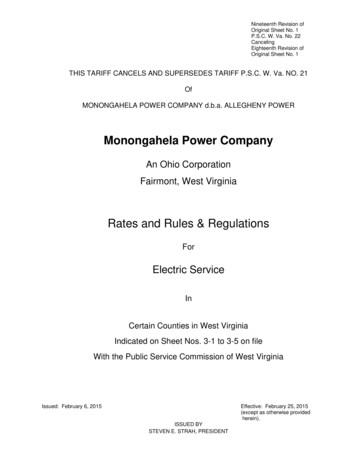
3, Phase II success rates ranged from a high of 48.1% (Hematology, n 106) to a low of 15.0% (Urology, n 40).This 33% range of disparity between major disease areas at the Phase II transition is the major contributor tothe observed divergences in overall likelihood of approval (LOA), as discussed in the next section. With onlyHematology and Metabolic (45.0%) coming close to achieving a one-in-two success rate, these two diseaseareas are also the leaders when calculating the overall LOA from Phase I, as shown later in Figure 5.Similar to Phase I transition success, the lowest-performing disease groups were Urology, Cardiovascular(21.0%), and Oncology (24.6%). Relative to its placement for Phase I success rate, the Gastroenterologycategory performed better in Phase II (34.2%), above the average for all indications.Phase II transition success rates by disease areaProbability of Phase II ectious %Autoimmune31.4%All %Probability of SuccessFigure 3: Phase II transition success rates by disease area. Source: Biomedtracker and Pharmapremia , 2020Phase III Transition Success RatesFor Phase III transition success rates, Oncology had the lowest transition success rate (47.5%, n 495). Asseen in Figure 4, the Phase III success rates for the remaining 13 specific disease areas were each above 50%.Five other disease groups besides Oncology ranked below the average Phase III transition success rateof 57.8%, including Ophthalmology (51.2%, n 82) which in the earlier phases performed better than theaverage across all diseases. Conversely, Urology, which had the lowest transition rates in Phase I and II,had the second-highest Phase III success rate behind Hematology at 69.2%, albeit with a very low n of 13transitions. All of the disease groups with below-average Phase III success rates had disease indications withlarge patient populations. Later in this report, we will analyze these high prevalence diseases and comparetheir success rates to those of therapies for rare diseases.8/ February 2021 BIO QLS Advisors Informa UK Ltd 2021 (Unauthorized photocopying prohibited.)
Phase III transition success rates by disease areaProbability of Phase III s disease64.0%Metabolic63.6%Others60.0%All bility of SuccessFigure 4: Phase III transition success rates by disease area. Source: Biomedtracker and Pharmapremia , 2020NDA/BLA Submission Success RatesNDA/BLA transition success rates (approval rates) for the major disease areas ranged from the low end of82.5% (Cardiovascular) to a high of 100.0% (Allergy). This distribution had the tightest range among the fourphases analyzed in this report. These rates are the result of eventual success, not success on the first review.In some cases, programs have more than two Complete Response Letters (CRLs) and attempts at approval.This unlimited allowance of submission attempts pushes the overall success above 90.6% across all diseases,with only 137 drugs suspended by their sponsors at the regulatory transition over 2011–2020 (thus, 1,316approved).Among the clinical development programs analyzed, there was an approximately even split of innovativedrugs and non-originator products that were successful in obtaining regulatory approval. These included740 innovative drug programs (435 new molecular entities (NMEs), 278 new biologics, and 27 vaccines) and576 non-originator products (453 non-NMEs and 123 biosimilars). There is a more detailed discussion aboutsuccess rates by for drug modality and classification later in the report.Likelihood of Approval (LOA) – By Disease AreaOne of the key measures of success used in this report is the LOA from Phase I. The LOA success rate issimply a multiplication of success rates from all four phases, a compounded probability calculation. Forexample, if each phase had a 50% chance of success, then the LOA from Phase I would be 0.5 x 0.5 x 0.5 x0.5 6.25%.9/ February 2021 BIO QLS Advisors Informa UK Ltd 2021 (Unauthorized photocopying prohibited.)
Multiplying the individual phase probabilities across all disease areas (found in Figure 1), the compoundedprobability of progressing from Phase I to U.S. FDA approval reveals that only 7.9% of drug developmentprograms (n 12,728) successfully make it to market.As can be seen in Figure 5, there is a wide range of LOAs from Phase I. At the high end, Hematology towersover the other disease groups at 23.9% (n 352). Hematology therapies had an LOA from Phase I seven timeshigher than Urology therapies, which had the lowest Phase I LOA of all the major disease areas (3.6%, n 88).After Hematology, the next highest LOA from Phase I was Metabolic with 15.5% (n 399). Five other diseaseareas were above the overall average of 7.9% (Infectious Disease Ophthalmology Autoimmune Allergy Gastroenterology) which ranged from 13.2% down to 8.3%. Falling under the overall LOA of 7.9%, but veryclose, were Respiratory (7.5%) and Psychiatry (7.3%). Therapies for five disease categories were well belowthe average (Endocrine Neurology Oncology Cardiovascular Urology). The fact that Oncology andNeurology have the two largest n values, while also having low LOA values, indicates that these two diseasecategories are significant contributors in bringing down the overall industry LOA.Overall likelihood of approval by disease areaLikelihood of Approval from Phase IHematologyMetabolicInfectious nterologyAll 0%5%10%15%20%25%30%Probability of SuccessFigure 5a: Chart of LOA from Phase I, displayed highest to lowest by disease area. Source: Biomedtracker and Pharmapremia , 202010/ February 2021 BIO QLS Advisors Informa UK Ltd 2021 (Unauthorized photocopying prohibited.)
Likelihood ofApprovalPhase Ito ApprovalPhase IIto ApprovalPhase IIIto ApprovalNDA/BLAto abolic39915.5%26325.0%11455.7%4887.5%Infectious l 883.6%668.8%2658.6%1384.6%Figure 5b: Table likelihood of approval by disease area with corresponding n values. The n value is the total ‘Advanced or Suspended’ transitions of all phases usedto calculate LOA. ‘Phase LOA’ is the probability of FDA approval for drugs from this phase of development. Source: Biomedtracker and Pharmapremia , 2020Oncology and Non-Oncology DiseasesOncology drug development program transitions in the 2011–2020 period accounted for 33% of the 12,728total transitions. With the third-lowest LOA from Phase I (5.3%, n 4,179), Oncology had an outsized effecton the overall industry success rate. To further understand this contribution, we compared phase transitionsuccess rates and LOA for non-oncology development programs against oncology development programs(Figure 6).The LOA from Phase I across non-oncology indications, 9.3% (n 8,549), was nearly twice that for Oncologyalone, at 5.3% (n 4,179). Comparing individual phase transition success rates in Figure 2, Oncology consistentlyhad one of the lowest success rates compared to the other 14 disease categories for every developmentalclinical transition. In particular, there were relative differentials of approximately 20% between Oncology andnon-oncology groupings at the Phase II and III stages. One notable exception was the NDA/BLA to approvalsuccess rate. Oncology performed slightly better than non-oncology at the regulatory transition betweenNDA/BLA and approval, with a 92.0% (n 324) success rate, as opposed to 90.2% (n 1,129).11/ February 2021 BIO QLS Advisors Informa UK Ltd 2021 (Unauthorized photocopying prohibited.)
Oncology vs. non-oncology phase transition success rates and LOAProbability of SuccessProbability of Success: Oncology vs. Others100%90%80%70%60%50%40%30%20%10%0%92.0% 90.2%48.8%61.3%53.9%47.7%31.2%24.6%9.3%5.3%Phase I to IIPhase II to IIIOncologyPhase SuccessPhase I to S nPhase III toNDA/BLANDA/BLA toApprovalPhase I toApprovalNon-oncology1732PhasePOS24.6%Phase III toNDA/BLAPhasePOS nPOS49547.7%NDA/BLA toApprovalPhasePOS nPOS32492.0%320131.2%14331129Phase II to IIIPOS n61.3%90.2%OncologyPhase I toApprovalPhaseLOA nLOA41795.3%Phase II toApprovalPhaseLOA nLOA255110.8%Phase III toApprovalPhaseLOA nLOA81943.9%NDA/BLA toApprovalPhaseLOA nLOA32492.0%Non-oncology8549576325621129Likelihood ofApproval9.3%17.2%55.3%90.2%Figure 6: Oncology vs non-oncology phase transition success rates and LOA. Top: Chart of phase transition success rates and LOA from Phase I for Oncology vs nonOncology. Bottom: Table of phase transition success and likelihood of approval by Oncology vs non-Oncology with corresponding n values. The n value is the total‘Advanced or Suspended’ transitions of all phases used to calculate LOA. ‘POS’ is the probability of successfully advancing to the next phase, whereas ‘Phase LOA’ isthe probability of FDA approval for drugs from this phase of development. Source: Biomedtracker and Pharmapremia , 2020Oncology drugs were further categorized into two main types of cancer: solid tumors and hematologiccancers. Drugs for solid tumors had more than twice as many transitions in the data set (2,982 vs 1,094), buta much smaller LOA from Phase I vs hematological cancers (4.6% vs 7.5%).The 2011–2020 time period witnessed the rise of drugs that harness the immune system to treat theunderlying cancer, spanning both solid and hematologic types. The first successful immuno-oncology (IO)drugs spawned intense growth in this field over a short period of time, with 679 total phase transitionsincluded in the Biomedtracker database. The success rates of IO drugs far exceed the traditional oncologyaverages, with a Phase I LOA of 12.4%. The notably high Phase II transition rate of 42.0% for IO drugs –contrasting 24.6% as a whole for oncology – is the main factor underpinning the overall LOA success for theIO class. These oncology groupings are shown in Figure 7.12/ February 2021 BIO QLS Advisors Informa UK Ltd 2021 (Unauthorized photocopying prohibited.)
Oncology sub-category phase transition success rates and LOAPhase I to IIPhase S nApprovalNDA/BLA toApprovalPhasePOS 21292.9%64.0%24440.2%9849.0%6298.4%POS nPhase I toApprovalLikelihood ofPhase III toNDA/BLAPhasePOS nPOS12060.0%Phase II to IIIPhase II toApprovalPhase III toApprovalNDA/BLA toApprovalLOA nPhaseLOALOA nPhaseLOALOA nPhaseLOALOA 0419.4%16048.2%6298.4%Figure 7: Oncology sub-category phase transition success rates and LOA. The n value is the total ‘Advanced or Suspended’ transitions of all phases used to calculateLOA. ‘POS’ is the probability of successfully advancing to the next phase, whereas ‘Phase LOA’ is the probability of FDA approval for drugs from this phase ofdevelopment. Note: Hematologic and solid tumor types are mutually exclusive categories, while the IO drug class includes transitions from across both categories.IO drugs for solid tumors had 3x the transitions as IO hematological cancers but have similar success rates. Source: Biomedtracker and Pharmapremia , 2020Rare and Chronic High Prevalence DiseasesWithin the Biomedtracker database, rare diseases can be identified based on meeting either or both of thefollowing standard criteria: affecting fewer than 200,000 people in the US, or prevalence of 1 in 2,000 peoplein the EU. As 43% of the Oncology transitions are for rare indications, all Oncology indications were removedto make this rare disease analysis more concentrated on inborn genetic disorders. For chronic diseases, wefirst obtained a list of conditions from the CMS Chronic Conditions Data Warehouse (CCW). We removed anycancer indications, then identified those diseases with greater than 1 million patients affected in the UnitedStates.Rare disease vs. highly prevalent chronic disease success ratesProbability of SuccessProbability of Success: Rare vs Chronic Diseases93.6% 92.6% 90.6%100%80%60%60.4% %0%Phase I to IIRare diseasesPhase II to IIIPhase III toNDA/BLANDA/BLA toApprovalChronic, high prevalence diseases5.9%7.9%Phase I toApprovalAll indicationsFigure 8a: Non-oncology rare disease and highly prevalent chronic disease phase transition success rates and LOA.Chart of phase transition success rates and LOA from Phase I. Source: Biomedtracker and Pharmapremia , 202013/ February 2021 BIO QLS Advisors Informa UK Ltd 2021 (Unauthorized photocopying prohibited.)
Phase SuccessRare diseasesChronic, highprevalence diseasesAll diseasesLikelihood ofApprovalRare diseasesChronic, highprevalence diseasesAll diseasesPhase I to II380PhasePOS67.4%7454414POS nPhase II to IIIPhase III toNDA/BLAPhasePOS nPOS24060.4%NDA/BLA toApprovalPhasePOS 1792.6%52.0%493328.9%192857.8%145390.6%POS nPhase I toApprovalPhaseLOA nLOA125617.0%Phase II toApprovalPhaseLOA nLOA87625.2%Phase III toApprovalPhaseLOA nLOA41256.6%NDA/BLA toApprovalPhaseLOA 7.9%831415.1%338152.4%145390.6%Figure 8b: Non-oncology rare disease and highly prevalent chronic disease phase transition success rates and LOA. Table of phase transition success and likelihoodof approval by disease prevalence with corresponding n values. The n value is the total ‘Advanced or Suspended’ transitions of all phases used to calculate LOA.‘POS’ is the probability of successfully advancing to the next phase, whereas ‘Phase LOA’ is the probability of FDA approval for drugs from this phase of development.Source: Biomedtracker and Pharmapremia , 2020After identifying programs for non-oncology rare diseases and highly prevalent chronic diseases, wecompared their phase transition success rates an
expansion into the drivers of success with the addition of machine learning modeling to analyze the predictive factors contributing to drug development. A total of 12,728 clinical and regulatory phase transitions were recorded and analyzed from 9,704 developmen