Transcription
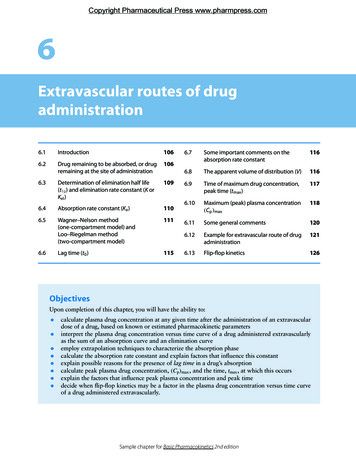
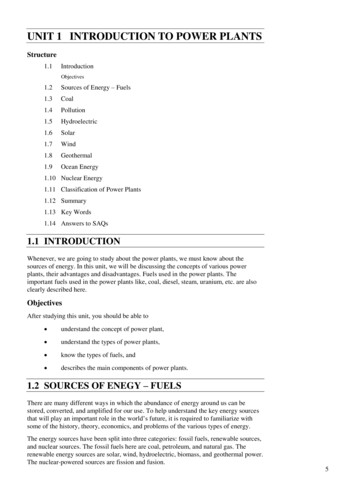
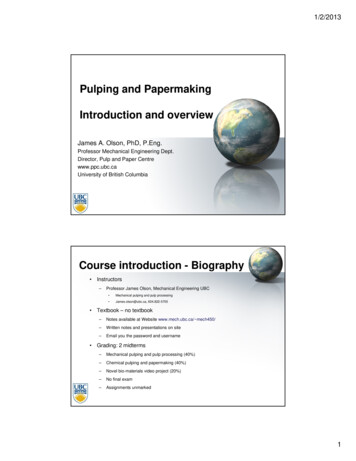
LESSON1Introduction to Pharmacokineticsand PharmacodynamicsCOBJECTIVESAfter completing Lesson 1, you should be able to:1. Define and differentiate between pharmacokineticsand clinical pharmacokinetics.2. Define pharmacodynamics and relate it to pharmacokinetics.3. Describe the concept of the therapeutic concentration range.4. Identify factors that cause interpatient variability indrug disposition and drug response.Pharmacokinetics is currently defined as the study of thetime course of drug absorption, distribution, metabolism, and excretion. Clinical pharmacokinetics is theapplication of pharmacokinetic principles to the safeand effective therapeutic management of drugs in anindividual patient.Primary goals of clinical pharmacokinetics includeenhancing efficacy and decreasing toxicity of a patient’sdrug therapy. The development of strong correlationsbetween drug concentrations and their pharmacologicresponses has enabled clinicians to apply pharmacokinetic principles to actual patient situations.A drug’s effect is often related to its concentration atthe site of action, so it would be useful to monitor thisconcentration. Receptor sites of drugs are generally inaccessible to our observations or are widely distributed inthe body, and therefore direct measurement of drug concentrations at these sites is not practical. For example, the5. Describe situations in which routine clinical pharmacokinetic monitoring would be advantageous.6. List the assumptions made about drug distributionpatterns in both one- and two-compartment models.7. Represent graphically the typical natural log ofplasma drug concentration versus time curve for aone-compartment model after an intravenousdose.receptor sites for digoxin are thought to be within themyocardium. Obviously we cannot directly sample drugconcentration in this tissue. However, we can measuredrug concentration in the blood or plasma, urine, saliva,and other easily sampled fluids (Figure 1-1). Kinetichomogeneity describes the predictable relationshipbetween plasma drug concentration and concentration atthe receptor site where a given drug produces its therapeutic effect (Figure 1-2). Changes in the plasma drugconcentration reflect changes in drug concentrations atthe receptor site, as well as in other tissues. As the concentration of drug in plasma increases, the concentrationof drug in most tissues will increase proportionally.Similarly, if the plasma concentration of a drug isdecreasing, the concentration in tissues will alsodecrease. Figure 1-3 is a simplified plot of the drug concentration versus time profile after an intravenous drugdose and illustrates this concept.1
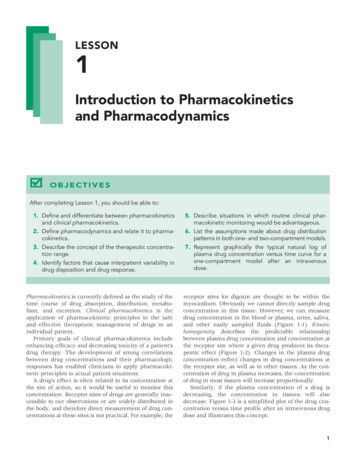
2Concepts in Clinical PharmacokineticsFIGURE 1-3.Drug concentration versus time.FIGURE 1-1.Blood is the fluid most often sampled for drug concentrationdetermination.The property of kinetic homogeneity is importantfor the assumptions made in clinical pharmacokinetics. It is the foundation on which all therapeutic andtoxic plasma drug concentrations are established. Thatis, when studying concentrations of a drug in plasma,we assume that these plasma concentrations directlyrelate to concentrations in tissues where the diseaseprocess is to be modified by the drug (e.g., the centralnervous system in Parkinson’s disease or bone inosteomyelitis). This assumption, however, may not betrue for all drugs. CLINICAL CORRELATEDrugs concentrate in some tissues because of physical or chemical properties. Examples include digoxin,which concentrates in the myocardium, and lipidsoluble drugs, such as benzodiazepines, which concentrate in fat.BASIC PHARMACODYNAMIC CONCEPTSPharmacodynamics refers to the relationship betweendrug concentration at the site of action and the resultingeffect, including the time course and intensity of therapeutic and adverse effects. The effect of a drug presentat the site of action is determined by that drug’s bindingwith a receptor. Receptors may be present on neurons inthe central nervous system (i.e., opiate receptors) todepress pain sensation, on cardiac muscle to affect theintensity of contraction, or even within bacteria to disrupt maintenance of the bacterial cell wall.For most drugs, the concentration at the site of thereceptor determines the intensity of a drug’s effect (Figure 1-4). However, other factors affect drug response aswell. Density of receptors on the cell surface, the mechanism by which a signal is transmitted into the cell bysecond messengers (substances within the cell), or regulatory factors that control gene translation and proteinproduction may influence drug effect. This multilevelFIGURE 1-4.FIGURE 1-2.Relationship of plasma to tissue drug concentrations.Relationship of drug concentration to drug effect at the receptor site.
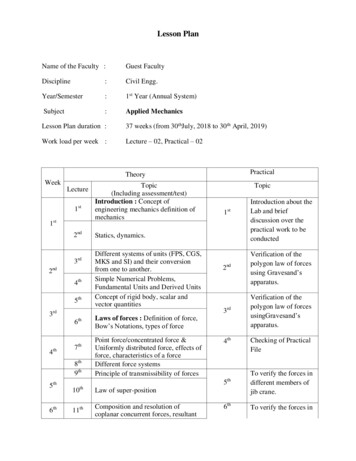
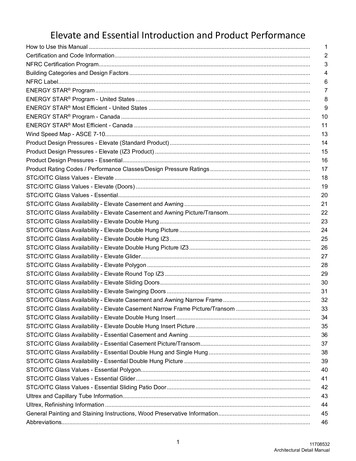
Lesson 1: Introduction to Pharmacokinetics and Pharmacodynamics3FIGURE 1-6.Demonstration of tolerance to drug effect with repeated dosing.FIGURE 1-5.Relationship of drug concentration at the receptor site toeffect (as a percentage of maximal effect).regulation results in variation of sensitivity to drugeffect from one individual to another and also determines enhancement of or tolerance to drug effects.In the simplest examples of drug effect, there is a relationship between the concentration of drug at the receptorsite and the pharmacologic effect. If enough concentrations are tested, a maximum effect (Emax) can be determined (Figure 1-5). When the logarithm of concentrationis plotted versus effect (Figure 1-5), one can see that thereis a concentration below which no effect is observed and aconcentration above which no greater effect is achieved.One way of comparing drug potency is by the concentration at which 50% of the maximum effect is achieved.This is referred to as the 50% effective concentration or EC50.When two drugs are tested in the same individual, thedrug with a lower EC50 would be considered more potent.This means that a lesser amount of a more potent drug isneeded to achieve the same effect as a less potent drug.The EC50 does not, however, indicate other importantdeterminants of drug response, such as the duration ofeffect. Duration of effect is determined by a complex setof factors, including the time that a drug is engaged onthe receptor as well as intracellular signaling and generegulation.For some drugs, the effectiveness can decrease withcontinued use. This is referred to as tolerance. Tolerancemay be caused by pharmacokinetic factors, such asincreased drug metabolism, that decrease the concentrations achieved with a given dose. There can also bepharmacodynamic tolerance, which occurs when thesame concentration at the receptor site results in areduced effect with repeated exposure. An example ofdrug tolerance is the use of opiates in the managementof chronic pain. It is not uncommon to find thesepatients requiring increased doses of the opiate overtime. Tolerance can be described in terms of the dose–response curve, as shown in Figure 1-6.To assess the effect that a drug regimen is likely tohave, the clinician should consider pharmacokineticand pharmacodynamic factors. Both are important indetermining a drug’s effect. CLINICAL CORRELATETolerance can occur with many commonly used drugs.One example is the hemodynamic tolerance that occurswith continued use of organic nitrates, such as nitroglycerin. For this drug, tolerance can be reversed by interspersing drug-free intervals with chronic drug use. CLINICAL CORRELATEOne way to compare potency of two drugs that are inthe same pharmacologic class is to compare EC50. Thedrug with a lower EC50 is considered more potent.
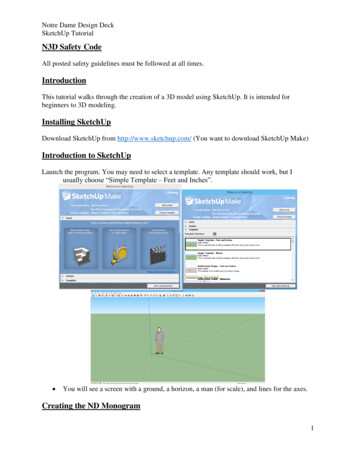
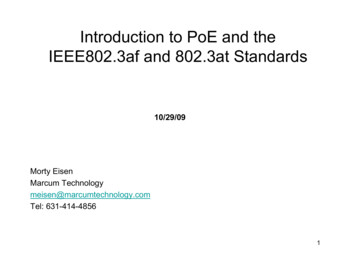
4Concepts in Clinical PharmacokineticsFIGURE 1-8.FIGURE 1-7.Relationship between drug concentration and drug effects fora hypothetical drug. Source: Adapted with permission fromEvans WE, editor. General principles of applied pharmacokinetics. In: Applied Pharmacokinetics, 3rd ed. Vancouver, WA:Applied Therapeutics; 1992. pp.1–3.THERAPEUTIC DRUG MONITORINGTherapeutic drug monitoring is defined as the use ofassay procedures for determination of drug concentrations in plasma, and the interpretation and applicationof the resulting concentration data to develop safe andeffective drug regimens. If performed properly, this process allows for the achievement of therapeutic concentrations of a drug more rapidly and safely than can beattained with empiric dose changes. Together withobservations of the drug’s clinical effects, it should provide the safest approach to optimal drug therapy.The usefulness of plasma drug concentration data isbased on the concept that pharmacologic response isclosely related to drug concentration at the site of action.For certain drugs, studies in patients have provided information on the plasma concentration range that is safeand effective in treating specific diseases—the therapeutic range (Figure 1-7). Within this therapeutic range, thedesired effects of the drug are observed. Below it, there isgreater probability that the therapeutic benefits are notrealized; above it, toxic effects may occur.No absolute boundaries divide subtherapeutic, therapeutic, and toxic drug concentrations. A gray area usually exists for most drugs in which these concentrationsoverlap due to variability in individual patient response.Numerous pharmacokinetic characteristics of a drugmay result in variability in the plasma concentrationachieved with a given dose when administered to various patients (Figure 1-8). This interpatient variability isprimarily attributed to one or more of the following:Example of variability in plasma drug concentration amongsubjects given the same drug dose. Differences in an individual’s ability to metabolizeand eliminate the drug (e.g., genetics) Disease states (renal or hepatic insufficiency) orphysiologic states (e.g., extremes of age, obesity) thatalter drug absorption, distribution, or elimination Drug interactionsTherapeutic monitoring using drug concentration datais valuable when:1. A good correlation exists between the pharmacologic response and plasma concentration. Over atleast a limited concentration range, the intensity ofpharmacologic effects should increase with plasmaconcentration. This relationship allows us to predict pharmacologic effects with changing plasmadrug concentrations (Figure 1-9).2. Wide intersubject variation in plasma drug concentrations results from a given dose.FIGURE 1-9. Variations in drug absorption Variations in drug distributionWhen pharmacologic effects relate to plasma drug concentrations, the latter can be used to predict the former.
Lesson 1: Introduction to Pharmacokinetics and Pharmacodynamics3. The drug has a narrow therapeutic index (i.e., thetherapeutic concentration is close to the toxicconcentration).4. The drug’s desired pharmacologic effects cannot beassessed readily by other simple means (e.g., bloodpressure measurement for antihypertensives).The value of therapeutic drug monitoring is limitedin situations in which:1. There is no well-defined therapeutic plasma concentration range.2. The formation of pharmacologically active metabolites of a drug complicates the application of plasmadrug concentration data to clinical effect unlessmetabolite concentrations are also considered.3. Toxic effects may occur at unexpectedly low drugconcentrations as well as at high concentrations.4. There are no significant consequences associatedwith too high or too low levels.Theophylline is an excellent example of a drug inwhich significant interpatient variability in pharmacokinetic properties exists. This is important from a clinicalstandpoint as subtle changes in serum concentrationsmay result in marked changes in drug response. Figure1-10 shows the relationship between theophylline concentration (x-axis, on a logarithmic scale) and itspharmacologic effect, (changes in pulmonary function[y-axis]). This figure illustrates that as the concentrationof theophylline increases, so does the intensity of theresponse for some patients. Wide interpatient variabilityis also shown.Figure 1-11 outlines the process clinicians maychoose to follow in making drug dosing decisions byusing therapeutic drug monitoring. Figure 1-12 showsthe relationship of pharmacokinetic and pharmacodynamic factors.Examples of therapeutic ranges for commonly useddrugs are shown in Table 1-1. As can be seen in thistable, most drug concentrations are expressed as a unitof mass per volume. CLINICAL CORRELATEA drug’s effect may also be determined by theamount of time that the drug is present at the site ofaction. An example is with beta-lactam antimicrobials.The rate of bacterial killing by beta-lactams (the bacterial cell would be considered the site of action) isusually determined by the length of time that thedrug concentration remains above the minimal concentration that inhibits bacterial growth.FIGURE 1-10.Relationship between plasma theophylline concentration andchange in forced expiratory volume (FEV) in asthmatic patients.Source: Reproduced with permission from Mitenko PA, OgilvieRI. Rational intravenous doses of theophylline. N Engl J Med1973;289:600–3. Copyright 1973, Massachusetts MedicalSociety.5FIGURE 1-11.Process for reaching dosage decisions with therapeutic drugmonitoring.
6Concepts in Clinical PharmacokineticsFIGURE 1-12.Relationship of pharmacokinetics andpharmacodynamics and factors thataffect each.PHARMACOKINETIC MODELSThe handling of a drug by the body can be very complex,as several processes (such as absorption, distribution,metabolism, and elimination) work to alter drug concentrations in tissues and fluids. Simplifications of body processes are necessary to predict a drug’s behavior in thebody. One way to make these simplifications is to applymathematical principles to the various processes.To apply mathematical principles, a model of thebody must be selected. A basic type of model used inpharmacokinetics is the compartmental model. Compartmental models are categorized by the number ofTABLE 1-1.Therapeutic Ranges for Commonly Used DrugsDrugRangeDigoxin0.5–2.0 ng/mLLidocaine1.5–5.0 mg/LLithium0.6–1.4 mEq/LPhenobarbital15–40 mg/LPhenytoin10–20 mg/LQuinidine2–5 mg/LCyclosporin150–400 ng/mLValproic acid50–100 mg/LCarbamazepine4–12 mcg/mLEthosuxamide40–100 mg/LPrimidone5–12 mg/LSource: Adapted with permission from Bauer LA. Clinical pharmacokinetics and pharmacodynamics. In: DiPiro JT, Talbert RL,Yee GC, et al., editors. Pharmacotherapy: a PathophysiologicApproach, 7th ed. New York: McGraw-Hill; 2008. p. 10.compartments needed to describe the drug’s behavior inthe body. There are one-compartment, two-compartment, and multicompartment models. The compartments do not represent a specific tissue or fluid but mayrepresent a group of similar tissues or fluids. Thesemodels can be used to predict the time course of drugconcentrations in the body (Figure 1-13).Compartmental models are termed deterministicbecause the observed drug concentrations determine thetype of compartmental model required to describe thepharmacokinetics of the drug. This concept will becomeevident when we examine one- and two-compartmentmodels.To construct a compartmental model as a representation of the body, simplifications of body structures aremade. Organs and tissues in which drug distribution issimilar are grouped into one compartment. For example,distribution into adipose tissue differs from distributioninto renal tissue for most drugs. Therefore, these tissuesmay be in different compartments. The highly perfusedorgans (e.g., heart, liver, and kidneys) often have similardrug distribution patterns, so these areas may be considered as one compartment. The compartment thatincludes blood (plasma), heart, lungs, liver, and kidneys isusually referred to as the central compartment or thehighly blood-perfused compartment (Figure 1-14). Theother compartment that includes fat tissue, muscle tissue,FIGURE 1-13.Simple compartmental model.
Lesson 1: Introduction to Pharmacokinetics and Pharmacodynamics7FIGURE 1-15.One-compartment model.FIGURE 1-14.Typical organ groups for central and peripheral compartments.and cerebrospinal fluid is the peripheral compartment,which is less well perfused than the central compartment.Another simplification of body processes concernsthe expression of changes in the amount of drug in thebody over time. These changes with time are known asrates. The elimination rate describes the change in theamount of drug in the body due to drug elimination overtime. Most pharmacokinetic models assume that elimination does not change over time.The value of any model is determined by how well itpredicts drug concentrations in fluids and tissues. Generally, it is best to use the simplest model that accuratelypredicts changes in drug concentrations over time. If aone-compartment model is sufficient to predict plasmadrug concentrations (and those concentrations are of mostinterest to us), then a more complex (two-compartment ormore) model is not needed. However, more complex models are often required to predict tissue drug concentrations. CLINICAL CORRELATEDrugs that do not extensively distribute into extravascular tissues, such as aminoglycosides, are generally welldescribed by one-compartment models. Extent of distribution is partly determined by the chemistry of theagents. Aminoglycosides are polar molecules, so theirdistribution is limited primarily to extracellular water.Drugs extensively distributed in tissue (such as lipophilicdrugs like the benzodiazepines) or that have extensiveintracellular uptake may be better described by themore complex models.ment is represented by an enclosed square or rectangle,and rates of drug transfer are represented by straightarrows (Figure 1-15). The arrow pointing into the boxsimply indicates that drug is put into that compartment.And the arrow pointing out of the box indicates thatdrug is leaving the compartment.This model is the simplest because there is only onecompartment. All body tissues and fluids are considereda part of this compartment. Furthermore, it is assumedthat after a dose of drug is administered, it distributesinstantaneously to all body areas. Common abbreviations are shown in Figure 1-15.Some drugs do not distribute instantaneously to allparts of the body, however, even after intravenousbolus administration. Intravenous bolus dosing meansadministering a dose of drug over a very short timeperiod. A common distribution pattern is for the drugto distribute rapidly in the bloodstream and to thehighly perfused organs, such as the liver and kidneys.Then, at a slower rate, the drug distributes to otherbody tissues. This pattern of drug distribution may berepresented by a two-compartment model. Drug movesback and forth between these compartments to maintain equilibrium (Figure 1-16).Figure 1-17 simplifies the difference between oneand two-compartment models. Again, the one-compartment model assumes that the drug is distributed to tissuesvery rapidly after intravenous administration.COMPARTMENTAL MODELSThe one-compartment model is the most frequentlyused model in clinical practice. In structuring themodel, a visual representation is helpful. The compart-FIGURE 1-16.Compartmental model representing transfer of drug to andfrom central and peripheral compartments.
8Concepts in Clinical PharmacokineticsFIGURE 1-17.Drug distribution in one- and two-compartmentmodels.The two-compartment model can be represented asin Figure 1-18, where:X0 dose of drugX1 amount of drug in central compartmentX2 amount of drug in peripheral compartmentK elimination rate constant of drug from centralcompartment to outside the bodyK12 elimination rate constant of drug from centralcompartment to peripheral compartmentK21 elimination rate constant of drug from peripheral compartment to central compartmentdrug in tissue and plasma, plasma concentrationsdecline less rapidly (Figure 1-19). The plasma wouldbe the central compartment, and muscle tissue wouldbe the peripheral compartment.Volume of DistributionUntil now, we have spoken of the amount of drug (X ) ina compartment. If we also consider the volume of the CLINICAL CORRELATEDigoxin, particularly when given intravenously, is anexample of a drug that is well described by twocompartment pharmacokinetics. After an intravenousdose is administered, plasma concentrations rise andthen rapidly decline as drug distributes out of plasmaand into muscle tissue. After equilibration betweenFIGURE 1-18.Two-compartment model.
Lesson 1: Introduction to Pharmacokinetics and Pharmacodynamics9TABLE 1-2.Approximate Volumes of Distributionof Commonly Used DrugsDrugVolume of Distribution (L/kg)Amlodipine16.0 4GanciclovirFIGURE 1-19.Plasma concentrations of digoxin after an intravenous dose.compartment, we can describe the concept of drug concentration. Drug concentration in the compartment isdefined as the amount of drug in a given volume, suchas mg/L: 1-1concentration amount of drug in body X volume in whichVdrug is distributedVolume of distribution (V) is an important indicator ofthe extent of drug distribution into body fluids and tissues. V relates the amount of drug in the body (X) to themeasured concentration in the plasma (C). Thus, V isthe volume required to account for all of the drug in thebody if the concentrations in all tissues are the same asthe plasma concentration:volume of distribution amount of drugconcentrationA large volume of distribution usually indicates that thedrug distributes extensively into body tissues and fluids.Conversely, a small volume of distribution often indicates limited drug distribution.Volume of distribution indicates the extent of distribution but not the tissues or fluids into which the drugdistributes. Two drugs can have the same volume of distribution, but one may distribute primarily into muscletissues, whereas the other may concentrate in adiposetissues. Approximate volumes of distribution for somecommonly used drugs are shown in Table 1-2.When V is many times the volume of the body, thedrug concentrations in some tissues should be muchgreater than those in plasma. The smallest volume inwhich a drug may distribute is the plasma volume.To illustrate the concept of volume of distribution, letus first imagine the body as a tank filled with fluid, as1.1 0.2Ketorolac0.21 0.04Lansoprazole0.35 0.05Montelukast0.15 0.02Sildenafil1.2 0.3Valsartan0.23 0.09Source: Brunton LL, Lazo JS, Parker KL (editors). The Pharmacologic Basis of Therapeutics, 11th edition. New York: McGrawHill; 2006. pp. 1798, 1829, 1839, 1840, 1851, 1872, 1883.the body is primarily composed of water. To calculatethe volume of the tank, we can place a known quantityof substance into it and then measure its concentrationin the fluid (Figure 1-20). If the amount of substance (X)and the resulting concentration (C) is known, then thevolume of distribution (V) can be calculated using thesimplified equations:X VCorC XVorV XCX amount of drug in bodyV volume of distributionC concentration in the plasmaAs with other pharmacokinetic parameters, volume ofdistribution can vary considerably from one person toanother because of differences in physiology or diseasestates. Something to note: The dose of a drug (X0) andFIGURE 1-20.The volume of a tank can be determined from the amount ofsubstance added and the resulting concentration.
10Concepts in Clinical PharmacokineticsEliminationFIGURE 1-21.Drug elimination complicates the determination of the “volume” of the body from drug concentrations.the amount of drug in the body (X) are essentially thesame thing because all of the dose goes into the body.In this example, important assumptions have beenmade: that instantaneous distribution occurs and that itoccurs equally throughout the tank. In the closed tank,there is no elimination. This example is analogous to aone-compartment model of the body after intravenousbolus administration. However, there is one complicating factor—during the entire time that the drug is in thebody, elimination is taking place. So, if we consider thebody as a tank with an open outlet valve, the concentration used to calculate the volume of the tank would beconstantly changing (Figure 1-21).We can use the relationship given in Equation 1-1 forvolume, amount of drug administered, and resultingconcentration to estimate a drug’s volume of distribution in a patient. If we give a known dose of a drug anddetermine the concentration of that drug achieved inthe plasma, we can calculate a volume of distribution.However, the concentration used for this estimationmust take into account changes resulting from drugelimination, as discussed in Lessons 3 and 9.For example:If 100 mg of drug X is administered intravenously andthe plasma concentration is determined to be 5 mg/Ljust after the dose is given, then:volume ofdistribution (V )X100 mgdose 0 20 LC5 mg/LresultingconcentrationFIGURE 1-22.One-compartment model. CLINICAL CORRELATEDrugs that have extensive distribution outside ofplasma appear to have a large volume of distribution. Examples include digoxin, diltiazem, imipramine,labetalol, metoprolol, meperidine, and nortriptyline.PLASMA DRUG CONCENTRATIONVERSUS TIME CURVESWith the one-compartment model (Figure 1-22), if wecontinuously measure the concentration of a drug in theplasma after an intravenous bolus dose and then plotthese plasma drug concentrations against the times theyare obtained, the curve shown in Figure 1-23 wouldresult. Note that this plot is a curve and that the plasmaconcentration is highest just after the dose is administered, at time zero (t0).Because of cost limitations and patient conveniencein clinical situations, only a small number of plasmasamples can usually be obtained for measuring drugconcentrations (Figure 1-24). From these known values,we are able to predict the plasma drug concentrationsfor the times when we have no samples (Figure 1-25). Inclinical situations, it is rare to collect more than twosamples after a dose. CLINICAL CORRELATEThe volume of distribution is easily approximated formany drugs. For example, if the first 80-mg dose ofgentamicin is administered intravenously and resultsin a peak plasma concentration of 8 mg/L, volume ofdistribution would be calculated as follows:volume ofdistribution (V )X80 mgdose 0 10 L8 mg/LresultingCconcentrationFIGURE 1-23.Typical plasma drug concentration versus time curve for a onecompartment model.
Lesson 1: Introduction to Pharmacokinetics and Pharmacodynamics11FIGURE 1-24.Plasma drug concentrations determined at specific time points.The prediction of drug concentrations based on knownconcentrations can be subject to multiple sources oferror. However, if we realize the assumptions used tomake the predictions, some errors can be avoided.These assumptions are pointed out as we review theone-compartment system.From a mathematical standpoint, the prediction ofplasma concentrations is easier if we know that the concentrations are all on a straight line rather than a curve.This conversion can be accomplished for most drugs byplotting the natural logarithm (ln) of the plasma drug concentration versus time. The plot of a curve (Figure 1-25)is, in effect, converted to a straight line by using the natural log of the plasma drug concentration (Figure 1-26).A straight line is obtained from the natural log ofplasma drug concentration versus time plot only fordrugs that follow first-order elimination processes andexhibit one-compartment distribution. First-order elimination occurs when the amount of drug eliminated fromthe body in a specific time is dependent on the amountof drug in the body at that time. This concept isexplained further in Lesson 2.An alternative to calculating the natural log values isto plot the actual concentration and time values onFIGURE 1-26.With a simple one-compartment, intravenous bolus model, aplot of the natural log of plasma concentration versus timeresults in a straight line.semilogarithmic (or semilog) paper (Figure 1-27), a special graph paper that automatically adjusts for the logarithmic relationship by altering the distance betweenlines on the y-axis. The lines on the y-axis are notevenly spaced but rather are logarithmically relatedwithin each log cycle (or multiple of 10). So when theactual values of plasma drug concentrations are plottedagainst the time values, a straight line results. The x-axishas evenly spaced lines; there is no logarithmic conversion of those values. (The term semilogarithmic indicatesthat only one axis is converted.) The numbers on the yaxis may be used to represent 0.1 through 1, 1 through10, 10 through 100, or any series with a 10-fold difference in the range of values.FIGURE 1-25.Plasma drug concentrations can be predicted for timeswhen they were not determined. Concentrations on the linedrawn through the measured concentrations are predictedconcentrations.FIGURE 1-27.Paper with one log-scale axis is called semilog paper.
12Concepts in Clinical PharmacokineticsTABLE 1-3.Time Course of Plasma Gentamicin ConcentrationConcentration (mg/L)Time after Dose (hours)614.422.440.738FIGURE 1-28.When plasma concentration versus time points fall on astraight line, concentrations at various times can be predictedsimply by picking a time point and matching concentration onthe line at that time.From this line, we can predict plasma drug concentrations at times for which no measurements are available(Figure 1-28). CLINICAL CORRELATE CLINICAL CORRELATESemilog graph paper can be found via google.comFor a typical patient, plasma concentrations resultingfrom an 80-mg dose of gentamicin may be as shownin Table 1-3. The plasma concentrations plotted onlinear and semilogarithmic graph paper are shown inFigure 1-29. With the semilog paper, it is easier topredict what the gentamicin plasma concentrationwould be 10 hours after the dose is administered.If a series of plasma concentration versus time pointsare known and plotted on semilog paper, a straight linecan be dra
spersing drug-free intervals with chronic drug use. C LINICAL C ORRELATE One way to compare potency of two drugs that are in the same pharmacologic class is to compare EC 50. The drug with a lower EC 50 is considered more potent. FIGURE 1-5. Relationship of drug concentration at the recep