Transcription
Copyright Pharmaceutical Press www.pharmpress.com6Extravascular routes of drugadministration6.1Introduction1066.2Drug remaining to be absorbed, or drugremaining at the site of administration1066.3Determination of elimination half life(t1/2 ) and elimination rate constant (K orKel )1096.4Absorption rate constant (Ka )1106.5Wagner–Nelson method(one-compartment model) andLoo–Riegelman method(two-compartment model)111Lag time (t0 )1156.66.7Some important comments on theabsorption rate constant1166.8The apparent volume of distribution (V)1166.9Time of maximum drug concentration,peak time (tmax )1176.10Maximum (peak) plasma concentration(Cp )max1186.11Some general comments1206.12Example for extravascular route of drugadministration1216.13Flip-flop kinetics126ObjectivesUpon completion of this chapter, you will have the ability to: calculate plasma drug concentration at any given time after the administration of an extravasculardose of a drug, based on known or estimated pharmacokinetic parameters interpret the plasma drug concentration versus time curve of a drug administered extravascularly as the sum of an absorption curve and an elimination curveemploy extrapolation techniques to characterize the absorption phasecalculate the absorption rate constant and explain factors that influence this constantexplain possible reasons for the presence of lag time in a drug’s absorptioncalculate peak plasma drug concentration, (Cp )max , and the time, tmax , at which this occursexplain the factors that influence peak plasma concentration and peak timedecide when flip-flop kinetics may be a factor in the plasma drug concentration versus time curveof a drug administered extravascularly.Sample chapter for Basic Pharmacokinetics 2nd edition
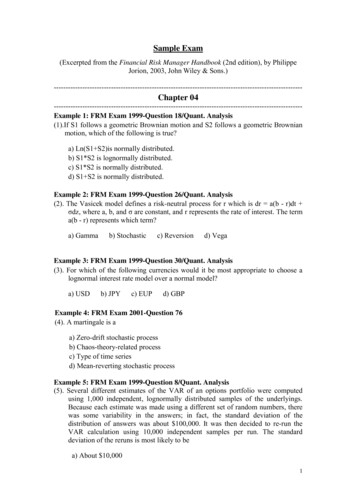
Copyright Pharmaceutical Press www.pharmpress.com106Basic Pharmacokinetics6.1 IntroductionUseful pharmacokinetic parametersDrugs, through dosage forms, are most frequentlyadministered extravascularly and the majority of themare intended to act systemically; for this reason,absorption is a prerequisite for pharmacologicaleffects. Delays or drug loss during absorption maycontribute to variability in drug response and, occasionally, may result in a failure of drug therapy.The gastrointestinal membrane separates the absorption site from the blood. Therefore, passage ofdrug across the membrane is a prerequisite for absorption. For this reason, drug must be in a solutionform and dissolution becomes very critical for theabsorption of a drug. The passage of drug moleculesfrom the gastrointestinal tract to the general circulation and factors affecting this are shown in Figs 6.1and 6.2. Any factor influencing dissolution of thedrug is likely to affect the absorption of a drug. Thesefactors will be discussed, in detail, later in the text.Drug, once in solution, must pass through membranes before reaching the general circulation. Hence,the physicochemical properties of the drug molecule(pKa of the drug, partition coefficient of the drug, drugsolubility, etc.), pH at the site of drug administration,nature of the membrane, and physiological factorswill also influence the absorption of a drug.The present discussion will deal with general principles that determine the rate and extent of drugabsorption and the methods used to assess theseand other pharmacokinetic parameters, from plasmaconcentration versus time data following oral administration of drugs. Emphasis is placed upon absorption of drugs following oral administration because itillustrates all sources of variability encounteredduring drug absorption.Note that a similar approach may be applied todetermine pharmacokinetic parameters of drugs whenany other extravascular route is used.The following assumptions are made. Drug exhibits the characteristics of onecompartment model. Absorption and elimination of a drug followthe first-order process and passive diffusion isoperative all the time. Drug is eliminated in unchanged form (i.e., nometabolism occurs). Drug is monitored in the blood.Figure 6.3 outlines the absorption of a drug that fits aone-compartment model with first-order elimination.The following information is useful:1 equation for determining the plasma concentration at any time t2 determination of the elimination half life (t1/2 )and rate constant (K or Kel )3 determination of the absorption half life (t1/2 )absand absorption rate constant (Ka )4 lag time (t0 ), if any5 determination of the apparent volume of distribution (V or Vd ) and fraction of drug absorbed(F)6 determination of the peak time (tmax )7 determination of the peak plasma or serum concentration (Cp )max .6.2 Drug remaining to beabsorbed, or drug remaining atthe site of administrationEquation (6.1) describes the changes in mass of absorbable drug over time at the site of administration. dXa Ka (Xa )tdt(6.1)where dX/dt is the decrease in the amount of absorbable drug present at the site of administration perunit time (e.g., mg h 1 ); Ka is the first-order absorption rate constant (h 1 ; min 1 ); and (Xa )t is the massor amount of absorbable drug at the site of administration (e.g., the gastrointestinal tract) at time t.Upon integration of Eq. (6.1), we obtain the following:(Xa )t (Xa )t 0 e Ka t FX0 e Ka t(6.2)where (Xa )t 0 is the mass or amount of absorbabledrug at the site of administration at time t 0 (forextravascular administration of drug, (Xa )t 0 equalsFX 0 ); F is the fraction or percentage of the administered dose that is available to reach the general circulation; and X0 is the administered dose ofdrug.If F 1.0, that is, if the drug is completely(100%) absorbed, then(Xa )t X0 e Ka t .Sample chapter for Basic Pharmacokinetics 2nd edition(6.3)
Copyright Pharmaceutical Press www.pharmpress.comExtravascular routes of drug administrationFigure 6.1107Barriers to gastrointestinal absorption.Both Eqs (6.2) and (6.3) and Fig. 6.4 clearly indicate that the mass, or amount, of drug that remainsat the absorption site or site of administration (orremains to be absorbed) declines monoexponentiallywith time.However, since we cannot measure the amountof drug remaining to be absorbed (Xa ) directly, because of practical difficulty, Eqs (6.2) and (6.3), forthe time being, become virtually useless for the purpose of determining the absorption rate constant;and, therefore, we go to other alternatives such asmonitoring drug in the blood and/or urine to determine the absorption rate constant and the absorptioncharacteristics.Monitoring drug in the blood(plasma/serum) or site of measurementThe differential equation that follows relates changesin drug concentration in the blood with time to theabsorption and the elimination rates:dX Ka Xa KXdt(6.4)where dX/dt is the rate (mg h 1 ) of change of amountof drug in the blood; X is the mass or amount ofdrug in the blood or body at time t; Xa is the massor amount of absorbable drug at the absorption siteat time t; Ka and K are the first-order absorption andelimination rate constants, respectively (e.g., h 1 );Ka Xa is the first-order rate of absorption (mg h 1 ,µg h 1 , etc.); and KX is the first-order rate of elimination (e.g., mg h 1 ).Equation (6.4) clearly indicates that rate ofchange in drug in the blood reflects the differencebetween the absorption and the elimination rates (i.e.,Ka Xa and KX, respectively). Following the administration of a dose of drug, the difference between theabsorption and elimination rates (i.e., Ka Xa KX)becomes smaller as time increases; at peak time, thedifference becomes zero.Sample chapter for Basic Pharmacokinetics 2nd edition
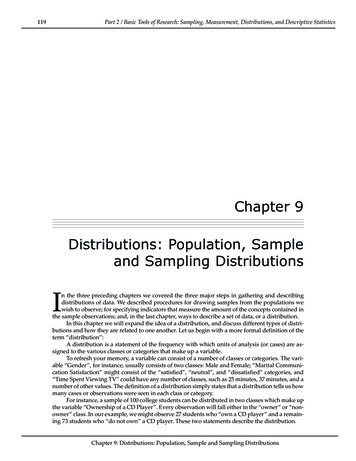
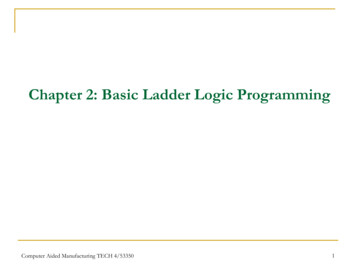
Copyright Pharmaceutical Press www.pharmpress.com108Basic PharmacokineticsFigure 6.2Passage of drug in the gastrointestinal tract until transport across the membrane.SCHEME:XaKa (h–1)(Absorbabledrug at absorption Absorptionsite)X(drug inbody orblood)K (h–1)XuEliminationSETUP:XaKaXKXuFigure 6.3 Absorption of a one-compartment drug with first-order elimination, where Xa is the mass or amount of absorbabledrug remaining in the gut, or at the site of administration, at time t (i.e., drug available for absorption at time t); X is the mass oramount of drug in the blood at time t; Xu is the mass or amount of drug excreted unchanged in the urine at time t; Ka is thefirst-order absorption rate constant (h 1 or min 1 ); and K (or Kel ) is the first-order elimination rate constant (h 1 or min 1 ).Sample chapter for Basic Pharmacokinetics 2nd edition
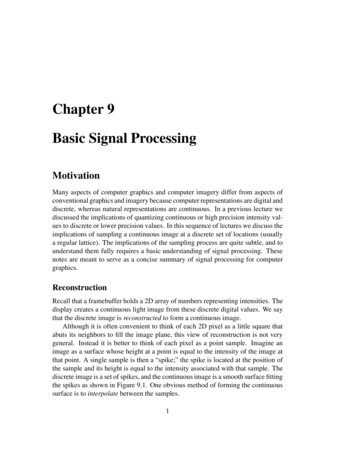
Copyright Pharmaceutical Press www.pharmpress.comExtravascular routes of drug administration(b)Intercept (Xa)0 or FX0Slope Xa (mg)Xa (mg)(a)t 0t 0Time (h)109–Ka2.303Time (h)Figure 6.4 Amount of drug remaining at the site of administration against time in a rectilinear plot (a) and a semilogarithmicplot (b). Xa , amount of absorbable drug at the site of administration; (Xa )0 , amount of absorbable drug at the site ofadministration at time t 0; F, fraction of administered dose that is available to reach the general circulation.Note that, most of the time, the absorptionrate constant is greater than the elimination rate constant. (The exceptional situation when K Ka , termed“flip-flop kinetics,” will be addressed in Section 6.13.)Furthermore, immediately following the administration of a dose of drug, the amount of (absorbable)drug present at the site of administration will begreater than the amount of drug in the blood. Consequently, the rate of absorption will be greater than therate of elimination up to a certain time (prior to peaktime); then, exactly at peak time, the rate of absorption will become equal to the rate of elimination. Finally, the rate of absorption will become smaller thanthe rate of elimination (post peak time). This is simplythe result of a continuous change in the amount of absorbable drug remaining at the site of administrationand the amount of drug in the blood. Note also thatrate of absorption and the rate of elimination changewith time (consistent with the salient feature of thefirst-order process), whereas the absorption and theelimination rate constants do not change.Integration of Eq. (6.4) givesKa (Xa )t 0 Kt(e e Ka t )Ka KKa FX0 Kt (e e Ka t )Ka Kmass of administered dose that is available to reachthe general circulation, which is the same as thebioavailable fraction times the administered dose.Equation (6.5) and Fig. 6.5 show that the massor amount of drug in the body or blood follows a biexponential profile, first rising and thendeclining.For orally or extravascularly administered drugs,generally Ka K; therefore, the rising portion of thegraph denotes the absorption phase.If K Ka (perhaps indicating a dissolution-ratelimited absorption), the exact opposite will holdtrue. (See the discussion of the flip-flop model inSection 6.13.)6.3 Determination of eliminationhalf life (t ) and eliminationrate constant (K or Kel )1/2Equation (6.5), when written in concentration (Cp )terms, takes the form(Cp )t (X)t (6.5)where (X)t is the mass (amount) of drug in the bodyat time t; X0 is the mass of drug at the site of administration at t 0 (the administered dose); F is thefraction of drug absorbed; (Xa )0 FX 0 and is theKa FX0(e Kt e Ka t )V(Ka K)(6.6)where Ka FX 0 /[V(Ka K)] is the intercept of theplasma drug concentration versus time plot (Fig. 6.6).When time is large, because of the fact thatKa K, e Ka t approaches zero, and Eq. (6.6) reducesto(Cp )t Ka FX0(e Kt ).V(Ka K)Sample chapter for Basic Pharmacokinetics 2nd edition(6.7)
Copyright Pharmaceutical Press www.pharmpress.com110Basic PharmacokineticsX (mg)KaXa KXElimination phase(KX KaXa)Absorption phase(KaXa KX)t 0Time (h)Figure 6.5 A typical rectilinear profile illustrating amount of drug (X ) in blood or body against time. Xa , amount of absorbabledrug at the absorption site at time t; Ka and K , first-order absorption and elimination rate constants, respectively; Ka Xa and KX ,first-order rates of absorption and elimination, respectively.(b)Cp (ng mL–1)t 0Intercept Cp (ng mL–1)(a)Time (h)t 0KaFX0V (Ka – K )Slope –K2.303Time (h)Figure 6.6 A plot of plasma concentration (Cp ) against time on rectilinear (a) and semilogarithmic (b) paper. (Xa )0 , amount ofabsorbable drug at the site of administration at time t 0; F, fraction of administered dose that is available to reach the generalcirculation; Ka and K, first-order absorption and elimination rate constants, respectively; V, apparent volume of distribution.The elimination half life and elimination rate constant can be obtained by methods described earlierand illustrated in Fig. 6.7.6.4 Absorption rate constant (Ka )The absorption rate constant is determined by amethod known as “feathering,” “method of residuals,” or “curve stripping.” The method allows theseparation of the monoexponential constituents of abiexponential plot of plasma concentration againsttime. From the plasma concentration versus time dataobtained or provided to you and the plot of the data(as shown in Fig. 6.8) we can construct a table withheadings and columns as in Table 6.1 for the purposeof determining the absorption rate constant.In column 1 of the table, the time values arerecorded that correspond to the observed plasmaconcentrations. This is done only for the absorptionphase. In column 2, the observed plasma concentration values provided only from the absorption phaseare recorded (i.e., all values prior to reaching maximum or highest plasma concentration value). In column 3, the plasma concentration values obtainedonly from the extrapolated portion of the plasmaconcentration versus time plot are recorded (thesevalues are read from the plasma concentration–timeSample chapter for Basic Pharmacokinetics 2nd edition
Copyright Pharmaceutical Press www.pharmpress.com111Extravascular routes of drug administrationTable 6.1 Illustration of the table created for determination of the first-order absorption rate constant KaTime (h)Observed plasma concentration(Cp )obsExtrapolated plasmaconcent
one-compartment model with first-order elimination. The following information is useful: 1 equation for determining the plasma concentra-tion at any time t 2 determination of the elimination half life (t 1 2) and rate constant (K or K el) 3 determination of the absorption half life .t 1 2 / abs and absorption rate constant (K a) 4 lag time (t 0), if anyFile Size: 1MBPage Count: 22