Transcription
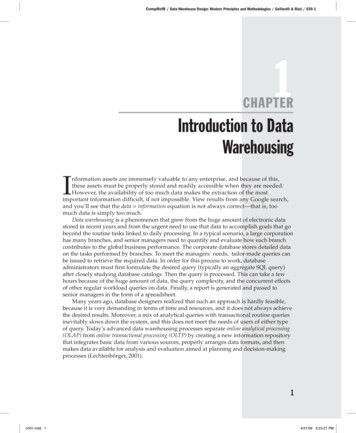
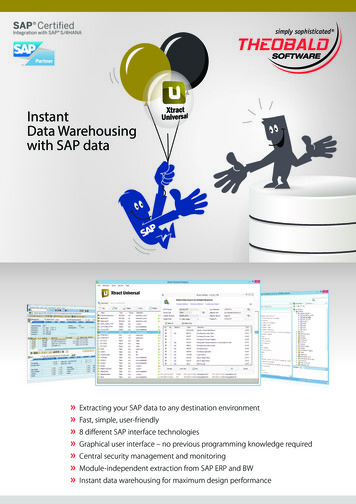
Introduction to Data Warehousing andBusiness IntelligenceSlides kindly borrowed from the course“Data Warehousing and Machine Learning”Aalborg University, DenmarkChristian S. JensenTorben Bach PedersenChristian Thomsen{csj,tbp,chr}@cs.aau.dkCourse Structure Business intelligence Extract knowledge from large amounts of data collected in amodern enterpriseData warehousing, machine learningPurpose Acquire theoretical background in lectures and literature studiesObtain practical experience on (industrial) tools in practicalexercisesData warehousing: constructionof a database with only dataanalysis purposeBusinessIntelligence (BI)Machine learning: findpatterns automaticallyin databases2 1
Literature Multidimensional Databases and DataWarehousing, Christian S. Jensen, Torben BachPedersen, Christian Thomsen, Morgan & ClaypoolPublishers, 2010 Data Warehouse Design: Modern Principles andMethodologies, Golfarelli and Rizzi, McGraw-Hill, 2009 Advanced Data Warehouse Design: FromConventional to Spatial and Temporal Applications,Elzbieta Malinowski, Esteban Zimányi, Springer, 2008 The Data Warehouse Lifecycle Toolkit, Kimball et al.,Wiley 1998 The Data Warehouse Toolkit, 2nd Ed., Kimball andRoss, Wiley, 20023Overview Why Business Intelligence?Data analysis problemsData Warehouse (DW) introductionDW topics Multidimensional modelingETLPerformance optimization4 2
What is Business Intelligence (BI)? From Encyclopedia of Database Systems:“[BI] refers to a set of tools and techniques thatenable a company to transform its businessdata into timely and accurate information for thedecisional process, to be made available to theright persons in the most suitable form.”5What is Business Intelligence (BI)? BI is different from Artificial Intelligence (AI) AI systems make decisions for the usersBI systems help the users make the right decisions, based onavailable data Combination of technologies Data Warehousing (DW)On-Line Analytical Processing (OLAP)Data Mining (DM) 6 3
Why is BI Important? Worldwide BI revenue in 2005 US 5.7 billion 10% growth each yearA market where players like IBM, Microsoft, Oracle, and SAPcompete and invest BI is not only for large enterprises Small and medium-sized companies can also benefit from BI The financial crisis has increased the focus on BI You cannot afford not to use the “gold” in your data7BI and the Web The Web makes BI even more useful Customers do not appear “physically” in a store; their behaviorscannot be observed by traditional methodsA website log is used to capture the behavior of each customer,e.g., sequence of pages seen by a customer, the products viewedIdea: understand your customers using data and BI! Utilize website logs, analyze customer behavior in more detail thanbefore (e.g., what was not bought?)Combine web data with traditional customer data8 4
Case Study of an Enterprise Example of a chain (e.g., fashion stores or car dealers) Each store maintains its own customer records and sales records Hard to answer questions like: “find the total sales of Product X fromstores in Aalborg”The same customer may be viewed as different customers fordifferent stores; hard to detect duplicate customer informationImprecise or missing data in the addresses of some customersPurchase records maintained in the operational system for limitedtime (e.g., 6 months); then they are deleted or archivedThe same “product” may have different prices, or different discountsin different stores Can you see the problems of using those data for businessanalysis?9Data Analysis Problems The same data found in many different systems Example: customer data across different stores anddepartmentsThe same concept is defined differently Heterogeneous sources Relational DBMS, On-Line Transaction Processing (OLTP)Unstructured data in files (e.g., MS Word)Legacy systems 10 5
Data Analysis Problems (cont’) Data is suited for operational systems Accounting, billing, etc.Do not support analysis across business functions Data quality is bad Missing data, imprecise data, different use of systems Data are “volatile” Data deleted in operational systems (6 months)Data change over time – no historical information11Data Warehousing Solution: new analysis environment (DW) where data are Subject oriented (versus function oriented)Integrated (logically and physically)Time variant (data can always be related to time)Stable (data not deleted, several versions)Supporting management decisions (different organization) Data from the operational systems are ExtractedCleansedTransformedAggregated (?)Loaded into the DW A good DW is a prerequisite for successful BI12 6
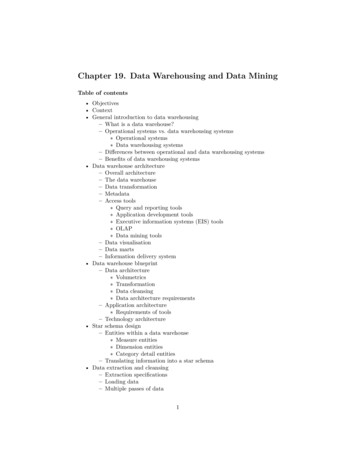
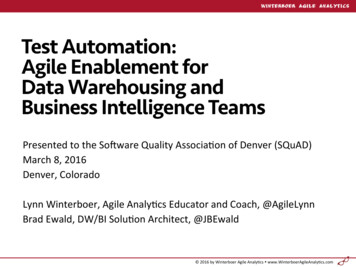
DW: Purpose and Definition DW is a store of information organized in a unifieddata model Data collected from a number of different sources Finance, billing, website logs, personnel, Purpose of a data warehouse (DW): supportdecision making Easy to perform advanced analysis Ad-hoc analysis and reports Data mining: discovery of hidden patterns and trends We will cover this soon You will study this in another course13DW Architecture – Data as Materialized ViewsExisting databasesand systems (OLTP)New databasesand systems WDB(Global) DataWarehouseAppl.DMDBAppl.DBAnalogy: (data) producersVisualization(Local)Data Martswarehouse(data) consumers14 7
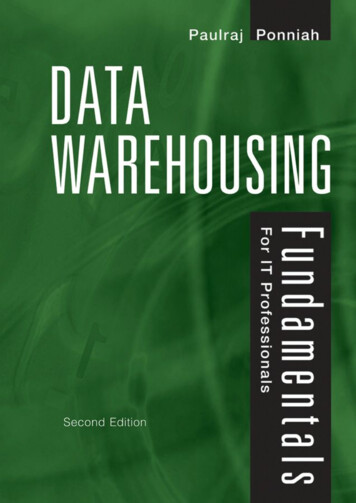
Function vs. Subject Trans.DBDWAll ctedsubjectsAppl.DB15Top-down vs. s.DBAppl.DBAppl.Top-down: DB1. Design of DW2. Design of DMsDWIn-between:1. Design of DW forDM12. Design of DM2 andintegration with DW3. Design of DM3 andintegration with DW4. .D-Appl.DMBottom-up:1. Design of DMs2. Maybe integrationof DMs in DW3. Maybe no DW16 8
Hard/Infeasible Queries for OLTP Why not use the existing databases (OLTP) forbusiness analysis? Business analysis queries In the past five years, which product is the most profitable?Which public holiday we have the largest sales?Which week we have the largest sales?Does the sales of dairy products increase over time? Difficult to express these queries in SQL 3rd query: may extract the “week” value using a function But the user has to learn many transformation functions 4th query: use a “special” table to store IDs of all dairy products,in advance There can be many different dairy products; there can be manyother product types as well The need of multidimensional modeling17Multidimensional Modeling Example: sales of supermarkets Facts and measures Each sales record is a fact, and its sales value is ameasure Dimensions Group correlated attributes into the same dimension easier for analysis tasksEach sales record is associated with its values ofProduct, Store, TimeProduct Type Category StoreTopBeerCityCounty DateBeverage Trøjborg Århus ÅrhusProductStoreSales25 May, 2009 5.75Time18 9
Multidimensional Modeling How do we model the Time dimension?Hierarchies with multiple levelsAttributes, e.g., holiday, event tid dayday week##month year#workday Year1January1st 20091112009No Month2January 22nd 2009112009Yes TWeekDay Advantage of this model?Easy for query (more about this later) Disadvantage?Data redundancy (but controlled redundancy is acceptable) 19Quick Review: Normalized DatabaseProduct l4.00003BeerBeverage7.00004WheatCereal5.00Product 99099Cereal0030137.00067Wheat0990040675.00 Normalized database avoids Redundant dataModification anomalies How to get the original table? (join them) No redundancy in OLTP, controlled redundancy in OLAP20 10
OLTP vs. OLAPOLTPOLAPTargetoperational needsbusiness analysisDatasmall, operational datalarge, historical ery languageSQLnot unified – but MDXis used by manyQueriessmalllargeUpdatesfrequent and smallinfrequent and batchTransactional recoverynecessarynot necessaryOptimized forupdate operationsquery operations21OLAP Data Cube Data cube Useful data analysis tool in DWGeneralized GROUP BY queriesAggregate facts based on chosendimensions 200056CopenhagenBread2000123 Product, store, time dimensionsSales measure of sale facts Why data cube? Good for visualization (i.e., textresults hard to understand)Multidimensional, intuitiveSupport interactive OLAPoperations How is it different from aspreadsheet?22 11
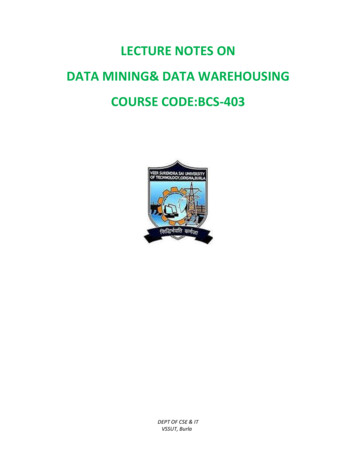
On-Line Analytical Processing (OLAP)102250 On-Line Analytical Processing Interactive analysisExplorative discoveryFast response times requiredAll Time OLAP operations/queries Aggregation, e.g., SUMStarting level, (Year, City) 9 1011 15Roll Up: Less detailDrill Down: More detailSlice/Dice: Selection, Year 200023Advanced Multidimensional Modeling Changing dimensions Some dimensions are not static. They change over time. A store moves to a new location with more spaceThe name of a product changesA customer moves from Aalborg Øst to HasserisHow do we handle these changes? Large-scale dimensional modeling How do we coordinate the dimensions in different datacubes and data marts?DimensionsSalesBus architectureDatamartsTimeCustomerProduct CostsProfit Supplier 24 12
Extract, Transform, Load (ETL) “Getting multidimensional data into the DW”Problems1. Data from different sources2. Data with different formats3. Handling of missing data and erroneous data4. Query performance of DW ETL ExtractTransformations / cleansingLoad(for problem #1)(for problems #2, #3)(for problem #4)The most time-consuming process in DW development 80% of development time spent on ETL25Performance OptimizationSales The data warehouse contains GBytes oreven TBytes of data!tidpidlocidsales111102112032340 1 billion rows OLAP users require fast query response time They don’t want to wait for the result for 1 hour!Acceptable: answer within 10 seconds Idea: precompute some partial result in advance and store it At query time, such partial result can be utilized to derive the finalresult very fast26 13
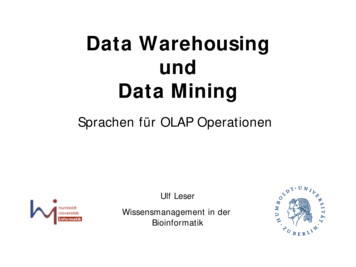
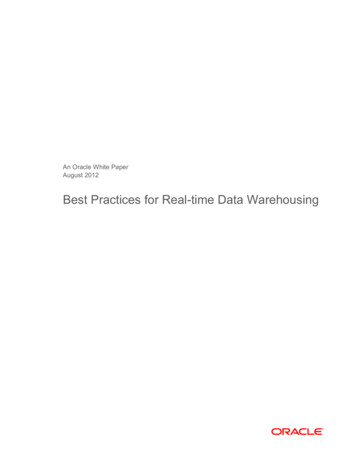
Materialization Example Imagine 1 billion sales rows, 1000 products, 100 locationsCREATE VIEW TotalSales (pid, locid, total) AStidSELECT s.pid, s.locid, SUM(s.sales)1FROM Sales s2GROUP BY s.pid, s.locid3The materialized view has 100,000 rowsSales SELECT p.category, SUM(s.sales)FROM Products p, Sales s WHERE p.pid s.pidGROUP BY p.categoryRewrite the query to use the view: SELECT p.category, SUM(t.total)FROM Products p, TotalSales tWHERE p.pid t.pid GROUP BY p.categoryQuery becomes 10,000 times faster!locidsales111011202340 1 billion rowsWish to answer the query: pidVIEW TotalSalespidlocidsales11302340 100,000 rows27Data Warehouse Architecture Central Federated Tiered28 14
Central DW ArchitectureClients All data in one, central DWAll client queries directly on thecentral DWPros SimplicityEasy to manageCentralDWCons Bad performance due to noredundancy/workload distributionSourceSource29Federated DW Architecture Clients Data stored in separate data marts,aimed at special departmentsLogical DW (i.e., virtual)Data marts contain detail dataPros Cons FinancemartMrktngmartDistr.martPerformance due to distributionMore complexLogicalDWSourceSource30 15
Tiered Architecture Central DW is materializedData is distributed to data marts inone or more tiersOnly aggregated data in cube tiersData is aggregated/reduced as itmoves through tiersPros Best performance due toredundancy and distributionCentralDWCons Most complexHard to manage31Common DW Issues Metadata management Need to understand data metadata neededGreater need in OLAP than in OLTP as “raw” data is usedNeed to know about: Data definitions, dataflow, transformations, versions, usage, security DW project management DW projects are large and different from ordinary SW projects 12-36 months and US 1 million per projectData marts are smaller and “safer” (bottom up approach)Reasons for failure Lack of proper design methodologiesHigh HW SW costDeployment problems (lack of training)Organizational change is hard (new processes, data ownership,.)Ethical issues (security, privacy, )32 16
Topics not Covered in the Course Privacy/security of data during ETL Encryption may not workDuring extraction/transformation, someone may need to knoworiginal values in order to check whether ETL performs correctly Data Visualization (VIS) Decision Analysis (What-if) Customer Relationship Management (CRM)33Summary Why Business Intelligence?Data analysis problemsData Warehouse (DW) introductionDW Topics Multidimensional modelingETLPerformance optimization BI provide many advantages to your organization A good DW is a prerequisite for BI34 17
Multidimensional DatabasesOverview Cubes: Dimensions, Facts, MeasuresOLAP QueriesRelational ImplementationRedundancy21
ER Model vs. Multidimensional Model Why don’t we use the ER model in data warehousing? ER model: a data model for general purposes All types of data are “equal”, difficult to identify the data that isimportant for business analysis No difference between: What is importantWhat just describes the importantNormalized databases spread informationWhen analyzing data, the information must be integrated againHard to overview a large ER diagram (e.g., over 100entities/relations for an enterprise)3ER Model vs. Multidimensional Model The multidimensional model Its only purpose: data analysis It is not suitable for OLTP systemsMore built in “meaning” What is importantWhat describes the importantWhat we want to optimizeEasy for query operations Recognized by OLAP/BI tools Tools offer powerful query facilities based on MD des
Data Warehouse Design: Modern Principles and Methodologies, Golfarelli and Rizzi, McGraw-Hill, 2009 Advanced Data Warehouse Design: From Conventional to Spatial and Temporal Applications, Elzbieta Malinowski, Esteban Zimányi, Springer, 2008 The Data Warehouse Lifecycle Toolkit, Kimball et al., Wiley 1998 The Data Warehouse Toolkit, 2nd Ed., Kimball and Ross, Wiley, 2002 4 .File Size: 599KBPage Count: 72