Transcription
October 2021The MSCI Net-Zero TrackerA quarterly gauge of progress by the world’slisted companies toward curbing climate risk1 msci.com
IntroductionThe world’s listed companies must act now to drive their greenhousegas emissions to net-zero.With delegates preparing to gather in Glasgow for the COP26climate summit, we estimate that emissions of listed companieswould cause temperatures to rise by 3 degrees Celsius (3 C) abovepreindustrial levels. That will not prevent a climate disaster. Nor willit work for investors who aim to cut emissions associated with theirinvestments in half, just nine years from now, and to net-zero in thecoming decades.Investors are monitoring whether companies have credible plansto reduce their carbon footprint and are tracking the alignmentof their portfolios with the Paris Agreement, which aims to limitglobal temperature rise to well below 2 degrees Celsius (2 C), andpreferably to no more than 1.5 C.The MSCI Net-Zero Tracker indicates the collective progress oflisted companies toward global climate goals.1 It offers an objectivegauge of companies' contribution to total carbon emissions and theirprogress toward a net-zero economy.This edition of the Net-Zero Tracker looks at the temperature riseof listed companies based on their projected emissions and countsdown the time remaining to reach net-zero. It shows the companieswith the largest carbon footprints, shines a light on corporateleaders and laggards in disclosure, and highlights companieswhose decarbonization targets are notable for their alignment withglobal goals.The Net-Zero Tracker underscores the need for climate-relatedfinancial disclosures with quantitative measurement based oninternationally agreed standards. It also emphasizes the need foraction — at the COP26 climate talks and beyond — so that investorscan assess companies' resilience to a changing world.2 msci.com1 Represented by the MSCI All Country World Investable Market Index (ACWI IMI), which includeslarge-, mid- and small-cap traded listed companies across 23 developed-market and 27 emergingmarket countries. With 9,226 constituents, the index covers approximately 99% of the global equityinvestment opportunity set. As of September 30, 2021.
Key findings3 CThe estimated rise in averagetemperatures abovepre-industrial levels based onprojected carbon emissions of theworld’s listed companies. 2 C43%Sounding the alarmThe lion’s share of listed companies are sharply misaligned with the goal ofpreventing the worst effects of a warming planet.»Listed companies are on track to cause average temperatures to rise bynearly 3 C above preindustrial levels.»Less than half (43%) of listed companies align with a 2 C temperature rise,which falls short of the Paris Agreement goal of keeping warming well below2 C, preferably to no more than 1.5 C, above pre-industrial levels.»Less than 10% of listed companies align with a 1.5 C temperature rise, whichscience tells us offers the best chance of averting a climate disaster.»A majority of listed companies (57%) do not align with any globally agreedtemperature target.»Listed companies across all regions are misaligned with global climate goals.Every sector has a climate problemWhile the energy, materials and utilities sectors account for the bulk of globalcorporate emissions, there are high emitters in every sector. Even in typicallylow-emissions industries like health care, some companies’ emissions arealigned with temperatures that are much too high.A shrinking windowLess than half (43%) of listedcompanies align with thegoal of limiting temperatureincrease to below 2 C. 1.5 C10%Less than 10% of listedcompanies align with the goal oflimiting temperature increaseto below 1.5 C.We estimate listed companies will burn through their share of the global carbonbudget for keeping temperature rise below 1.5 C by November 2026, based ontheir emissions as of the end of August. That is five months less than remainedin May and reflects the surge in emissions as economies rebound from thepandemic.2Listed companies' annual estimated emissions were 11.1 billion tons (gigatons)of direct (Scope 1) greenhouse gases at the end of August, up from 10.9 gigatonsat the end of May.³ The only way to buy more time is to cut net emissions faster.Future editions of the MSCI Net-Zero Tracker will highlight both theaggregate share of MSCI All Country World Investable Market Index(MSCI ACWI IMI) constituents that have set net-zero targets and thetargets’ thoroughness.*2 The calculation reflects listed companies’ share of the global budget, which is the total amount of greenhousegas that humans can put into the atmosphere without undermining the Paris Agreement goal of keepingwarming well below 2 C. See the MSCI Net-Zero Tracker (July 2021), available at CI-Net-Zero-Tracker.pdf3 As of September 8, 20213 msci.com* The MSCI Net-Zero Tracker is a summary report. Please contact us for details about any of the information covered.
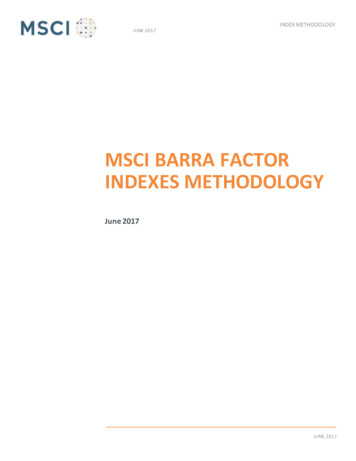
Taking thetemperatureof listedcompaniesA tale of two oil giantsROYAL DUTCH SHELL PLCIMPLIED TEMPERATURE RISELAGGINGMISALIGNED2.1ºC2ºC ALIGNED2 C TrajectoryAbsolute emissions [Megatons CO2e]700600Listed companies’ emissions trajectoriesversus their carbon budget can be translatedinto an implied temperature rise metricshowing the warming scenario they align withacross all emissions scopes.4 Depending ontheir commitments, listed companies withsimilar emissions today could be on verydifferent paths for the future.Take the oil giants Royal Dutch Shell andExxon Mobil, for example. Both emit hundredsof millions of tons of carbon every year.But their future pathways look very different.Shell has set a target that addresses itscarbon footprint across all emissions scopeswith the goal of reaching net-zero in less than30 years, which aligns with a temperature riseof 2.1 C. Exxon, on the other hand, has yetto set a net-zero target and is on a path forwarming of over 4 C.50040030020010002020203020402050Annual Projected Carbon EmissionsAbsolute Carbon Budget OvershootMSCI 2 C Trajectory (Annual Budget)Absolute Carbon Budget UndershootEXXON MOBIL CORPORATIONIMPLIED TEMPERATURE RISEMISALIGNEDLAGGINGover4ºC2ºC ALIGNED2 C TrajectoryAbsolute emissions [Megatons CO2e]120010008006004004 MSCI measures the remaining emissions budget for eachcompany within the MSCI ACWI IMI and calculates an impliedtemperature rise that considers the company’s Scope 1, 2 and 3emissions together with any emissions-reduction targets.For more on how MSCI calculates implied temperature rise .4 msci.com20002020203020402050Annual Projected Carbon EmissionsAbsolute Carbon Budget OvershootMSCI 2 C Trajectory (Annual Budget)Absolute Carbon Budget Undershoot
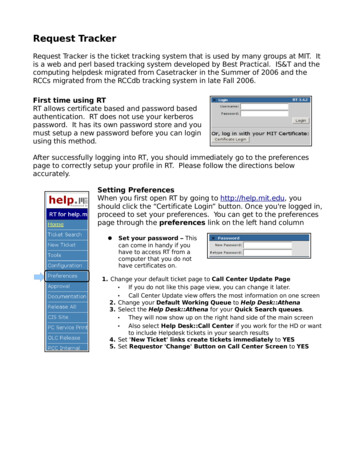
Companies remain farfrom the global goalListed companies are putting carbon into the atmosphere at a rate that would make the planet nearly 3 C warmer.Less than half are on track to keep warming below 2 C, and only 10% are aligned with 1.5 C.Listed companies are on track to make the world 3 C warmerNot Paris-aligned (57%)Paris-aligned (43%)1210% of companies8Aggregate temperature ofthe world’s listed companies 3 C64200123456789MSCI Implied Temperature Rise in CAs of August 31, 20215 msci.com 1.5 C (10%) 1.5 C 2 C (33%) 2 C 3 C (33%) 3 C (24%)Implied Temperature Riseof listed companies 3 CParis agreement10
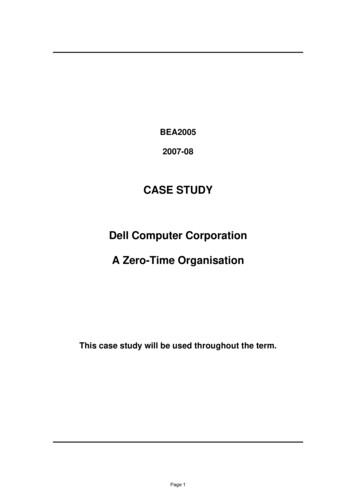
No sector is immuneSome sectors are running hotter than others — the energy, materials and utilities sectors emit more and may beharder to decarbonize than sectors such as health care, financials and communication services. But there arehigh-emitting companies in every sector.Implied temperature rise by GICS sectorThe outliers, even in low-emitting sectors, consume a disproportionate share of their industry’s remaining budget.In short, such listed companies are heavily spending other companies' emissions. For the economy to reach net-zeroemissions in less than 30 years, every company on track to exceed globally agreed thresholds will have to decarbonize.Energy6.5 CMaterials4.0 CUtilities3.7 CConsumerDiscretionary3.3 CIndustrials2.9 CConsumerStaples2.3 CInformationTechnology2.1 CReal Estate1.9 CHealth Care1.7 CFinancials1.7 CCommunicationServices1.6 C0 1.5 CAs of August 31, 20216 msci.com20 1.5 C 2 C406080Share of companies 2 C 3 C 3 C100Implied Temperature Rise
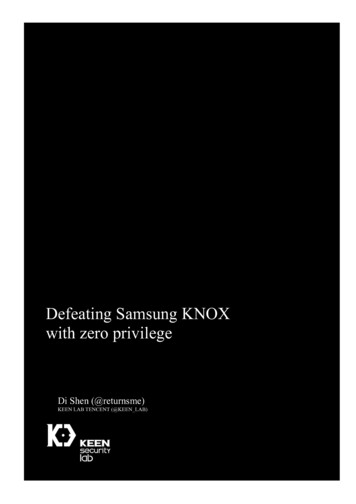
Taking corporatetemperatures by regionListed companies in every region are emitting too much. Though companies in developed economies are projectedto become more carbon efficient than those in emerging economies, no region yet aligns with the Paris Agreementtarget. And because every company’s emissions warm the same atmosphere, carbon intensity is a global problem.Implied temperature rise of listed companies by regionDeveloped MarketsEmerging Markets C5.04.54.03.53.02.52.01.51.00.50.0As of August 31, 2021For the definition of developed- and emerging-market regions, see classification7 msci.com
We’re running out of timeto reach net-zero emissionsRemaining 2 C budget of MSCI ACWI IMIcompanies: 230 gigatons of CO2eRemaining 1.5 C budget of MSCI ACWI IMIcompanies: 58 gigatons of CO2eCurrent annual emissions of MSCI ACWI IMIcompanies: 11.1 gigatons of CO2e60.3 gigatons of CO2e of MSCI ACWI IMIcompanies since the Paris Agreement(Dec. 2015)The window for reducing corporate emissions is shrinking.The world’s listed companies will deplete their share of theglobal emissions budget for keeping temperature rise to1.5 C by November 2026, based on their current greenhousegas output.5There is still room for a course correction, but it will demanda pivot without precedent. Listed companies need to cut theircarbon intensity by 10% each year on average between now and2050 to align with a 1.5 C rise in temperature. But from 2016to 2020, less than a quarter of the world’s listed companiesmanaged that feat.65 The hourglass shows annual total Scope 1 emissions of MSCI ACWI IMI constituents(not index-weighted) based on listed companies’ reported emissions data and MSCIestimates, up to 2020. Emissions for 2020 that companies haven't yet reported and2021 figures are based solely on MSCI estimates, given a lag in company reporting.The remaining future emissions budget to achieve a 1.5 C and 2 C warming scenarioare calculated based on bottom-up estimates (sum of remaining emissions budgetof all MSCI ACWI IMI constituents) as of August 31, 2021.6 See “Net-Zero Alignment, Objectives and Strategic Approaches for Investors,” MSCIESG Research, September 20, 2021 at lignment-objectives/027524954468 msci.com05 03YEARSMONTHSDAYS00MINUTTime remaining until listed companies depletethe emissions budget for keeping globaltemperature rise below 1.5 C20 09YEARSMONTHSDAYSTime remaining until listed companies depletethe emissions budget for keeping globaltemperature rise below 2 C00MINU
Global and MSCIACWI IMI Scope 1 emissionsCorporate greenhouse gas emissions are heading in the wrong direction. We estimate that direct (Scope 1) emissionsof the world’s listed companies will rise 6.7% this year as global economic activity continues to return topre-pandemic levels.Listed company emissions are forecast to account for about a fifth (19%) of this year’s total global carbon budget of58 gigatons, which measures the total amount of greenhouse gas that can be put into the atmosphere and still limitwarming to 1.5 C.The table below shows the total MSCI ACWI IMI Scope 1 greenhouse gas emissions (sum for all constituents withoutindex weighting) and total global emissions, as of August 31, 2021.Historicalgreenhouse gasemissions [Gt Global*51.251.751.851.953.555.359.155.358.0MSCI ACWI IMI**10.910.410.29.610.211.411.310.411.1Global emissions through the end of 2019 are based on annual UN Environment Programme reports. Global emissions forecasts for 2020 and 2021are estimates based on changes in emissions as reported by Carbon Monitor (carbonmonitor.org).** ACWI IMI emissions for 2019 as reported by companies or estimated by MSCI where not reported. Emissions for 2020 are based on companyemissions data where available. Where unavailable, MSCI ESG Research estimates emissions based on the company's sales figures. MSCIestimates changes in emissions for 2021 based on changes in emissions as reported by Carbon Monitor.9 msci.com
Scope 1 greenhouse gas emissions of listed companies31 Aug 202112GHG emissions in Gigatons11.310.911.110.4108642ACWI IMI10 msci.comACWI IMI ssion since the Paris agreement 60.3Gt
The top 10 listed companieswith the largest carbon footprintsThe table below shows the 10 largest emitters in the MSCI ACWI IMI based on total greenhouse gas emissions in the12 months that ended August 31, 2021. It also shows the contribution of each of those companies' emissions to thetotal emissions of listed companies, as well as differences in transparency. Among companies with the largest carbonfootprints, two – Gazprom and Royal Dutch Shell – report their emissions fully. Two others on the list – Saudi ArabianOil Company and Coal India – report less than all of their direct (Scope 1) emissions.IssuerSaudi Arabian OilCompanyScope 1emissions[tons of CO2e]Scope 2emissions[tons of CO2e]Scope 3emissions[tons of CO2e]Total carbonemissions[tons of CO2e]*Ratio of totalcompany emissions(reported/estimated) vsACWI IMI totalemissions****Saudi 284Estimated 62,6281,013,640,003Estimated only***1.6%NK ROSNEFT' 734%1.5%PetroChinaCompany ,031,70898%1.0%GAZPROM PAOCOAL INDIA LTDEXXON MOBILCORPORATIONChina ShenhuaEnergy CompanyLimitedROYAL DUTCHSHELL PLCBP P.L.C.Daimler AG*CountrySum of reportedemissions vs MSCIestimated totalemissions 09,237561,071,23719%0.9%Sum of reported or estimated Scope 1 and 2 emissions plus Scope 3 emissions estimates.** If a company does not report its Scope 1 and 2 carbon emissions data, MSCI estimates each scope separately based on either the company’spreviously reported emissions data or, if none, the carbon emissions intensity of the company’s production or industry segments. We estimateScope 3 emissions for all companies in our coverage based on company-specific information that considers both the revenue intensity of emissionsand production data, in line with the Greenhouse Gas Protocol framework. For more information, please see: “MSCI Climate Change MetricsMethodology and Definition” and “Scope 3 Carbon Emissions Estimation Methodology.” MSCI ESG Research LLC*** Comparison between reported and estimated emissions does not apply because the company reports only some of its Scope 1 emissions.Hence, MSCI uses estimates alone to calculate the company's total emissions.****Because companies' share their value chain with multiple other companies, double counting is unavoidable when estimating Scope 2 and 3emissions. The comparison here, on average, cancels this double counting by comparing each listed company's share of total emissions to ACWIIMI total emissions.11 msci.com
Shining a light on disclosure:leaders and laggardsWhat gets measured gets managed. Investors need emissions disclosures to assess the resilience of every companyto climate change. Disclosure helps investors assess the carbon intensity of companies, to model climate-relatedfinancial risk and its possible impact on the performance of portfolios and to allocate capital accordingly.Public companies with improved emissions reportingThe table below shows the 15 largest listed companies by market capitalization in the MSCI ACWI IMI that reportedadditional scopes or categories of greenhouse gas emissions in the 12 months that ended August 31, 2021. As ithappens, the companies below also are now reporting substantially all their emissions across all emissions scopes.IssuerTotal reported emissions[tons CO2e]Total estimated emissions[tons CO2e]Sum of reported emissions vs MSCIestimated total emissions [%]*Deutsche Telekom AGGermany18,931,68416,696,169113%HESS OYOTA INDUSTRIES CORPORATIONJapan48,455,81848,341,263100%NANYA TECHNOLOGY CORPORATIONTaiwan1,381,0141,391,16599%Mitsui Chemicals, Inc.Japan16,752,06416,954,59699%EIZO CorporationJapan381,275388,53198%CNX RESOURCES CORPORATIONU.S.29,960,00030,631,42798%GREIF, INC.U.S.5,693,1005,821,25998%Yadea Group Holdings LtdChina23,80924,35198%Clariant AGChina4,990,0005,137,89397%SERCO GROUP PLCU.K.1,170,1331,206,76897%COVANTA HOLDING 0,0001,384,973,49494%DAIWA HOUSE INDUSTRY CO.,LTD.A.P. MOELLER - MAERSK A/SGAZPROM PAO*CountryIf a company does not report its Scope 1 and 2 carbon emissions data, MSCI estimates each scope separately based on either the company’spreviously reported emissions data or, if none, the carbon emissions intensity of the company’s production or industry segments. We estimateScope 3 emissions for all companies in our coverage based on company-specific information that considers both the revenue intensity of emissionsand production data, in line with the Greenhouse Gas Protocol framework. For more information, please see: “MSCI Climate Change MetricsMethodology and Definition” and “Scope 3 Carbon Emissions Estimation Methodology.” MSCI ESG Research LLC12 msci.com
The largest emittersthat have not disclosed theirgreenhouse gas emissionsThe table below shows the 10 largest emitters based on MSCI's estimates of emissions across all emissions scopesthat have not reported any of their greenhouse gas emissions as of August 31, 2021.7IssuerShaanxi Coal Industry Company LimitedEmissions referenceyear (note capitalization)Total estimated emissions[tons CO2e]GICS 146,814,617China State Construction Engineering anxi Coking Coal Energy Group Co., 910Shanxi Lu'an Environmental Energy Dev. Co., LtdChina2020Energy73,857,910CHINA AVIATION OIL (SINGAPORE)CORPORATION LTDChina2020Energy64,153,719Dongfang Electric Corporation LimitedChina2020Industrials57,586,774HUAYU Automotive Systems Company LimitedChina2020Cons. 29BERKSHIRE HATHAWAY INC.*PBF ENERGY INC.MASTEC, INC.*CountryBerkshire Hathaway Inc., a holding company, has not reported carbon emissions as of August 31, 2021. At least three of its subsidiaries —Berkshire Hathaway Energy, MidAmerican Energy Company, and Burlington Northern Santa Fe (BNSF) — have reported emissions separately. Theholding company, however, has not reported its emissions in the aggregate.7 MSCI reported incorrectly in July that Coal India and Surgutneftegas PAO had not reported any of their emissions as of May 31, 2021. Coal India reported its Scope 1and 2 emissions, which totaled 5 megatons of CO2, in April 2021. Surgutneftegaz PAO reported its Scope 1 and 2 emissions for its oil and gas production business, whichtotaled 2 megatons of CO2 in June 2020 and 1 megaton of CO2 in June 2021, respectively.13 msci.com
Public companies with themost thoroughemissions-reduction targetsNot all decarbonization targets are worthy of the task. While corporate climate leaders aim to achieve net-zeroemissions across their entire carbon footprint, some companies start with targets that address only a fraction.The table below show the 10 companies in the MSCI ACWI IMI that have published the most thorough corporatedecarbonization targets in the 12 months that ended August 31, 2021.We assessed thoroughness according to three criteria: comprehensiveness (the table below comprises targets thataddress a company’s total emissions), the change in emissions (% of tons of CO2e) targeted each year and the impliedtemperature rise that would result.8IssuerCountryLatest targetannouncementdateAnnual totalemissions (tonsof CO2e)Projected normalizedchange in emissionsper year [%]Comprehensivenessof target [%]Impliedtemperaturerise ( 3Japan2020141,675-3.231001.3Astrazeneca PLCU.K.20207,803,145-8.691001.3MORGAN SINDALL GROUP PLCU.K.20203,969-3.21001.3Koninklijke BAM Groep N.V.Netherlands20203,642,859-3.071001.3ROYAL DUTCH SHELL PLCNetherlands2020657,031,708-3.231002.1J Sainsbury PLCH & M Hennes & Mauritz ABGlaxoSmithKline PLCElectricite de France SABT GROUP PLCShionogi & Co., Ltd.8 MSCI measures comprehensiveness as the percentage of Scope 1, 2 and 3 emissions covered by the company’s targets. MSCI standardizes companies’ projectedemissions to show them as the amount to be reduced annually.14 msci.com
ConclusionThe world's companies are running out of time to slow theworst of climate change. We estimate that emissions of listedcompanies would make the world roughly 3 C warmer.Fifty-seven percent of listed companies have yet to align with thegoal of keeping global warming well below 2 C, preferably to nomore than 1.5 C, above preindustrial levels, as called for by theParis Agreement. Even low-emissions sectors include companieswith high emissions. Such companies are putting carbon intothe atmosphere in amounts that far exceed their fair share of theemissions budget that remains for keeping temperature rise withinthe globally agreed threshold.Corporate carbon emissions, meanwhile, are ticking back up asthe global economy starts to recover from the pandemic. Thewindow for keeping average temperature rise to 1.5 C narrowed byfive months between May and August.Gaps also remain in companies’ disclosure of their carbonemissions. Some companies are broadening their emissionsreporting and setting decarbonization targets that align withglobal goals. Others have yet to disclose their emissions at all.Investors need climate disclosures with measurable data toassess the resilience of companies to both the physical risksof climate change and the risks of transitioning to a net-zeroeconomy. Companies must do more to drive down and discloseemissions. The time to act is slipping away.15 msci.com
GlossaryComprehensiveness (of emission reporting or target setting): Percentageof listed companies’ Scope 1, 2 and 3 emissions covered by emissionsreporting or target setting.Carbon dioxide equivalent (C02e): Greenhouse gas emissions with thesame global warming potential as one metric ton of carbon.Emissions intensity: Greenhouse gas emissions in CO2-equivalent tons permillion USD of company sales.Implied Temperature Rise: A measure that converts a company’s currentand projected greenhouse gas emissions across all emissions scopes(based on the company's track record and stated reduction targets) to anestimated rise in global temperatures by comparing those emissions withthe global carbon for keeping warming well below 2 C.Megaton [Mt]: One million tons (of emissions).GICS : The the global industry classification standard jointly developed byMSCI Inc. and S&P Global Market Intelligence.Gigaton [Gt]: One billion tons (of emissions).MSCI ACWI Investable Market Index (IMI): Captures listed large-, midand small-cap companies across developed- and emerging-marketcountries. With 9,226 constituents (as of Sept. 20, 2021), this index coversapproximately 99% of the global equity investment opportunity set.Remaining emissions budget: A company's remaining future emissionsbudget in tons of C02e to stay within a 1.5 C or 2 C warming scenario.(Please contact esgclientservice@msci.com for full methodology.)Scope 1 emissions: Listed companies' direct greenhouse gas emissions intons of C02 equivalent (C02e).Scope 2 emissions: Listed companies' greenhouse gas emissions fromelectricity use in tons of C02 equivalent (C02e).Scope 3 emissions: Listed companies' indirect greenhouse gas emissionsin tons of CO2 equivalent (CO2e) from upstream supply chain andemissions inherent in products and services (downstream). Scope 3 covers15 categories of upstream and downstream emissions as defined by theGreenhouse Gas Protocol.16 msci.com
About MSCIMSCI is a leading provider of critical decision support tools and servicesfor the global investment community. With over 50 years of expertise inresearch, data and technology, we power better investment decisions byenabling clients to understand and analyze key drivers of risk and returnand confidently build more effective portfolios. We create industry-leadingresearch-enhanced solutions that clients use to gain insight into and improvetransparency across the investment process.About MSCI ESG Research Products and ServicesMSCI ESG Research products and services are provided by MSCI ESGResearch LLC, and are designed to provide in-depth research, ratings andanalysis of environmental, social and governance-related business practicesto companies worldwide. ESG ratings, data and analysis from MSCI ESGResearch LLC. are also used in the construction of the MSCI ESG Indexes.MSCI ESG Research LLC is a Registered Investment Adviser under theInvestment Advisers Act of 1940 and a subsidiary of MSCI Inc.To learn more, please visit www.msci.com.17 msci.com
Notice and disclaimerThis document and all of the information contained in it, including without limitation all text, data, graphs, charts (collectively, the “Information”) is the property of MSCI Inc. or its subsidiaries (collectively,“MSCI”), or MSCI’s licensors, direct or indirect suppliers or any third party involved in making or compiling any Information (collectively, with MSCI, the “Information Providers”) and is provided forinformational purposes only. The Information may not be modified, reverse-engineered, reproduced or redisseminated in whole or in part without prior written permission from MSCI. All rights in theInformation are reserved by MSCI and/or its Information Providers.The Information may not be used to create derivative works or to verify or correct other data or information. For example (but without limitation), the Information may not be used to create indexes,databases, risk models, analytics, software, or in connection with the issuing, offering, sponsoring, managing or marketing of any securities, portfolios, financial products or other investment vehiclesutilizing or based on, linked to, tracking or otherwise derived from the Information or any other MSCI data, information, products or services.The user of the Information assumes the entire risk of any use it may make or permit to be made of the Information. NONE OF THE INFORMATION PROVIDERS MAKES ANY EXPRESS OR IMPLIEDWARRANTIES OR REPRESENTATIONS WITH RESPECT TO THE INFORMATION (OR THE RESULTS TO BE OBTAINED BY THE USE THEREOF), AND TO THE MAXIMUM EXTENT PERMITTED BY APPLICABLELAW, EACH INFORMATION PROVIDER EXPRESSLY DISCLAIMS ALL IMPLIED WARRANTIES (INCLUDING, WITHOUT LIMITATION, ANY IMPLIED WARRANTIES OF ORIGINALITY, ACCURACY, TIMELINESS,NON-INFRINGEMENT, COMPLETENESS, MERCHANTABILITY AND FITNESS FOR A PARTICULAR PURPOSE) WITH RESPECT TO ANY OF THE INFORMATION.Without limiting any of the foregoing and to the maximum extent permitted by applicable law, in no event shall any Information Provider have any liability regarding any of the Information for any direct,indirect, special, punitive, consequential (including lost profits) or any other damages even if notified of the possibility of such damages. The foregoing shall not exclude or limit any liability that may not byapplicable law be excluded or limited, including without limitation (as applicable), any liability for death or personal injury to the extent that such injury results from the negligence or willful default of itself,its servants, agents or sub-contractors.Information containing any historical information, data or analysis should not be taken as an indication or guarantee of any future performance, analysis, forecast or prediction. Past performance does notguarantee future results.The Information should not be relied on and is not a substitute for the skill, judgment and experience of the user, its management, employees, advisors and/or clients when making investment and otherbusiness decisions. All Information is impersonal and not tailored to the needs of any person, entity or group of persons.None of the Information constitutes an offer to sell (or a solicitation of an offer to buy), any security, financial product or other investment vehicle or any trading strategy.It is not possible to invest directly in an index. Exposure to an asset class or trading strategy or other category represented by an index is only available through third party investable instruments (if any)based on that index. MSCI does not issue, sponsor, endorse, market, offer, review or otherwise express any opinion regarding any fund, ETF, derivative or other security, investment, financial product ortrading strategy that is based on, linked to or seeks to provide an investment return related to the performance of any MSCI index (collectively, “Index Linked Investments”). MSCI makes no assurancethat any Index Linked Investments will accurately track index performance or provide positive investment returns. MSCI Inc. is not an investment adviser or fiduciary and MSCI makes no repres
Sep 30, 2021 · investments in half, just nine years from now, and to net-zero in the coming decades. Investors are monitoring whether companies have credible plans to reduce their carbon footprint and are tracking the alignment of their portfolios with the Paris Agreement, which aims to limit global temperature