Transcription
Normalized Hurricane Damage in the United States:1900–2005Roger A. Pielke Jr.1; Joel Gratz2; Christopher W. Landsea3; Douglas Collins4; Mark A. Saunders5; andRade Musulin6Abstract: After more than two decades of relatively little Atlantic hurricane activity, the past decade saw heightened hurricane activityand more than 150 billion in damage in 2004 and 2005. This paper normalizes mainland U.S. hurricane damage from 1900–2005 to 2005values using two methodologies. A normalization provides an estimate of the damage that would occur if storms from the past madelandfall under another year’s societal conditions. Our methods use changes in inflation and wealth at the national level and changes inpopulation and housing units at the coastal county level. Across both normalization methods, there is no remaining trend of increasingabsolute damage in the data set, which follows the lack of trends in landfall frequency or intensity observed over the twentieth century.The 1970s and 1980s were notable because of the extremely low amounts of damage compared to other decades. The decade 1996–2005has the second most damage among the past 11 decades, with only the decade 1926–1935 surpassing its costs. Over the 106 years ofrecord, the average annual normalized damage in the continental United States is about 10 billion under both methods. The mostdamaging single storm is the 1926 Great Miami storm, with 140–157 billion of normalized damage: the most damaging years are 1926and 2005. Of the total damage, about 85% is accounted for by the intense hurricanes 共Saffir-Simpson Categories 3, 4, and 5兲, yet thesehave comprised only 24% of the U.S. landfalling tropical cyclones. Unless action is taken to address the growing concentration of peopleand properties in coastal areas where hurricanes strike, damage will increase, and by a great deal, as more and wealthier peopleincreasingly inhabit these coastal locations.DOI: 10.1061/共ASCE兲1527-6988共2008兲9:1共29兲CE Database subject headings: Damage; Hurricanes; United States; Economic factors; Population growth; History.IntroductionIn the aftermath of Hurricane Katrina’s devastating economic andhuman toll along the U.S. Gulf Coast, renewed scientific andpolicy attention has focused on hurricanes and their impacts. Thispaper updates and extends work first presented by Pielke andLandsea 共1998兲 and Collins and Lowe 共2001兲 to provide longitudinally consistent estimates of the economic damage that past1Director, Center for Science and Technology Policy Research, Univ.of Colorado, 1333 Grandview Ave., Campus Box 488, Boulder, CO80309-0488. E-mail: pielke@colorado.edu2Modeling Analyst and Meteorologist, ICAT Managers, LLC, 3665Discovery Dr., Suite 300, Boulder, CO 80303. E-mail: jgratz@icat.com3Meteorologist, NOAA/NWS/NCEP/TPC/National Hurricane Center,11691 S.W. 17th St., Miami, FL 33165-2149. E-mail: Chris.Landsea@noaa.gov4Consulting Actuary and Principal, Tillinghast-Towers Perrin, 71 HighHolborn, London WC1V 6TH, U.K. E-mail: doug.collins@towersperrin.com5Professor of Climate Prediction, Dept. of Space and Climate Physics,Benfield UCL Hazard Research Centre, Univ. College London, HolmburySt. Mary, Dorking, Surrey RH5 6NT, U.K. E-mail: mas@mssl.ucl.ac.uk6Senior Actuary, Aon Re Australia Limited, Aon Tower, Lvl 29, 201Kent St., Sydney, Australia. E-mail: rade.musulin@aon.com.auNote. Discussion open until July 1, 2008. Separate discussions mustbe submitted for individual papers. To extend the closing date by onemonth, a written request must be filed with the ASCE Managing Editor.The manuscript for this paper was submitted for review and possiblepublication on November 8, 2006; approved on June 15, 2007. This paperis part of the Natural Hazards Review, Vol. 9, No. 1, February 1, 2008. ASCE, ISSN 1527-6988/2008/1-29–42/ 25.00.storms would have had under contemporary levels of populationand development. The results presented here reinforce the conclusions of the earlier studies and illustrate clearly the effects of thetremendous pace of growth in societal vulnerability to hurricaneimpacts. Such growth in vulnerability is expected to continue forthe foreseeable future, in the United States and around the world,and without effective disaster mitigation efforts, ever-escalatinghurricane damage will be the inevitable result.The paper is organized into four sections: The first describesthe damage data that are used in the analysis and their origins anduncertainties; the second describes the two normalization methodologies; the third discusses the results of the normalizations;and the fourth discusses the significance of the findings and concludes the paper.DataThis study focuses on the total economic damage related to hurricane landfalls along the U.S. Gulf and Atlantic coasts from 1900to 2005. Economic damage is defined as the direct losses associated with a hurricane’s impact as determined in the weeks 共andsometimes months兲 after the event 共Changnon 1996; Downton etal. 2005兲. Indirect damage and longer-term macroeconomic effects are not considered in this analysis. Different methods existfor calculating a disaster’s impacts, which lead to correspondinglydifferent loss estimates for the same event. Our focus is on utilizing a consistent approach over time that allows for a meaningfulnormalization methodology and results that compare “apples toapples.”This paper builds upon work published originally by PielkeNATURAL HAZARDS REVIEW ASCE / FEBRUARY 2008 / 29
and Landsea 共1998兲, which utilized historical economic damagecompiled originally by Landsea 共1991兲 from the Monthly WeatherReview annual hurricane summaries and more recently the stormsummary data archived on the National Hurricane Center 共NHC兲Web site 共NHC 2006b兲. We use loss data from Pielke and Landsea 共1998兲, extended by using NHC loss estimates for 1900–1924and 1998–2005 contained in their storm summaries 共NHC2006a兲. The original loss data are reported in current-year dollars,meaning that damage estimates are presented in dollars of theyear of hurricane landfall.Although this study uses economic loss figures as opposed toinsured losses, official estimates of economic damage have beenin part dependent on insured figures since about 1987. EdwardRappaport, Deputy Director of the National Hurricane Center,said in an e-mail that since he came to the NHC in 1987, thecenter has in many cases worked from a doubling of insured lossestimates to arrive at their estimate of economic damage 共E. Rapaport, personal communication, November 8, 2005兲. Althoughthis practice could have started earlier than 1987, that year is theearliest reference we have for the practice. Our examination of therelationship of insured damages to official NHC totals since 1987indicates that this practice is more of a guideline that is oftenmodified on a storm-by-storm basis, rather than a formulaic application 关see the comparison of insured and total losses reportedin Pielke et al. 共1999兲兴. It should be expected that the relationshipof economic and insured damages would vary, depending on theextent of flooding 共which is an excluded peril on many insurancepolicies兲 and damage to infrastructure and uninsured properties ineach storm.Because damage normalization is a function of the originaldamage estimate, systematic biases in damage collection wouldbe problematic. We find no evidence of such biases in the NHCdamage data set, with one exception. Before 1940, 32 stormsmade landfall with no reported damages in the official government damage data set, whereas only 8 such storms have occurredsince 1940. Given current levels of coastal development, it isimplausible that any hurricane could make landfall today andcause no damage. Hence, prior to 1940 there is an undercount ofdamaging storms. In principle, one could substitute estimates forthe zero-loss storms, based for example, on the relationship between storm intensity and population of affected counties documented for comparable storms in the data set. Our results do notinclude such estimates 关see Collins and Lowe 共2001兲, which utilizes this approach兴.The damage in the historical database includes seven stormswith extensive inland flood damages 共Agnes 1972; Alberto 1994;Diane 1955; Doria 1971; Eloise 1975; Floyd 1999; Frances1998兲. Due to the practical difficulties of distinguishing floodfrom nonflood damages, we have included both in our analysis asreported by the U.S. Government. As a consequence, because theflooding from these storms includes a much wider area than just afew coastal counties affected at landfall, for these seven stormsthe population and housing unit multipliers were expanded toconsider the entire state共s兲 affected by each storm. In each casethis has the effect of maintaining or reducing the normalized adjustment, as population and housing growth have generally beenmore rapid along the desirable coastal counties than averaged foran entire state. In any case, the inclusion of flood damage associated with these seven storms is not a significant factor in interpreting the results of the analysisThere are of course uncertainties in damage estimates. Someinsight on such uncertainties in disaster estimates is provided byDownton and Pielke 共2005兲 and Downton et al. 共2005兲, which30 / NATURAL HAZARDS REVIEW ASCE / FEBRUARY 2008discuss the collection of and errors in the U.S. National WeatherService’s flood damage database, which is kept separately fromthe hurricane loss record. The historical record of flood damage isrelevant because it is collected and reported in the same manneras is hurricane damage and by the same government agency.Downton and Pielke 共2005兲 found that for the largest floods 共i.e.,inflation adjusted to 500 million in 1995 dollars兲, independentestimates 共e.g., between states and the federal government overvarious time periods兲 of damage for the same event differed by asmuch as 40% for events greater than 500 million in losses. However, Downton et al. 共2005兲 suggested that the long-term record offlood damage is of sufficient quality to serve as the basis forlong-term trend analysis as there was no evidence of systematicbiases over time. Thus, we conclude that there are likely to belarge uncertainties in the loss estimates for individual storms, butthere is no evidence of a systematic bias in loss through the dataset. This conclusion is reinforced by normalization results that areconsistent with longitudinal geophysical data on hurricane frequency and intensity at landfall, which has no observed trendsover time.It is also important to mention the uncertainties in the normalized losses that arise from assumptions in the normalizationschemes themselves. Both normalization methods described inthis paper—Pielke/Landsea and Collins/Lowe—rely on nationalwealth data that have been collected systematically by the U.S.Government since 1925. We extrapolate this data set back to 1900to generate estimates of wealth prior to 1925. Varying the assumptions underlying this extrapolation will have a large effecton pre-1925 normalized losses. For instance, assuming an annualaverage increase in pre-1925 wealth of 4% rather than 3% increases normalized loss estimates of the 1900 Galveston storm bymore than 15%.Similarly, the Collins/Lowe methodology requires anassumption-based extrapolation of county-level housing unitsprior to 1940. We therefore recommend that any analysis that usesthe Pielke/Landsea normalized loss estimates prior to 1925 andthe Collins/Lowe normalized loss estimates prior to 1940 recognize the larger uncertainties in the data at these earlier times compared to later periods, which benefit from original wealth andcounty unit housing data. Quantifying the uncertainty rangesaround these normalized loss estimates would require further research that is beyond the scope of this paper. However, in allinstances we sought to use conservative assumptions, i.e., thosethat would err on underestimating historical losses.Normalization MethodologiesPielke and Landsea 共1998兲 used a single approach to adjustingpast storm damage for changing societal conditions. Here wepresent two different approaches to normalize damages, whichresult in broadly consistent results. The two approaches are 共1兲the methodology used by Pielke and Landsea 共1998兲, adjustingfor inflation, wealth, and population updated to 2005, calledPL05; and 共2兲 the methodology used by Collins and Lowe 共2001兲,adjusting for inflation, wealth, and housing units updated to 2005,called CL05. Each approach is described in detail in the followingtwo subsections.Pielke and Landsea „1998 Updated to 2005 „PL05 Pielke and Landsea 共1998兲 estimated the damage that historicalstorms would have caused had they made landfall under contemporary levels of societal development by adjusting historical dam-
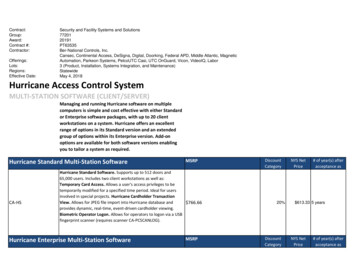
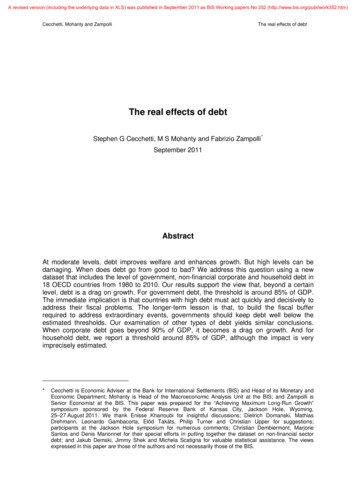
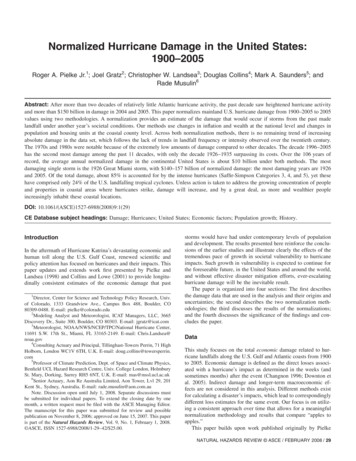
ages by three factors: inflation, wealth, and population. The factors are described below and illustrated with the example ofHurricane Frederic from 1979, which made landfall along theGulf Coast.InflationIn order to adjust for changes in national inflation 共i.e., the decrease in value of a currency over time兲, we use the implicit pricedeflator for gross domestic product 共IPDGDP兲 for the years 1929–2005 from the Bureau of Economic Analysis 共BEA 2006b兲. Forinflation data for 1900–1928 the BEA recommends Johnston andWilliamson 共2006兲 as there are no official government inflationdata during these years 共V. Mannering, personal communication,January 19, 2006兲. From these data, the inflation adjustment is aratio of the 2005 IPDGDP to that in the year in which the stormmade landfall. For example, the 2005 IPDGDP was 112.737 andthat for 1979 was 49.548. Thus, to convert damages expressed in1979 dollars to 2005 dollars requires that 1979 damages be multiplied by 2.275 112.737/ 49.548.Wealth per CapitaThe second adjustment to the economic loss data is to adjust forthe growth in wealth; increasing “wealth” simply means thatpeople have more “stuff” today as compared to the past and thereal value of their “stuff” has in some cases increased. Nationalwealth is captured by the estimate of current-cost net stock offixed assets and consumer durable goods produced each year bythe U.S. Department of Commerce’s Bureau of Economic Analysis 共BEA 2006a兲. Note that Pielke and Landsea 共1998兲 used adifferent metric from the BEA: fixed reproducible tangiblewealth. We use a slightly different metric here because of itsgreater longitudinal availability. Over the period that both metricsare available, they are correlated at 0.9916. Wealth from 1900–1924 was estimated to increase by 3% per year based on thelower of the average annual change in wealth from 1925–2005共6%兲 and from 1925–1928 共3%兲. Because real GDP also increased by approximately 3% per year in 1900–1924, and wealthtypically increases at a faster rate than GDP, our assumption forpre-1924 changes in wealth is exceedingly likely to be conservative 共Johnston and Williamson 2006兲.Because the wealth data are reported in billions of current-yeardollars for the entire nation, we adjust these data for 共1兲 inflation;and 共2兲 population. We disaggregate wealth to a noninflated 共real兲per capita metric in order to allow us to distinguish the independent roles of inflation, wealth, and population in the normalization.For example, wealth in 2005 was 40.99 trillion, and for 1979, 8.91 trillion. The ratio of 2005 to 1979 is 4.599. The inflationmultiplier for 1979 was 2.275, so the inflation-corrected wealthadjustment 共i.e., real wealth兲 for 1979 4.599/ 2.275 2.021. Finally, the U.S. population in 1979 is estimated to be 224,212,417people 共based on a linear interpolation between 1970 and 1980兲.The U.S. population in 2005 was estimated to be 297,777,921共using a linear extrapolation from 1990–2000兲. The U.S. population multiplier is thus the ratio of the 2005 estimate to the 1979estimate, or 1.328, and the final wealth multiplier for 1979 is thereal wealth multiplier of 2.021 divided by the U.S. populationmultiplier of 1.328, which equals 1.522. Therefore each person inthe United States has 共on average兲 1.522 times more wealth in2005 than did each person in 1979.Fig. 1. 2005 Population by county. Galveston/Houston area of Texas,Tampa and Miami area of Florida, and Northeast coastline stand outas areas with high vulnerability due to exceedingly large populations.Affected County PopulationA third adjustment to the economic loss data is for populationchanges in the affected counties for each hurricane or tropicalstorm. The NOAA Coastal Services Center 共2006兲 provides a detailed list of affected counties for each storm from 1900–2002,and using a similar approach we estimated the affected countiesfor storms of 2003–2005. County-level population data for 1900–2000 were obtained from the U.S. Department of Census 关data for1900–1990: U.S. Census 共2000兲, and data from 2000: U.S. Census 共2002兲兴. Census data are reported every 10 years, so linearinterpretation between decades 共extrapolation for 2001–2005兲was used to generate a full population data set for each year in1900–2005. Upon a suggestion in the reviews we examinedwhether a logarithmic interpolation would be more accurate, andwe found no significant improvement in the results.Fig. 1 maps coastal county population for 2005, while Fig. 2shows coastal county population for 1930, 1960, 1990, and 2005.Table 1 contains the coastal counties used to generate Fig. 2. TheNOAA Coastal Services Center defines 174 coastal counties fromTexas to Maine, available by selecting each state from the dropdown menu on their home page and counting the listed counties.This analysis uses 177 counties with small adjustments in NewYork and Virginia. A reviewer notes correctly that intracountydemographic patterns would not be resolved by the county-basedmethodology used here.From the county-level population data, a population multiplierwas calculated based on the ratio of county population in 2005 tothat of the year in which the storm originally made landfall. Forexample, the 1979 storm Frederic affected Baldwin and Mobilecounties in Alabama and Jackson County in Mississippi. The sumof the population for these counties in 2005 is 711,434 comparedto 551,862 in 1979. Thus the population adjustment for the 1979storm Frederic is 711,434/ 551,862 1.289.Putting the Pieces Together: Normalization Example withPL05Using base-year economic damage and the inflation, wealth, andpopulation multipliers, we generate the 2005 normalized damageestimate as follows:NATURAL HAZARDS REVIEW ASCE / FEBRUARY 2008 / 31
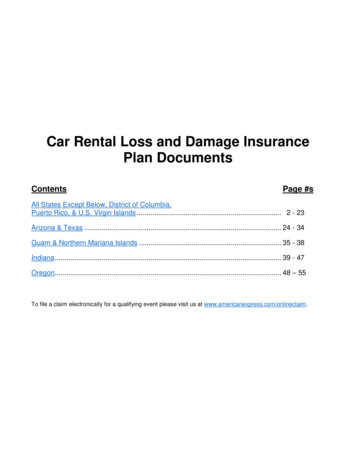
Fig. 2. Coastal county population 1930–2005. Coastal county population has grown rapidly since 1930, especially from the east coast of Floridathrough the Gulf Coast. The population of Harris County, Texas, has grown nearly three times since 1960, with the 2005 population of HarrisCounty equaling the entire 1955 coastal county population from the Florida panhandle northward to South Carolina.D2005 Dy Iy RWPCy P2005/yTable 1. Coastal Counties Used in This StudyStateNumber of counties—NOAANumber of counties—P&LaMaineNew HampshireMassachusettsRhode IslandConnecticutNew YorkNew JerseyDelawareMarylandVirginiaNorth CarolinaSouth 111717174177Note: The 177 coastal counties used to generate Fig. 1. Some small differences exist between our list and that NOAA list due to data availabilityand the use of near-ocean bays and inlets for coastlines.aIn New York, Richmond county was added.bIn Virginia, Hampton City, Newport News City, Norfolk City, Portsmouth City, and Williamsburg City were added. Chesapeake 共no datauntil 1961兲, Virginia Beach 共no data until 1951兲, and Surry wereremoved.32 / NATURAL HAZARDS REVIEW ASCE / FEBRUARY 2008共1兲where D2005 normalized damages in 2005 dollars; Dy reporteddamages in current-year dollars; Iy inflation adjustment;RWPCy real wealth per capita adjustment; and P2005/y coastalcounty population adjustment.As an example, here is how damage from HurricaneFrederic is calculated: Dy 2,300,000,000; Iy 2.275; RWPCy 1.522;andP2005/y 1.289.2005normalizedloss 2,300,000,000共 兲2.275共 兲1.522共 兲1.289 10,267,559,526共this is the actual normalized damage result for Frederic calculated using nonrounded multipliers兲.Frederic caused 2.3 billion in total damage when it madelandfall in 1979. If this same storm were to occur in 2005, itwould cause an estimated 10.3 billion dollars in total damage,under the PL05 approach to normalization.Collins and Lowe „2001 Updated to 2005 „CL05 Several studies suggested that a normalization methodology basedon inflation, wealth, and population could underestimate the magnitude of contemporary losses because in many exposed coastallocations the amount of property at risk to damage has increasedat a rate that exceeds local population growth 共e.g., Collins andLowe 2001; Pielke et al. 1999兲. The Collins and Lowe 共2001兲normalization methodology differs from PL05 in its use of coastalcounty housing units rather than population. The original Collinsand Lowe 共2001兲 methodology also differed in two respects fromthe method used here: normalized damages were based on estimates of insured losses rather than total economic losses, andlosses were allocated to a county based on the damage indicesderived from the ToPCat hurricane model rather than applying thedamage evenly over all affected counties. These changes weremade so that losses could more easily be compared to the Pielkeand Landsea 共1998兲 methodology estimates. The calculation ofCL05 involves the same inflation multiplier as PL05. The wealth
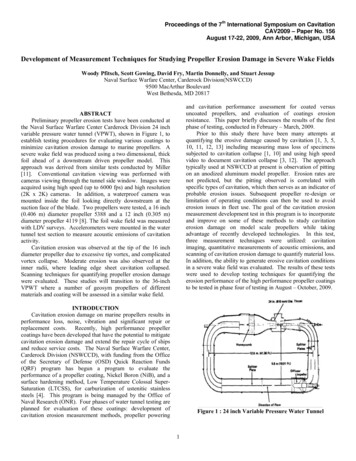
Fig. 3. U.S. Gulf and Atlantic hurricane damage 1900–2005 adjusted for inflation. Total United States tropical cyclone losses adjusted only forinflation to 2005 dollars. Upward trend in damages is clearly evident, but this is misleading since increased wealth, population, and housing unitsare not taken into account.multiplier is different, however, as it corrects for national changesin housing units—rather than population—to determine a changein wealth per housing unit.For example, wealth in 2005 was 40.99 trillion and 8.912trillion in 1979; the ratio of 2005 to 1979 is 4.599. The inflationmultiplier for 1979 was 2.275, so the inflation-corrected wealthadjustment for 1979 4.599/ 2.275 2.021, exactly as in PL05.The number of U.S. housing units in 1979 is estimated to be86,438,040 共based on a linear interpolation of 68,679,030 units in1970 and 88,411,263 in 1980兲. U.S. housing units in 2005 wereestimated to be 122,725,123 共using a linear extrapolation from1990–2000兲. The U.S housing unit multiplier is thus the ratio ofthe 2005 estimate to the 1979 estimate, or 1.420. Thus, the finalwealth multiplier for 1979 is the real wealth multiplier of 2.021divided by the U.S. housing unit multiplier of 1.420, which equals1.424. Therefore each housing unit in the United States contains共on average兲 1.424 times more wealth in 2005 than did each housing unit in 1979.The final multiplier in CL05 is county housing units, and aswith other U.S. Census information, housing unit data are provided by decade, and linear interpolation 共extrapolation兲 providesthe data for all years 1940–2005. Specifically, Joel Gratz updateda spreadsheet of housing unit data compiled by D. Collins forCollins and Lowe 共2001兲 based on U.S. Census 共2006兲. At thetime of our research the census only had this information bycounty by decade in nondigital media 共Bureau of the Census1990兲. Housing units for 1900–1939 were estimated based onextrapolating back in time the county-level relationship of population and housing units from 1940–2005.From the county-level housing unit data, a housing unit multiplier was calculated based on the ratio of county housing units in2005 to that of the year in which the storm originally made landfall. For example, the 1979 storm Frederic affected Baldwin andMobile counties in Alabama and Jackson County in Mississippi.The sum of the housing units for these counties in 2005 is312,749 compared to 201,946 in 1979. Thus the population adjustment for the 1979 storm Frederic is 312, 749/ 201, 946 1.549.The general formula for the CL05 normalized losses isD2005 Dy Iy RWPHUy HU2005/y共2兲where D2005 normalized damages in 2005 dollars; Dy reporteddamages in current-year dollars; Iy inflation adjustment;RWPHUy real wealth per housing unit adjustment; andHU2005/y coastal county housing unit adjustment.As an example, here is how damage from Hurricane Fredericis calculated: Dy 2 , 300, 000, 000; Iy 2.275; RWPHUy 1.424;and HU2005/y 1.549, or 2 , 300, 000, 000共 兲2.275共 兲1.423共 兲1.549 11, 537, 923, 783 共this is the actual normalized damage result for Frederic calculated using nonrounded multipliers兲.Frederic caused 2.3 billion in total damage when it madelandfall in 1979. If this same storm were to have occurred in2005, it would have caused an estimated 11.5 billion in totaldamage under the CL05 approach to normalization.Discussion of Results of NormalizationFig. 3 shows U.S. hurricane damages from 1900–2005 adjustedonly for inflation, showing a clear increase in losses. The darkline represents an 11-year centered moving average. Figs. 4共a–c兲show the summarized and individual results for the two differentapproaches to normalization for the complete data set. The resultsof PL05 and CL05 tend to be very similar, with larger differencesfurther back in time.Further details can be seen in the tables. Table 2 shows the top50 damaging events, ranked by PL05, along with the corresponding ranking of CL05. Under both approaches, the 1926 GreatMiami hurricane is estimated to result in the largest losses at 140billion– 157 billion. Hurricane Katrina is second under bothnormalization schemes. The years 2004 and 2005 stand out asparticularly extreme, with 7 of the top 30 most damaging 共normalized兲 storms over 106 years. No other 2-year period has morethan 3 top 30 storms 共1944–1945兲. Of particular note is the rapidincrease in estimated damage for historical storms as compared toPielke and Landsea, who, for instance, estimated that the 1926NATURAL HAZARDS REVIEW ASCE / FEBRUARY 2008 / 33
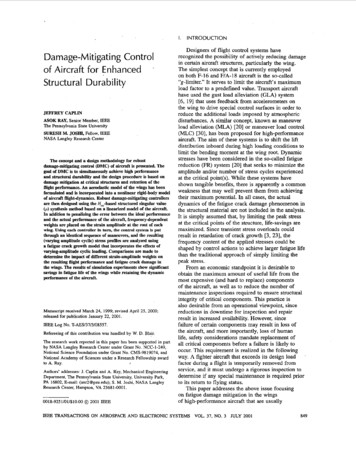
expected to double roughly every 10 years because of increases in construction costs, increases in the number ofstructures and changes in their characteristics. AIR’s research shows that, because of exposure growth, the one inone-hundred-year industry loss grew from 60 billion in1995 to 110 billion in 2005, and it will likely grow toover 200 billion during the next 10 years.Note that the numbers above are estimates of insured damages, asopposed to total economic damages.Table 3 shows normalized damages for each of the three approaches by month over 1900–2005. While PL05 and CL05 differby about 2% over the entire period, the monthly distribution ofdamages is almost identical in both cases, with August andSeptember accounting for approximately 85% of normalizeddamages. September alone accounts for greater than 50% of normalized damages. October has approximately 10% of normalizeddamages, and the other months much smaller amounts. Of note,June has 40% more normalized damages than does July. Thissomewhat surprising result is primarily due to Agnes 共June 1972兲,which was mainly a flood event, being by far the largest normalized storm in these months.Table 4 shows normalized damages by decade for bothapproaches. The decade 1996–2005 has the second-highest normalized damage compared to any other such period. While 1996–2005 is similar to 1926–1935, the table also underscores howanomalously benign the 1970s and 1980s were in comparison tothe rest of the record, with about 5% of the data set total damagesin each decade. Decadal totals are dominated by the effects of asingle or several individual storms. For instance, 70% of the1926–1935 damage total comes from the 1926 Miami hurricane,and about 40% of the 1996–2005 total comes from Katrina.Table 5 shows damage for each approach to normalization bySaffir-Simpson category at the time of hurricane landfall. Thenormalizations each indicate that storms of Category 3 or strongerare responsible for more than 85% of the total normalized damages. PL05 and CL05 indicate a similar distribution and magnitude of normalized damages by category, but with only threeCategory 5 landfalls, little can be said with specificity about therelative effects of a Category 5 impact beyond the observationthat its impacts in any situation will be huge. Table 6 showsdamage by different populations inhabiting the coastal countiesdirectly affected by the storm and illustrates the large sensitivityof damage to population of the affected area.Fig. 4. U.S. Gulf and Atlantic damage, 1900–2005, normalized: 共a兲total U.S. tropical cyclone losses normalized with both schemes; 共b兲only the PL05 methodology; and 共c兲 only the CL05 methodology.Both schemes present very similar results though PL05 focuses onpopulation change, whereas CL05 focuses on changes in housingunits. Although the 2004 and 2005 seasons produced high losses,these years are not unprecedented when considering normalizedlosses since 1900.Great Miami hurricane would have resulted in 72.3 billion in1995 共in 1995 dollars兲. Normalized to 2005, the estimate jumps to 157 billion, which is consistent with independent analyses thathave found in some locations that losses are doubling every10 years 共e.g., ABI 2005兲. According to one current report共“Sound” 2006兲. . . analyses by ISO’s catastrophe modeling subsidiary,AIR Worldwide, indicate that catastrophe losses should be34 / NATURAL HAZARDS REVIEW ASCE / FEBRUARY 2008Lack of Trends in the DataPielke and Landsea 共1998兲 found no trends in normalized losses,a finding subsequently replicated by Katz 共2002兲. Recent analysesof longitudinal geophysical data find that there are no trends onhurricane frequency and intensity at U.S. landfall 共Landsea 2005,2007; Emanuel 2005兲. Because the normalization methodology i
fects are not considered in this analysis. Different methods exist for calculating a disaster’s impacts, which lead to correspondingly different loss estimates for the same event. Our focus is on utiliz-ing a consistent approach over time that allows for a meaningful normalization