Transcription
A revised version (including the underlying data in XLS) was published in September 2011 as BIS Working papers No 352 (http://www.bis.org/publ/work352.htm)Cecchetti, Mohanty and ZampolliThe real effects of debtThe real effects of debtStephen G Cecchetti, M S Mohanty and Fabrizio Zampolli *September 2011AbstractAt moderate levels, debt improves welfare and enhances growth. But high levels can bedamaging. When does debt go from good to bad? We address this question using a newdataset that includes the level of government, non-financial corporate and household debt in18 OECD countries from 1980 to 2010. Our results support the view that, beyond a certainlevel, debt is a drag on growth. For government debt, the threshold is around 85% of GDP.The immediate implication is that countries with high debt must act quickly and decisively toaddress their fiscal problems. The longer-term lesson is that, to build the fiscal bufferrequired to address extraordinary events, governments should keep debt well below theestimated thresholds. Our examination of other types of debt yields similar conclusions.When corporate debt goes beyond 90% of GDP, it becomes a drag on growth. And forhousehold debt, we report a threshold around 85% of GDP, although the impact is veryimprecisely estimated.*Cecchetti is Economic Adviser at the Bank for International Settlements (BIS) and Head of its Monetary andEconomic Department; Mohanty is Head of the Macroeconomic Analysis Unit at the BIS; and Zampolli isSenior Economist at the BIS. This paper was prepared for the “Achieving Maximum Long-Run Growth”symposium sponsored by the Federal Reserve Bank of Kansas City, Jackson Hole, Wyoming,25–27 August 2011. We thank Enisse Kharroubi for insightful discussions; Dietrich Domanski, MathiasDrehmann, Leonardo Gambacorta, Előd Takáts, Philip Turner and Christian Upper for suggestions;participants at the Jackson Hole symposium for numerous comments; Christian Dembiermont, MarjorieSantos and Denis Marionnet for their special efforts in putting together the dataset on non-financial sectordebt; and Jakub Demski, Jimmy Shek and Michela Scatigna for valuable statistical assistance. The viewsexpressed in this paper are those of the authors and not necessarily those of the BIS.
A revised version (including the underlying data in XLS) was published in September 2011 as BIS Working papers No 352 (http://www.bis.org/publ/work352.htm)Cecchetti, Mohanty and ZampolliThe real effects of debt1. IntroductionDebt is a two-edged sword. Used wisely and in moderation, it clearly improves welfare. But,when it is used imprudently and in excess, the result can be disaster. For individualhouseholds and firms, overborrowing leads to bankruptcy and financial ruin. For a country,too much debt impairs the government’s ability to deliver essential services to its citizens.High and rising debt is a source of justifiable concern. We have seen this recently, as firstprivate and now public debt have been at the centre of the crisis that began four years ago.Data bear out these concerns – and suggest a need to look comprehensively at all forms ofnon-financial debt: household and corporate, as well as government. Over the past 30 years,summing these three sectors together, the ratio of debt to GDP in advanced economies hasrisen relentlessly from 167% in 1980 to 314% today, or by an average of more than5 percentage points of GDP per year over the last three decades. Given current policies anddemographics, it is difficult to see this trend reversing any time soon. Should we be worried?What are the real consequences of such rapid increase in debt levels? When does itsadverse impact bite?Finance is one of the building blocks of modern society, spurring economies to grow. Withoutfinance and without debt, countries are poor and stay poor. When they can borrow and save,individuals can consume even without current income. With debt, businesses can investwhen their sales would otherwise not allow it. And, when they are able to borrow, fiscalauthorities can play their role in stabilising the macroeconomy. But, history teaches us thatborrowing can create vulnerabilities. When debt ratios rise beyond a certain level, financialcrises become both more likely and more severe (Reinhart and Rogoff (2009)). This stronglysuggests that there is a sense in which debt can become excessive. But when?We take an empirical approach to this question. Using a new dataset on debt levels in 18OECD countries from 1980 to 2010 (based primarily on flow of funds data), we examine theimpact of debt on economic growth. Our data allow us to look at the impact of household,non-financial corporate and government debt separately. 1 Using variation across countriesand over time, we examine the impact of the movement in debt on growth. 2Our results support the view that, beyond a certain level, debt is bad for growth. Forgovernment debt, the number is about 85% of GDP. For corporate debt, the threshold iscloser to 90%. And for household debt, we report a threshold of around 85% of GDP,although the impact is very imprecisely estimated.Our result for government debt has the immediate implication that highly indebtedgovernments should aim not only at stabilising their debt but also at reducing it to sufficientlylow levels that do not retard growth. Prudence dictates that governments should also aim tokeep their debt well below the estimated thresholds so that even extraordinary events areunlikely to push their debt to levels that become damaging to growth.1Flow of funds data should provide a more accurate picture of indebtedness than bank credit data, whichexclude several forms of debt including securitised debt, corporate bonds and trade credit. The difference islikely to matter in countries such as the United States, where a large fraction of credit is granted by non-bankintermediaries.2Recent empirical studies of the effect of public debt on growth using panel data include Checherita and Rother(2010) and Kumar and Woo (2010). Unlike these studies, ours investigates the impact on growth of householdand non-financial corporate debt too.1/34
A revised version (including the underlying data in XLS) was published in September 2011 as BIS Working papers No 352 (http://www.bis.org/publ/work352.htm)Cecchetti, Mohanty and ZampolliThe real effects of debtTaking a longer-term perspective, reducing debt to lower levels represents a severe test forthe advanced economies. Here, the challenge is compounded by unfavourabledemographics. Ageing populations and rising dependency ratios have the potential to slowgrowth as well, making it even more difficult to escape the negative debt dynamics that arenow looming.The remainder of the paper is organised in four sections. In Section 2, we discuss why webelieve that high levels of debt create volatility and are bad for growth. Formal models of thisphenomenon are still at very early stages, so all we can offer is some intuition. We go on, inSection 3, to a preliminary examination of the data and the main facts about the build-up ofnon-financial sector debt in advanced economies. Section 4 contains our main empiricalresults. These are based on a series of standard growth regressions, augmented withinformation about debt levels. It is here that we report our estimates of the thresholds beyondwhich debt becomes a drag on growth. Section 5 discusses these results in the context ofthe inescapable demographic trends. Section 6 concludes.2. Why debt mattersFor a macroeconomist working to construct a theoretical structure for understanding theeconomy as a whole, debt is either trivial or intractable. Trivial because (in a closedeconomy) it is net zero – the liabilities of all borrowers always exactly match the assets of alllenders. Intractable because a full understanding of debt means grappling with a world inwhich the choice between debt and equity matters in some fundamental way. That meansconfronting, among other things, the intrinsic differences between borrowers and lenders;non-linearities, discontinuities, and constraints in which bankruptcy and limits on borrowingare key; taxes, where interest paid to lenders is treated differently from dividends paid toshareholders; differences between types of borrowers, so household, corporate andgovernment debt are treated separately; and externalities, since there are times whenfinancial actors do not bear (or are able to avoid) the full costs of their actions.As modern macroeconomics developed over the last half-century, most people either ignoredor finessed the issue of debt. With few exceptions, the focus was on a real economic systemin which nominal variables – prices or wages, and sometimes both – were costly to adjust.The result, brought together brilliantly by Michael Woodford in his 2003 book, is a logicalframework where economic welfare depends on the ability of a central bank to stabiliseinflation using its short-term nominal interest rate tool. Money, both in the form of themonetary base controlled by the central bank and as the liabilities of the banking system, is apassive by-product. With no active role for money, integrating credit in the mainstreamframework has proven to be difficult. 3Yet, as the mainstream was building and embracing the New Keynesian orthodoxy, therewas a nagging concern that something had been missing from the models. On the fringewere theoretical papers in which debt plays a key role, and empirical papers concluding thatthe quantity of debt makes a difference. 4 The latest crisis has revealed the deficiencies of themainstream approach and the value of joining those once seen as inhabiting the margin.In response to the challenge, macroeconomists are now working feverishly to put financialstability policy on the same theoretical footing that exists for conventional monetary policy.3Indeed, there has been little significant progress in modelling financial frictions and credit since the model ofthe financial accelerator of Bernanke et al (1999).4See eg Friedman (1987), Kiyotaki and Moore (1997) and Borio et al (2001).2/34
A revised version (including the underlying data in XLS) was published in September 2011 as BIS Working papers No 352 (http://www.bis.org/publ/work352.htm)Cecchetti, Mohanty and ZampolliThe real effects of debtThey are working not only to understand the sources of systemic risk, but also on how tomeasure it and mitigate it. 5 That means writing down models in which debt truly matters andworking through the implications.Like a cancer victim who cannot wait for scientists to find a cure, policymakers cannot waitfor academics to deliver the synthesis that will ultimately come. Instead, authorities must dothe best they can with the knowledge they have. As they make their day-to-day policydecisions, central bankers, regulators and supervisors need some understanding of the roleof debt in the economy. When is debt excessive? When should we worry about its level,growth rate and composition?Starting with the basics, once one begins thinking about fixed non-state-contingentobligations – bonds, loans and the like – things get very complicated very fast. Why are loansand bonds by far the most prevalent mechanism for shifting resources over time? Why aren’trisks shared more equally among the various parties? And, when investors finance a boom,why is it exclusively through this contractual form? The answers to these very importantquestions are probably related to information asymmetries and tax treatment. 6 But ratherthan getting bogged down, we simply note that the basic form of debt has remainedremarkably constant both over history and across countries, empires and legal systems.As for its uses, borrowing allows individuals to smooth their consumption in the face of avariable income. It allows corporations to smooth investment and production in the face ofvariable sales. It allows governments to smooth taxes in the face of variable expenditures. 7And it improves the efficiency of capital allocation across its various possible uses in theeconomy. At least in principle, it should also shift risk to those most able to bear it.And public debt, in particular, can help smooth consumption not only through the lifetime ofindividuals who are currently alive, but also across generations. To the extent that futuregenerations will be richer than the current ones – because they will have a combination ofmore human capital and more productive technology – a transfer from future to currentgenerations can raise society’s intertemporal welfare. 8 Since part of the tax rise needed tofund higher current consumption is postponed, public debt may rise, at least up to a point,without growth necessarily slowing. Furthermore, government debt also provides liquidityservices, which can contribute to easing the credit conditions faced by firms and households,thus crowding in private investment. 9For all these reasons, financial deepening and rising debt go hand in hand withimprovements in economic well-being. 10 Without debt, economies cannot grow andmacroeconomic volatility would also be greater than desirable. 115A prominent recent example is Woodford (2011).6For a discussion of the basics of information asymmetries, see Cecchetti and Schoenholtz (2011). On taxes,see Myers (2001).7See Barro (1979).8See Cukierman and Meltzer (1989) for a formal model in which agents cannot leave negative bequests to theirchildren on their own, so they vote to raise public debt. The argument in favour of a backwardintergenerational transfer is strengthened if part of government debt is financing investment that will benefitfuture generations. However, it is important to note that the model in Cukierman and Meltzer (1989) isdeterministic: agents who maximise their as well as their offspring’s welfare know with certainty what theirfuture income will be. In reality, the risk that future generations’ income might turn out less than expectedshould play an important role in restraining the rise in government debt.9See Woodford (1990).10Arguably, an increase in government debt may not necessarily be welfare-improving. Part of the observedincrease in public debt in industrial countries can also be ascribed to the common revenue pool problem:those members of society that benefit from additional spending are not the same as those bearing the extra3/34
A revised version (including the underlying data in XLS) was published in September 2011 as BIS Working papers No 352 (http://www.bis.org/publ/work352.htm)Cecchetti, Mohanty and ZampolliThe real effects of debtBut financial development is not some magic potion. The accumulation of debt involves risk.As debt levels increase, borrowers’ ability to repay becomes progressively more sensitive todrops in income and sales as well as increases in interest rates. For a given shock, thehigher debt, the higher is the probability of defaulting. Even for a mild shock, highly indebtedborrowers may suddenly no longer be regarded as creditworthy. And when lenders stoplending, consumption and investment fall. If the downturn is bad enough, defaults, deficientdemand and high unemployment might be the grim result. The higher the level of debt, thebigger the drop for a given size of shock to the economy. And the bigger the drop inaggregate activity, the higher the probability that borrowers will not be able to makepayments on their non-state-contingent debt. In other words, higher nominal debt raises realvolatility, increases financial fragility and reduces average growth. 12Hence, instead of high, stable growth with low, stable inflation, debt can mean disruptivefinancial cycles in which economies alternate between credit-fuelled booms and defaultdriven busts. And, when the busts are deep enough, the financial system collapses, takingthe real economy with it.In principle, as highly indebted borrowers stop spending, less indebted borrowers or lenderscould take up the slack. For example, wealthy households could purchase goods at reducedprices and cash-rich firms could invest at improved expected return. But they need not. AsEggertson and Krugman (2011) point out, it is the asymmetry between those who are highlyindebted and those who are not that leads to a decline in aggregate demand. Those authorssuggest that, in order to avoid high unemployment and deflation, the public sector shouldborrow to fill the spending gap left by private sector borrowers as the latter repair theirbalance sheets. 13But, while the argument put forward by Eggertson and Krugman (2011) is correct in principle,even the capacity of the public sector to borrow is not unlimited. When a crisis strikes, theability of the government to intervene depends on the amount of debt that it has alreadyaccumulated as well as what its creditors perceive to be its fiscal capacity that is, thecapacity to raise tax revenues to service and repay the debt. Fiscal authorities may becomeconstrained both in their attempt to engage in traditional countercyclical stabilisation policiesand in their role as lender of last resort during a financial crisis. 14 That is, high levels of publicdebt can limit essential government functions. 15cost of funding it. Even so, to the extent that costly tax increases are postponed, the increase in governmentdebt may, up to a point, not have an immediate negative impact on growth. (For an overview of the commonrevenue pool problem, see eg Eichengreen et al (2011).)11See the survey in Levine (2005).12See Bernanke and Gertler (1990) for an early example of a full general equilibrium model based on thisintuition.13Despite the lack of satisfactory formal models, central banks have been aware for some time of theimportance of the distribution of debt and wealth across the economy, both for the conduct of monetary policyand for its financial stability implications. For an examination of the role of the distribution of household debt inthe United States, see eg Dynan and Kohn (2007); and for a discussion of the role of household debt in theUnited Kingdom, see eg Benito et al (2007) and Waldron and Zampolli (2010b).14Aghion et al (2011) find evidence that industries that rely more heavily on external finance or hold less tangibleassets tend to grow faster in OECD countries that implement more countercyclical fiscal policies.15When examining the effects of the stock of debt on growth, it is also important to consider the potentialinteraction between the stock and flow of credit. The burden of debt and the risks associated with it depend onthe stock of accumulated debt. Knowing this, both lenders and borrowers may begin to restrain the future flowof credit after the stock of debt has passed some critical point. A diminished flow of credit may, in turn, hampergrowth.4/34
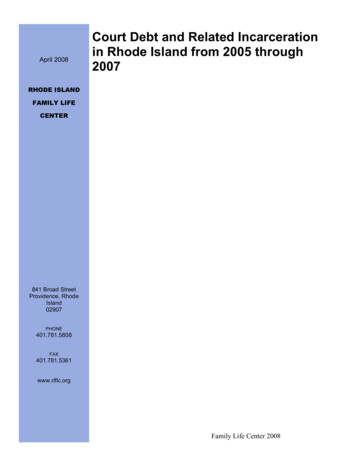
A revised version (including the underlying data in XLS) was published in September 2011 as BIS Working papers No 352 (http://www.bis.org/publ/work352.htm)Cecchetti, Mohanty and ZampolliThe real effects of debtIt is important to note that there is a clear interaction between public and private debt. As wehave seen during the recent crisis, when private borrowing has fiscal backing, defaultincreases public debt. And the ability of the public sector to sustain a given level of debtdepends on its ability to raise revenue or its fiscal capacity – something that could becomecompromised if the private sector is already highly indebted.Our conclusion is that, at low levels, debt is good. It is a source of economic growth andstability. But, at high levels, private and public debt are bad, increasing volatility and retardinggrowth. It is in this sense that borrowing can first be beneficial, so long as it is modest. Butbeyond a certain point, debt becomes dangerous and excessive. We now turn to adescription of trends in industrial country debt before moving to the empirical analysis, inwhich we look for the turning point.3. Rising debt: a preliminary examinationThe past three decades have witnessed a remarkable rise in advanced countryindebtedness. In this section, we briefly review trends in household, non-financial corporateand government debt. In what follows, we will refer to the total combined debt of these threesectors as the total non-financial debt. 16Trends in aggregate non-financial sector debtGraph 1 shows the aggregate non-financial sector debt of advanced economies and itscomposition since 1980. 17 Two facts stand out: first, total non-financial debt as a percentageof GDP, as well as its sectoral components, have been rising steadily for much of the pastthree decades (left-hand panel). Starting at a relatively modest 167% of GDP three decadesago, total non-financial debt has reached 314% of GDP. Of this increase, governmentsaccount for 49 percentage points, corporates for 42 percentage points, and households forthe remaining 56 percentage points.The right-hand panel of Graph 1 shows an index of debt adjusted for inflation, offering aslightly different perspective of debt evolution. Even adjusting for inflation does not changethe message: real corporate debt has risen by a factor of roughly 3 (an average annualcompounded growth rate of 3.8%); government debt by about 4½ times (5.1% annual rate);and household debt by 6 times (6.2% annual rate). Overall, real debt of the non-financialsector in advanced economies has been growing steadily at a rate of slightly less than4½% for the past 30 years.What these panels show is that the surge in non-financial debt preceding the recent crisis isnot a new phenomenon. It is merely the continuation of a trend that was ongoing over theentire period for which we have been able to assemble comprehensive data – a trend thatwas also accompanied by significant changes in composition.16Ideally, we would prefer to measure either a stock relative to a stock or a flow divided by a flow. The former, aconventional measure of leverage like the ratio of total assets to debt, would require data on assets. And thelatter, like a measure of debt burden to income, would require us to have data on debt servicing.Unfortunately, the limits of available data precluded both of these approaches.17In what follows, we use the public sector to refer to the “general government” sector, and the private sectorcorresponds to “non-financial corporations” and “households”. As a consequence, non-financial corporatesector debt includes the debt of public non-financial corporations, which are controlled by governments but aremarket producers. Household debt includes debt of non-profit institutions serving households. See Appendix 1for more details.5/34
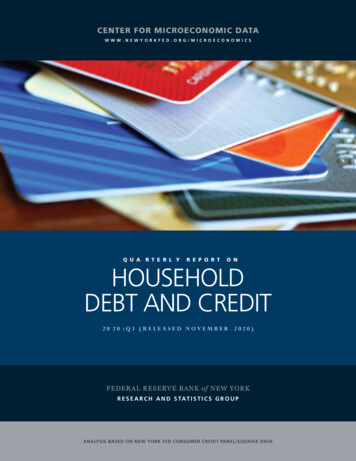
A revised version (including the underlying data in XLS) was published in September 2011 as BIS Working papers No 352 (http://www.bis.org/publ/work352.htm)Cecchetti, Mohanty and ZampolliThe real effects of debtGraph 1Non-financial sector debtAs a percentage of GDP1Real levels, deflated by consumer prices2TotalGovernmentPrivate 30300802003019851199019952000Simple averages for 18 OECD economies.United States.200522009100198519901995200020052009Rebased to 1980 100; simple average of 16 OECD economies, including theAs shown in Graph 1, from 1995 to the middle of the last decade, public debt had beenrelatively stable as a percentage of GDP. But this period of relative public sector restraintwas accompanied by a rapid rise in household and non-financial corporate debt. The righthand panel of Graph 1 makes the rather stark point that real household debt tripled between1995 and 2010, dwarfing the accumulation of debt in other sectors of the economy.Table 1 provides a country breakdown of the simple and GDP-weighted averages plotted inGraph 1. 18 These data show that the build-up of total non-financial debt is not a developmentconfined to a few large economies. Instead, it is a common feature across the 18 countries inour sample. Total non-financial debt now exceeds 450% of GDP in Japan, 350% in Belgium,Portugal and Spain, and 300% in two thirds of the countries.Although countries share a similar upward trend in total debt, there are differences. In manyEuropean ones, corporate debt makes up more than 40% of the total. (In Belgium, Finland,Norway, Spain and Sweden, corporate debt is more than half of the total non-financial debt.)In others, households account for the largest share. Australia, Denmark and the Netherlandsare examples. While in Japan, Italy and Greece, it is public debt that is dominant. Our senseis that both the level and composition of debt should matter for growth, something weexamine below.One clear limitation of our dataset is that it starts in 1980. It is sufficient, however, to lookback at the history of the United States (for which long back data are easily available) tounderstand how extraordinary the developments over the last 30 years have been. AsGraph 2 shows, the US non-financial debt-to-GDP ratio was steady at around 150% from theearly 1950s until the mid-1980s. In some periods, public debt was high, but then private debtwas low; while in others it was the reverse. 19 Since the mid-1980s, however, both public andprivate debt have been moving up together.18Appendix 2 contains tables reporting a breakdown of total non-financial debt into its components: government,non-financial corporate and household.19See Friedman (1981 and 1986) for a discussion.6/34
A revised version (including the underlying data in XLS) was published in September 2011 as BIS Working papers No 352 (http://www.bis.org/publ/work352.htm)Cecchetti, Mohanty and ZampolliThe real effects of debtTable 1Household, corporate and government debtas a percentage of nominal 20002000–10United StatesJapanGermanyUnited landsNorwayPortugalSpainSwedenTotal of �21570110703149325877486733781159721MedianWeighted average3Simple averageG7Other advancedMemo: Std 15955611Some figures refer to 2009.2In percentage points of GDP.3Based on 2005 GDP and PPP exchange rates.Sources: OECD; national data, authors’ estimates.Graph 2Outstanding debt of US non-financial borrowersAs a percentage of um of federal government and state and local governments.198021990200002010Sum of household and non-financial business.Sources: Board of Governors of the Federal Reserve System; Friedman (1981).Why has debt been rising so steadily?What can then explain the trend in non-financial debt in advanced economies? Therelentless accumulation of non-financial debt has coincided with some important institutional7/34
A revised version (including the underlying data in XLS) was published in September 2011 as BIS Working papers No 352 (http://www.bis.org/publ/work352.htm)Cecchetti, Mohanty and ZampolliThe real effects of debtand market developments. First, from the late 1970s onwards, restrictions on financialmarket activity and lending had been progressively and systematically removed, increasingopportunities to borrow. Combined with improvements in financial theory and informationtechnology, this liberalisation has led to an intensification of financial innovation. The abilityto price complex financial products is indeed a prerequisite for fabricating and selling them.Second, starting in the mid-1980s and continuing until the start of the recent crisis, themacroeconomic environment had grown more stable. The Great Moderation brought lowerunemployment rates, lower inflation rates and less uncertainty. Believing the world to be asafer place, borrowers borrowed more, lenders lent more – and inflation remained low. Therewas also a likely feedback here: as financial innovation improved the stability of credit supplyand allowed risk to flow to those best able to bear it, it improved general economic stability. 20Third, since the mid-1990s, the substantial decline in real interest rates has made it easier tosupport ever higher levels of debt. 21 The reasons behind such reduction are controversial.The most prominent hypothesis is that low long-term interest rates are a consequence of ahigh preference for saving in emerging markets – a preference that arose for a variety ofreasons, including a poor social safety net, ageing populations’ retirement needs, and adesire for insurance after the East Asian financial crisis of the late 1990s. 22Finally, tax policies may have played a role, if not in explaining the rapid rise in debt, at leastin making the level of debt higher than it would have been otherwise. 23 For instance, thepreferential treatment of interest payments encourages firms to issue debt – a factor thatcould be behind the rising corporate indebtedness we see in some countries. It may also playa role in the rise in household debt, where generous tax relief for mortgage interestpayments, along with explicit subsidies and implicit guarantees, could have played a role inexpanding home ownership in some places. 24Regardless of the cause, the consequences are clear. Over the past 30 years, debt has risenrelentlessly across the industrial world. Looking at the simple average, total non-financialdebt rose by 147 percentage points of GDP from 1980 to 2010. Of this, 38% (56 percentagepoints) was accounted for by households, 29% (42 percentage points) was a consequence of20See Cecchetti et al (2005) for a summary of factors that accounted for the Great Moderation. Dynan et al(2006) focus on the role of financial innovation.21Waldron and Zampolli (2010a) investigate the effect of demographic changes and of a reduction in the realin
financial actors do not bear (or are able to avoid) the full costs of their actions. As modern macroeconomics developed over the last half-century, most people either ignored or finessed the issue of debt. Wit