Transcription
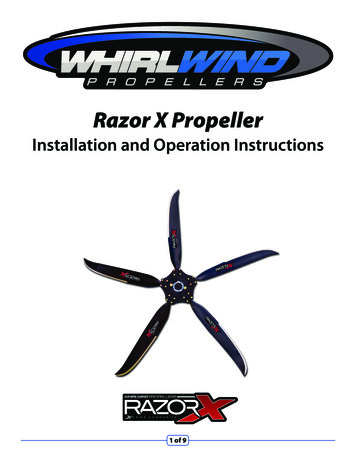
Proceedings of the 7th International Symposium on CavitationCAV2009 – Paper No. 156August 17-22, 2009, Ann Arbor, Michigan, USADevelopment of Measurement Techniques for Studying Propeller Erosion Damage in Severe Wake FieldsWoody Pfitsch, Scott Gowing, David Fry, Martin Donnelly, and Stuart JessupNaval Surface Warfare Center, Carderock Division(NSWCCD)9500 MacArthur BoulevardWest Bethesda, MD 20817and cavitation performance assessment for coated versusuncoated propellers, and evaluation of coatings erosionresistance. This paper briefly discusses the results of the firstphase of testing, conducted in February – March, 2009.Prior to this study there have been many attempts atquantifying the erosive damage caused by cavitation [1, 3, 5,10, 11, 12, 13] including measuring mass loss of specimenssubjected to cavitation collapse [1, 10] and using high speedvideo to document cavitation collapse [3, 12]. The approachtypically used at NSWCCD at present is observation of pittingon an anodized aluminum model propeller. Erosion rates arenot predicted, but the pitting observed is correlated withspecific types of cavitation, which then serves as an indicator ofprobable erosion issues. Subsequent propeller re-design orlimitation of operating conditions can then be used to avoiderosion issues in fleet use. The goal of the cavitation erosionmeasurement development test in this program is to incorporateand improve on some of these methods to study cavitationerosion damage on model scale propellers while takingadvantage of recently developed technologies. In this test,three measurement techniques were utilized: cavitationimaging, quantitative measurements of acoustic emissions, andscanning of cavitation erosion damage to quantify material loss.In addition, the ability to generate erosive cavitation conditionsin a severe wake field was evaluated. The results of these testswere used to develop testing techniques for quantifying theerosion performance of the high performance propeller coatingsto be tested in phase four of testing in August – October, 2009.ABSTRACTPreliminary propeller erosion tests have been conducted atthe Naval Surface Warfare Center Carderock Division 24 inchvariable pressure water tunnel (VPWT), shown in Figure 1, toestablish testing procedures for evaluating various coatings tominimize cavitation erosion damage to marine propellers. Asevere wake field was produced using a two dimensional, thickfoil ahead of a downstream driven propeller model. Thisapproach was derived from similar tests conducted by Miller[11]. Conventional cavitation viewing was performed withcameras viewing through the tunnel side window. Images wereacquired using high speed (up to 6000 fps) and high resolution(2K x 2K) cameras. In addition, a waterproof camera wasmounted inside the foil looking directly downstream at thesuction face of the blade. Two propellers were tested, a 16 inch(0.406 m) diameter propeller 5388 and a 12 inch (0.305 m)diameter propeller 4119 [8]. The foil wake field was measuredwith LDV surveys. Accelerometers were mounted in the watertunnel test section to measure acoustic emissions of cavitationactivity.Cavitation erosion was observed at the tip of the 16 inchdiameter propeller due to excessive tip vortex, and complicatedvortex collapse. Moderate erosion was also observed at theinner radii, where leading edge sheet cavitation collapsed.Scanning techniques for quantifying propeller erosion damagewere evaluated. These studies will transition to the 36-inchVPWT where a number of geosym propellers of differentmaterials and coating will be assessed in a similar wake field.INTRODUCTIONCavitation erosion damage on marine propellers results inperformance loss, noise, vibration and significant repair orreplacement costs. Recently, high performance propellercoatings have been developed that have the potential to mitigatecavitation erosion damage and extend the repair cycle of shipsand reduce service costs. The Naval Surface Warfare Center,Carderock Division (NSWCCD), with funding from the Officeof the Secretary of Defense (OSD) Quick Reaction Funds(QRF) program has begun a program to evaluate theperformance of a propeller coating, Nickel Boron (NiB), and asurface hardening method, Low Temperature Colossal SuperSaturation (LTCSS), for carburization of ustenitic stainlesssteels [4]. This program is being managed by the Office ofNaval Research (ONR). Four phases of water tunnel testing areplanned for evaluation of these coatings: development ofcavitation erosion measurement methods, propeller poweringFigure 1 : 24 inch Variable Pressure Water Tunnel1
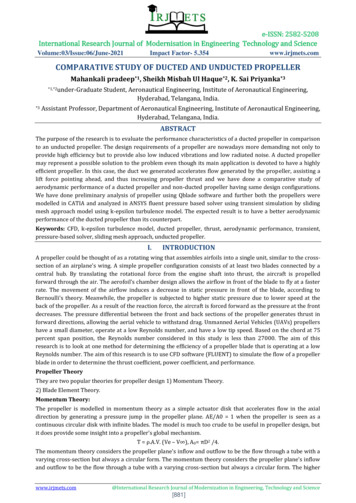
24" VPWTTEST SECTIONCONTRACTIONFLOWDIRECTIONWake MeasurementPrior to propeller installation, the wake field was surveyedusing a laser Doppler velocimetry (LDV) system as shown inFigure 3. The LDV system consisted of a TSI model 9832 fiberoptic 3.25 inch (82.6 mm) diameter probe mounted rigidly to amotorized traverse which could translate the measurement pointvertically and transversely across the test section. The traversesystem was manually re-located at four transverse planesaxially separated by 0.984 inches (25mm). The probe utilizedthe green (514.5nm) and blue (488nm) colors of an argon ionlaser to measure axial and vertical velocity componentsrespectively. The fiber optic probe was translated within a 12inch (305 mm) diameter insert mounted in a test sectionwindow. The insert allowed the probe to be positioned towithin 13.8 inches (350 mm) of the tunnel centerline.Most measurements were made with a 470 mm (in water)lens that could measure one side of the test section and up to 2.75 inches (70 mm) past the tunnel centerline. Themeasurement volume was 0.003 by 0.051 inches (0.07 by 1.3mm). A second longer focal length lens allowed measurementstransversely across the entire test section. This measurementvolume was 0.004 by 0.075 inches (0.10 by 1.9 mm). Thewindow insert limited the vertical range of measurements to /3.93 inches (100 mm) above and below the tunnel centerline.Doppler signals were analyzed with a TSI Model IFA 655Digital Burst Correlator. Velocity measurements were collectedover a 15 second period in non-coincident mode. Totalmeasurements at each location varied by position and velocitycomponent, but generally ranged between 5,000 and 50,000.The flow was seeded with silver coated glass spheres with asize range between 2 and 10 microns and a specific gravity of2.8.SUBMERSIBLECAMERA MOUNT& EXTERNALCAMERA MIRRORACCESSSEVERE WAKEGENERATION FOILFigure 2: 24 Inch VPWT severe wake field setupEXPERIMENTAL SET UPWater TunnelThis test was performed in the David Taylor 24 inchVariable Pressure Water Tunnel (24-in. VPWT) at NSWCCD.This tunnel is a vertical loop, re-circulating design withupstream and downstream propeller drives and a test speedcapability of 30 knots (15.4 m/s). The tunnel is shown inFigure 1. The test was performed in the 24 inch (0.610 m)diameter open-jet test section using the 150 HP (112 kW)downstream drive to power the propeller. The static pressure inthe test section can be varied from vacuum to 1 atm (101 kPa)positive pressure to model various cavitation conditions.Tunnel velocity, test section pressure, and propeller rpmwere recorded for all conditions. The reference velocity wasmeasured by a Pitot-static probe measurement located on thetunnel center line directly below the propeller, and tunnel staticpressure was measured from the static port of the same Pitotstatic probe. Both pressure measurements were made using 20psi (138 kPa) Validyne pressure transducers low-pass filtered at10 Hz. Propeller rpm was measured using the propeller drivemotor encoder.Wake GeneratorTo study erosion, a scheme was needed to create aconsistent, high-intensity cavitation collapse on the mid-bladeregion of the test propeller. This was accomplished byoperating the propeller in a severe wake field. The wake wasgenerated using a strut installed in the test section contractionimmediately upstream of the propeller, with the tail end of thestrut 0.72 inches upstream of the propeller fairwater (Figure 2).The strut design used a blunt front face with wire grills attachedto the sides to create a large velocity defect, and the geometrywas based on studies of propeller erosion performed by Millerand Dahmer [5, 11]. These studies used a similar strut togenerate wakes over 40 degrees of the propeller disc with peakwake deficits of 60%.Figure 3: LDV survey of strut wake field2
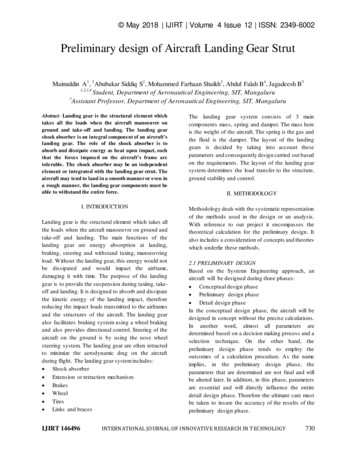
Figure 4: (a) Propeller 5388, 16-inch and (b) Propeller 4119,12-inch propellerinuktun.comPropellersTwo propellers were used to facilitate the evaluation ofcavitation conditions. The first was a 16 inch (0.406 m)diameter , 5-bladed propeller, no. 5388, with a blade designidentical to the propellers to be tested in the coating evaluation.This propeller is typical of naval fixed pitch propellers.Although the blade geometry of this propeller was the same asto be tested in the coatings tests, its size was overly large in the24 in VPWT and it suffered wall effects that altered thecavitation pattern from an unblocked condition. Hence a secondpropeller was tested with a 12 inch (0.305 m) diameter. This 3bladed propeller, no. 4119 [8] had a propeller/jet diameter ratiocloser to that of the coating evaluation propellers to be tested inthe 36-inch VPWT. Pictures of the propellers are in Figure 4.The 16 inch propeller was used extensively for most aspects ofthis test while the 12 inch propeller was used to study how thecavitation conditions would change with a smaller propellerand less wall effects.Figure 5: Submersible CameraThe HS system camera lens was focused through a hole inthe wake-generating foil onto a small mirror mounted to thehead of the Inuktun submersible camera. Using the pan and tiltcontrol of that system, the mirror could be adjusted to provide adirect view of the propeller blade with the same aspect as thesubmersible camera (see Figure 7). This provided a direct viewof the collapse region of the blade’s sheet cavity. The HSimaging system was a Photron camera system with frame ratesup to 6000 fps and pixel resolutions up to 1K x 1K. This highframe rate showed the development of a single cavitation eventand details of the collapse of cavitation bubbles on the bladesurface. The lighting for the HS system was provided by fivesubmersible flood lights and two externally mountedphotography flood lights. The lighting requirements were evenmore demanding because the lens was zoomed to spread theimage reflected from the small mirror over the entire imagesensor.The HR imaging system was a Boulder Imagingacquisition system connected to a Pulnix camera with a pixelresolution of 2K x 2K. The frame rate of this camera wascontrolled by triggers from the propeller shaft one-pulse perrevolution signal, effectively syncing the strobe light andcamera to the propeller blade position. With this acquisitioncapability, every frame acquired was lit by the strobe light andno post processing was necessary to obtain continuoussequences. This system was primarily used to view thepropeller from a side angle through the tunnel window.ImagingThe blade sheet cavitation was viewed with a submersibleInuktun Spectrum 90 pipe inspection camera (Figure 5)mounted inside the wake generation foil immediately upstreamof the propeller. Plastic windows contoured to the foil trailingedge allowed a direct view of the propeller blade as it passedthrough the foil’s wake. This installation is shown in Figure 6.This camera system had remote pan and tilt capability, allowingthe camera view to sweep radially and tangentially relative tothe propeller. Images were acquired at 30 frames per secondwith a pixel resolution of 320 x 240 and recorded on a mini-DVtape recorder. Although this camera system has an internalincandescent light source, a strobe light system was set up totrigger off of a one-pulse per revolution signal, syncing thestrobe flashes with the propeller rotation. Some frames werelit by the strobe and some were dark using this lighting schemewith the camera at 30 frames per second. The dark frames weredigitally removed after acquisition to obtain continuous framesequences with the propeller motion “frozen” by the strobelight. This camera view showed the overall extent of sheetcavitation as well as its variability from one blade passage tothe next.To capture the collapse of the cavitation and obtain highresolution images, two external camera systems were used toacquire images through windows in the tunnel. These systemswill be referred to as the high-speed (HS) and high-resolution(HR) systems, respectively.SubmersibleCameraPitot-Static ProbeFigure 6: Wake generation foil with submersible camera3
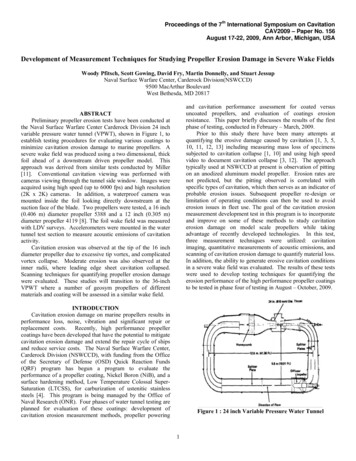
the surface) with a repeatability of 1 µm. Two methods wereplanned for use of this sensor. The first was to scan the entirepropeller using a 6 degree-of-freedom traverse system to holdthe Keyence sensor normal to the blade and automate thescanning process. Comparison of scans made before and aftercavitation erosion indicates the amount of material loss. Thesecond method would scan positive molds of the eroded areasusing Flexbar ReproRubber model #16131 casting material [6].This simpler approach does not require a traversing system, buta mapping transformation is required to adjust the scannedcontours of the molded rubber in a flexed condition to the bladesurface in the rigid condition. In addition, severe tip erosioncannot be molded in the same way as surface dimples orscratches.The 16 inch propeller was run extensively in severecavitation conditions to look at analysis techniques, but theKeyence 2D sensor was not available for scanning thispropeller before starting the test. To gain experience with thesensor, it was used to scan a ReproRubber mold of erosiondamage on another propeller, and those results are shown inFigure 18.Imaging MirrorRESULTS AND DISCUSSIONWake Field SurveyLDV surveys were performed at 4 axial locationsdownstream of the wake generating strut for tunnel velocitiesof 10, 20, and 30 ft/sec (3, 6, and 9 m/sec) as measured by thePitot-static probe.These surveys were taken with a fairwater and dummy hubin place of the propeller. Vertical profiles (Y-positive up, Zpositive downstream) of the wake for all 4 axial locations at atunnel velocity of 30 ft/sec (9 m/sec) are shown for the centerof the wake in Figure 8 and for the propeller tip region of thewake in Figure 9. A full plane survey of the measuredvelocities 0.65 inches (16.5 mm) downstream of the foil isshown in Figure 10 as a contour plot. An outline of thepropeller blade has been added to show where the wake falls onthe blade.Figure 7: High speed imaging setupInksTo facilitate visualization of the area where cavitationerosion would occur, the 16 inch propeller blades were coatedwith stencil ink. The area where the ink was removed gave anindication of where blade erosion damage would occur afterextended operation. Two ink types were evaluated; brush-onMarsh Rolmark white stencil ink and spray-on Diagraph QuickSpray yellow marking ink. The condition of the stencil ink wasrecorded at regular intervals in the propeller operation with thesubmersible camera.Acoustic SensingThree accelerometers were mounted in the 24 inch VPWTtest section to measure the acoustic emission of cavitation.Wilcoxon Research Model 754 submersible accelerometers,with a resonance frequency of 50 kHz and a nominal sensitivityof 10 mV/g, were mounted (1) on the floor of the test sectiondirectly below the propeller, (2) under the capture nozzle of thetest section, and (3) on the downstream propeller shaft strut.The accelerometer signals were conditioned with a PCB Model482A20 Signal Conditioner, and the data were acquired with aTektronix DPO-4034 oscilloscope at a 500 kHz sampling ratein sample lengths of 0.2 seconds. Thirty two samples wereacquired at random intervals at each condition.Erosion Damage EvaluationTo determine the loss of propeller material, a Keyence LJG030 2D laser displacement sensor [9] was planned to be usedto measure surface elevation contours. This sensor uses a fanshaped laser beam to scan a surface and output elevationcoordinates of the surface normal to the sensor axis (normal toFigure 8: LDV Wake Survey - Center Wake VelocityProfile4
Initial plans had been to run the 16 inch propeller atabnormally high load (low J) conditions and force severeleading edge sheet cavitation to occur along the blade. With adesign J near 0.90, the propeller was run at J 0.50 conditions.But the most severe cavitation occurred at the propeller tipbecause of the larger wake deficit in the wake outer edge. Thiscreated a problem for generating cavitation collapse on the midblade of the propeller. For most conditions, the leading edgesuction side cavitation rolled up into the large tip vortex toform a continuous cavity, and the cavity collapsed on thepropeller tip or beyond, missing the blade mid-chord region.To isolate the leading edge cavity from the tip vortex, thepropeller was run in a J range of 0.9 to 1.1. These conditionscreated leading edge cavities that collapsed near 2/3 chord at asigma of 1.6For the 12 inch propeller, a reduction in the tip vortexcavitation was observed, though not enough to be able tosuppress the tip vortex completely and have only leading edgesuction side cavitation. Further tests with this propeller wereabandoned.For 16 inch propeller stencil ink testing, imaging, anderosion damage, higher tunnel velocities (30 to 40 fps) andtunnel pressures near a half atmosphere resulted in the mostfavorable cavitation. At these conditions, the leading edgecavitation and the tip vortex mainly remained separated and theleading edge cavitation tended to collapse on the middle of theblade. However, even in these conditions, the tip vortexdominated the total cavitation volume.For the accelerometer measurements, conditions wereestablished that varied in magnitude, amount, and type ofcavitation present. This was to determine if the accelerometerscould be used to distinguish cavitation types as well asdetermine threshold levels for cavitation erosion damage.The advance coefficient J and cavitation number σ are usedin Table 1 to identify the different conditions. Theseparameters are defined as follows:Figure 9: LDV Wake Survey - Outer Wake Velocity ProfileFigure 8 shows a wake deficit of as much as 80% and athickness close to the strut thickness (4.5 inches, 114.3 mm) atthe prop center. These are good conditions for mid-bladecavitation collapse. However, Figure 9 and Figure 10 also showa large, wide wake deficit (0.1 Vz/Upt) out at the tip region ofthe 16 inch propeller. This large deficit is essentially a walleffect caused by the junction of the 24 inch VPWT contractionnozzle with the wake generation strut and the sudden entry ofthe flow into the open test section.Cavitation ConditionsWith the wake generating strut upstream of the propeller itbecame possible to observe extreme cavitation conditions onthe propeller blades as they passed through the horizontal wake.By controlling tunnel velocity, tunnel static pressure, andpropeller rpm, different cavitation conditions were achieved fordifferent aspects of testing. A summary of the conditions canbe found in Table 1.J U ptnDσ Ps Pv1 ρU 22ptWhere Upt is the Pitot-static probe velocity, n is thepropeller rpm, D is propeller diameter, Ps is tunnel staticpressure, Pv is vapor pressure and ρ is water density.Table 1: 24 inch VPWT Condition SummaryCondition16 inch Prop12 inch PropHigh SpeedAccel Cond 1Accel Cond 2Accel Cond 3Accel Cond 4Upt Figure 12Figure 13Figure 14Figure 15&16Figure 16Figure 16Figure 16Erosion Pattern ImagingThe 16 inch propeller was painted with stencil ink. Two ofthe blades were painted with brush-on ink, two with spray-onink, and one blade was left unpainted. Comparing the bladeswith different ink would highlight differences in the inkFig
pressure was measured from the static port of the same Pitot-static probe. Both pressure measurements were made using 20 psi (138 kPa) Validyne pressure transducers low-pass filtered at 10 Hz. Propeller rpm was measured using the propeller drive motor encoder. Wake Ge