Transcription
Flood Damage in the United States, 1926–2000A Reanalysis of National Weather Service EstimatesbyRoger A. Pielke, Jr.Mary W. DowntonJ. Zoe Barnard MillerJune 2002Environmental and Societal Impacts GroupNational Center for Atmospheric Research*P.O. Box 3000, Boulder, Colorado 80307-3000Sponsored by: Office of Global ProgramsNational Oceanic and Atmospheric Administration*The National Center for Atmospheric Research is sponsored by the National Science Foundation.
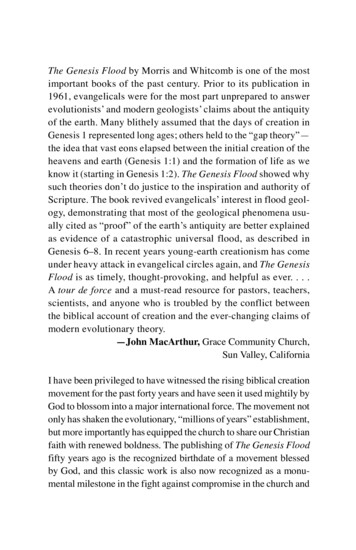
This is a report of the University Corporation for Atmospheric Research, supported by theNational Science Foundation, the National Weather Service, and the National Oceanic andAtmospheric Administration, Office of Global Programs, pursuant to NOAA Award No.NA96GP0451 through a cooperative agreement. The views expressed herein are those of theauthors and do not necessarily reflect the views of UCAR, the National Science Foundation,NOAA, or any of their subagencies.www.flooddamagedata.orgPlease cite this publication as follows:Pielke, Jr., R.A., M.W. Downton, and J.Z. Barnard Miller, 2002: Flood Damage in the UnitedStates, 1926–2000: A Reanalysis of National Weather Service Estimates. Boulder, CO:UCAR.Note: Present affiliation for Roger Pielke, Jr.: Center for Science and Technology PolicyResearch, University of Colorado, 1333 Grandview Ave., Boulder, CO 80309-0488. E-mail:pielke@cires.colorado.eduCover photo credit: East Grand Forks, Minnesota, April 1997: An eerie calm settles on the waterin this East Grand Forks neighborhood. Many homes floated off their foundations, allreceived significant damage. Photo by David Saville, Federal Emergency ManagementAgency.Limited copies of this report may be obtained upon request from:Environmental and Societal Impacts GroupNational Center for Atmospheric ResearchPO Box 3000Boulder, CO 80307-3000Tel: 303-497-8117downton@ucar.edu2
CONTENTSACKNOWLEDGMENTS . iiiEXECUTIVE SUMMARY .vLIST OF TABLES . viiLIST OF FIGURES .viii1. INTRODUCTION .1Why We Need Historical Flood Damage Data .1Sources of Historical Flood Damage Data.2Scope of the NWS Flood Damage Data .2Purpose and Methods.4Organization.52. SOURCES OF FLOOD DAMAGE ESTIMATES, 1926–2000.6Overview of Historical NWS Es timates .6Present Methods of Compiling Flood Damage Estimates .7Sources of Historical NWS Estimates .9Additional Sources of Flood Damage Estimates .11Summary.143. DEVELOPMENT OF THE DATA SETS .15Resolving the Data Gap, 1976–1982 .15Annual National Flood Damage Estimates (1926–1979, 1983–2000) .16Annual Flood Damage Estimates for the States (1955–1979, 1983–2000) .16Annual Flood Damage Estimates in River Basins (1933–1975) .16Use of the Damage Estimates .194. SOURCES OF INACCURACY IN THE DAMAGE DATA .20Clerical Errors.20Inconsistency in Reporting over Time .20Low Precision of Reported Estimates .22Inadequate Estimation Methods.235. ACCURACY OF DAMAGE ESTIMATES .24Errors in Early Damage Estimates.24Comparison of Damage Estimates from NWS and States .30Accuracy: Summary and Conclusions .406. DEALING WITH DATA OMISSIONS AND INCONSISTENCIES .43Frequency of Damaging Floods at the State Level.43Magnitude of Damages .45Implications for Analysis of State Damages.49Recommendations .54i
7. USE AND INTERPRETATION OF NWS FLOOD DAMAGE DATA .55Analyzing Trends Over Time .55Comparing States .59Comparing Individual Flood Events .59Possible Inconsistencies With Other Sources .65Uses of the Reanalyzed NWS Damage Estimates .65Recommendations for Future Collection of Flood Damage Estimates .66REFERENCES .68ABBREVIATIONS .72APPENDIX A. Compilation of Damage Estimates for 1976–1979 .73APPENDIX B. Estimated Flood Damage, by State .79ii
ACKNOWLEDGMENTSThis research was supported by the National Oceanic and Atmospheric Administration,Office of Global Programs (NOAA-OGP), Award No. NA96GP0451, with the able assistance ofBill Murray, Caitlin Simpson, and Rick Lawford. Additional support was provided by the U.S.Weather Research Program. The authors are particularly grateful for the assistance of FrankRichards and Joanna Dionne of the National Weather Service (NWS) Hydrologic InformationCenter and other NWS staff including Paul Polger and John Ogren (Silver Spring, MD) andRobert Glancy and Frank Cooper (Denver, CO).Valuable assistance and comments were received from David Wingerd, U.S. Army Corpsof Engineers; Stan Changnon and Ken Kunkel, Illinois State Water Survey; Bill Cappuccio,National Flood Insurance Program (Iowa); Lisa Flax, National Ocean Service; Jacki Monday,Natural Hazards Research and Applications Information Center; Kathleen Miller, NationalCenter for Atmospheric Research; and Tom Grazulis, The Tornado Project.Many state emergency management agencies provided information for this study. Weare especially grateful to Michael Sabbaghian, California Governor’s Office of EmergencyServices, for providing data and assistance related to the California 1998 El Niño disaster.Information was also provided by:Lee Helms, Alabama Emergency Management AgencyKarma Hackney, Dana Owens, and Tom Mullins, California Governor’s Office of EmergencyServicesLarry Lang, Colorado Water Conservation BoardYusuf Mustafa, Florida Division of Emergency ManagementShirley Collins, Florida Bureau of Recovery and Mitigation, Dept. of Community AffairsGary McConnell, Georgia Emergency Management AgencyEdward Teixeira, Hawaii State Department of DefenseRobert Sherman, Illinois Emergency Management AgencyPhil Roberts, Indiana State Emergency Management AgencyDavid Eash, Iowa Dept. of Natural ResourcesArt Jones, Louisiana Office of Emergency PreparednessStephen J. McGrail, Massachusetts Emergency Management AgencyDoran Duckworth, Michigan Dept. of State Police, Emergency Management DivisionSherrill Neudahl, Minnesota Dept. of Public Safety, Division of Emergency ManagementGlenn Schafer and Stuart Shelstad, Minnesota Farm Service AgencyChuck May, Missouri State Emergency Management AgencyKay Phillips, Ohio Emergency Management Agency, Response and Recovery BranchDennis Sigrist, Oregon Emergency Management AgencyJohn Knight, South Carolina Emergency Preparedness DivisionJoan Peschke, Texas Emergency Management, Recovery SectionMichael Cline and Harry Colestock, Virginia Dept. of Emergency Servicesiii
Chuck Hagerhjelm and Terry Simmonds, Washington State Military Dept., EmergencyManagement DivisionJohn Pack, West Virginia Dept. of Military Affairs and Public Safety, Emergency ServicesRobert J. Bezek, Wyoming Emergency Management AgencyMuch assistance was provided by librarians at the National Center for AtmosphericResearch and the National Oceanic and Atmospheric Administration in Boulder, CO, and thestaff of the U.S. Army Corps of Engineers library at Fort Belvoir, VA.Finally, special thanks to Jennifer Oxelson for constructing the website, to Roberta Kleinfor helpful comments on the manuscript, and to D. Jan Stewart, Anne Oman, and Jan Hopper forpreparing the report for publication.iv
EXECUTIVE SUMMARYFlood damage continues to increase in the United States, despite extensive floodmanagement efforts. To address the problem of increasing damage, accurate data are needed oncosts and vulnerability associated with flooding. Unfortunately, the available records ofhistorical flood damage do not provide the detailed information needed for policy evaluation,scientific analysis, and disaster mitigation planning.This study is a reanalysis of flood damage estimates collected by the National WeatherService (NWS) between 1925 and 2000. The NWS is the only organization that has maintaineda long-term record of flood damage throughout the U.S. The NWS data are estimates of directphysical damage due to flooding that results from rainfall or snowmelt. They are obtained fromdiverse sources, compiled soon after each flood event, and not verified by comparison withactual expenditures. Therefore, a primary objective of the study was to examine the scope,accuracy, and consistency of the NWS damage estimates to improve the data sets and offerrecommendations on how they can be appropriately used and interpreted.This report presents the following three data sets, which are also available on the WorldWide Web at www.flooddamagedata.org: Estimated flood damage in the U.S. (1926–1979 and 1983–2000, by fiscal year; Estimated flood damage for each state in the U.S. (1955–1979, by calendar year, and1983–2000, by fiscal year); and Estimated flood damage, by river basin, for the U.S. (1933–1975, by calendar year).We found that the NWS collection and processing of flood damage data were reasonablyconsistent from 1934 to the present, except during the period 1976–1982. Data from NWS filesand other sources made it possible to reconstruct state and national flood damage estimates for1976–1979. However, little data was collected during 1980–1982 and large errors werediscovered in estimates developed later for that period. As a result, the years 1980–1982 areexcluded from the reanalyzed data sets.Evaluation of the accuracy of the estimates led to the following conclusions:1. Individual damage estimates for small floods or for local jurisdictions within a largerflood area tend to be extremely inaccurate. When damage in a state is estimated to be less than 50 million (in 1995 dollars), estimates from NWS and other sources frequently disagree bymore than a factor of two.2. Damage estimates become more accurate at higher levels of aggregation. Whendamage in a state is estimated to be greater than 500 million, disagreement between estimatesfrom NWS and other sources are relatively small (40% or less). The relatively close agreementbetween NWS and state estimates in years with major damage is reassuring, since the mostcostly floods are of greatest concern and make up a large proportion of total flood damage.v
3. Floods causing moderate damage are occasionally omitted, or their damage greatlyunderestimated, in the NWS data sets. Missing NWS estimates were discovered for floods inwhich the state claimed as much as 50 million damage.In summary, the NWS flood damage estimates do not represent an accurate accounting ofactual costs, nor do they include all of the losses that might be attributable to flooding. Rather,they are rough estimates of direct physical damage to property, crops, and public infrastructure.Estimates for individual flood events are often quite inaccurate, but when estimates from manyevents are added together the errors become proportionately smaller.At the national level, these findings suggest that annual damage totals are reasonablyaccurate because they are sums of damage estimates from many flood events. State annualdamage estimates are more problematic. Both frequency and magnitude of damage must beconsidered, because damaging floods do not occur every year in most states. Flood frequencycannot be determined simply by the presence or absence of a damage estimate because reporting,particularly for small floods, is unreliable.Aggregation is a key to reducing estimation errors. To compare flood damages betweenstates, aggregate the damage estimates over many years and compare the sums. To comparedamage between years, aggregate yearly state damage estimates over multi-state regions. Evenwhen the estimates are highly aggregated, be aware that a substantial amount of variability iscaused by estimation errors and interpret the results accordingly.When properly used, the reanalyzed NWS damage estimates can be a valuable tool to aidresearchers and decision makers in understanding the changing character of damaging floods inthe United States. Users of the reanalyzed data are advised to take the following precautions: To compare flood damage over time, adjust for changes in population, wealth, ordevelopment. To compare damage in different geographical areas, control for differences in populationand in the incidence of extreme weather events during the period of study. Use damage estimates for individual floods with caution, recognizing that estimationerrors are large. Comparison of individual floods might be better done using nominal orordinal damage levels. Look for qualitative descriptions to compare the nature andimpacts of the damage. Different agencies define “flood” and “flood damage” somewhat differently. Check forincompatibilities between data from different sources before seeking to combine sourcesor aggregate data.The NWS damage estimates are not reliable enough to be a basis for critical decisions,such as setting flood insurance premiums or evaluating the cost-effectiveness of specific hazardmitigation measures. Better damage data are needed to evaluate the effectiveness of specificmitigation measures designed to reduce flood losses.vi
LIST OF TABLESTable 1-1. Sources of flood damage estimates. . 3Table 2-1. Published sources of flood damage estimates from the NWS andUS Weather Bureau.10Table 2-2. Types of flood loss reported during each era.12Table 3-1. Estimated US flood damage, by fiscal year (Oct–Sep).17Table 5-1. California 1998 El Niño disaster: Estimated and actual publicassistance costs, in thousands of current dollars.26Table 5-2. Crosstabulation of flood damage estimates from the NWS and fivestates. Estimates are in millions of dollars.32Table 6-1. Comparison of damage estimates by state, 1995–1978 and 1983–1999.47Table 6-2. Levels of annual state flood damage in three states during allyears, 1955–1978 and 1983–1999. .50Table 7-1. Minnesota flood damage expenditures in major flood years 1993and 1997 (in millions of dollars).64vii
LIST OF FIGURESFigure 5-1. Estimated flood damage in California counties in the 1998 El Niño disaster,compared with actual costs as of June 1, 2001:(a) Initial damage estimate .28(b) Preliminary damage assessment.29Figure 5-2. Comparison of National Weather Service flood damage estimates withestimates obtained from five states:(a) California, 1955–1977 .34(b) California, 1978–1998 .35(c) Colorado, 1955–1998 .36(d) Michigan, 1975–1998 .37(e) Virginia, 1977–1998 .38(f) Wisconsin, 1973–1993.39Figure 5-3. Scatterplot of National Weather Service flood damage estimates versusestimates obtained from five states, in millions of 1995 dollars.41Figure 6-1. Frequency distributions of annual state flood damages (1995 dollars),1955–1978 and 1983–1999. .44Figure 6-2. States ranked by estimated total damage during1955–1978 and 1983–1999. .46Figure 6-3. Historical flood damage in states representing different levels of vulnerability:(a) High vulnerability, California .51(b) Medium vulnerability, Alabama .52(c) Low vulnerability, Maine .
such as setting flood insurance premiums or evaluating the cost-effectiveness of specific hazard mitigation measures. Better damage data are needed to evaluate the effectiveness of spec
