Transcription
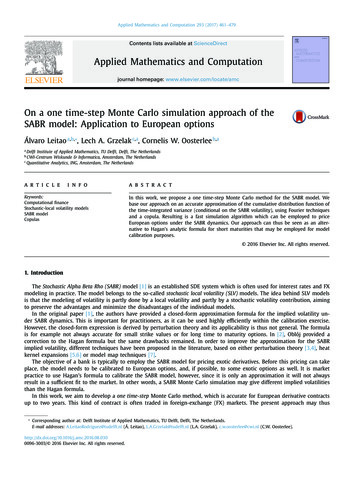
SCIENCE ADVANCES RESEARCH ARTICLEAPPLIED SCIENCES AND ENGINEERINGA skin-conformable wireless sensor to objectivelyquantify symptoms of pruritusKeum San Chun1†, Youn J. Kang2,3†, Jong Yoon Lee2,4†, Morgan Nguyen5, Brad Lee5, Rachel Lee4,Han Heul Jo4, Emily Allen6, Hope Chen3, Jungwoo Kim4, Lian Yu7, Xiaoyue Ni2,8, KunHyuck Lee2,3,Hyoyoung Jeong2,3, JooHee Lee4, Yoonseok Park2,3, Ha Uk Chung2,3,4, Alvin W. Li6, Peter A. Lio9,Albert F. Yang6, Anna B. Fishbein10, Amy S. Paller3,6,11, John A. Rogers2,3,12,13,14*, Shuai Xu2,3,10,11,12*INTRODUCTIONItch and pain are the two cardinal examples of nociception in humans—itch leads to a scratch reflex, while pain leads to a withdrawal reflex(1). Unfortunately, itch is often overlooked and undertreated in theclinical setting (2) despite the wide range of medical conditions thatcause itch—1% of all outpatient visits yearly involve the symptomof itch representing a major global disease burden (3). While a widerange of medical conditions leads to itch (e.g., renal failure, liverfailure, and lymphoma), atopic dermatitis (AD) is likely the mostcommon. AD is also the most widespread pediatric inflammatoryskin disease, affecting 10 million U.S. children with a yearly prevalence of 13% (4). The hallmark of AD is itch, the primary driver ofmorbidity that leads to chronic sleep disturbance in 60% of affectedchildren (5–8). The consequences for millions of children includeneurocognitive impairment and decreased growth (9–12). The qualityof life of patients with moderate-to-severe AD consistently scoresamong the lowest of all chronic diseases (13).In AD and other conditions that cause itch, a major unmet needis in objective measures of itch to assess the efficacy of new medications, quantify disease severity, and monitor treatment response. The1Electrical and Computer Engineering, The University of Texas at Austin, Austin, TX 78712,USA. 2Querrey Simpson Institute for Bioelectronics, Northwestern University, Evanston,IL 60208, USA. 3Center for Bio-Integrated Electronics, Northwestern University,Evanston, IL 60208, USA. 4Sibel Health, Niles, IL 60714, USA. 5Northwestern UniversityFeinberg School of Medicine, Chicago, IL 60611, USA. 6Department of Dermatology,Northwestern University Feinberg School of Medicine, Chicago, IL 60611, USA.7Electrical and Computer Engineering, University of Illinois at Champaign-Urbana,Champaign, IL 61801, USA. 8Department of Mechanical Engineering and MaterialsScience, Duke University, Durham, NC 27708, USA. 9Chicago Eczema Center, Chicago,IL 60654, USA. 10Department of Pediatrics (Allergy and Immunology), Ann & RobertH. Lurie Children’s Hospital, Chicago, IL 60611, USA. 11Department of Pediatrics(Dermatology), Ann & Robert H. Lurie Children’s Hospital, Chicago, IL 60611, USA.12Department of Biomedical Engineering, Northwestern University, Evanston,IL 60208, USA. 13Department of Materials Science and Engineering, NorthwesternUniversity, Evanston, IL 60208, USA. 14Department of Neurological Surgery, FeinbergSchool of Medicine, Northwestern University, Chicago, IL 60611, USA.*Corresponding author. Email: jrogers@northwestern.edu (J.A.R.); stevexu@northwestern.edu (S.X.)†These authors contributed equally to this work.Chun et al., Sci. Adv. 2021; 7 : eabf940530 April 2021subjective nature of itch creates difficulties in its quantification. Commonly used methods such as patient reported visual analog scalespoorly correlate to visually observed scratching behavior (14). Theseself-reported measures are also prone to both sensitivity and anchoring bias. Furthermore, these subjective methods lack validity inyoung children and cognitively impaired adults.Measuring behaviors associated with scratching provides onemethod to quantify itch severity and frequency. Direct visual inspection of scratching in video recordings represents the gold standard, but these schemes are both labor intensive and impractical inclinical practice. Wrist actigraphy, a method to record movementsusing accelerometers, estimates scratching by measuring wrist motion.This approach offers suboptimal accuracy because of an inability todistinguish, for example, hand waving from scratching. Additionalaspects of the widely varying characteristics of scratching, includingvariabilities across individuals, represent additional unsolved challenges (15). Thus, current sensors and strategies do not offer sufficient performance or practicality for routine use in clinical trials orpatient care.Here, we report a strategy that exploits a soft, flexible, wireless,and low-profile sensor capable of capturing both vibratory and motion signatures of physiological processes with clinical-grade dataquality. This device, which we refer to as the ADAM (ADvancedAcousto-Mechanic) (16) sensor, softly couples to the skin to enablecapture of both low-frequency (e.g., motion) and high-frequency(acousto-mechanic) signals from the human body. An embeddedrechargeable battery allows 7 days of continuous operation on asingle wireless charge. When placed on the dorsum of the hand, theADAM sensor is able to capture acousto-mechanic signals associatedwith scratching via a combination of motion and acousto-mechanicsignals in a manner that is immune to ambient noise. Specifically,when placed between the second and third finger meta-carpal bones,the ADAM sensor can quantify scratching behavior initiated not onlyfrom motions of the wrist and/or arm but also from the fingers andfingertips across a wide temporal bandwidth that includes high- frequency vibratory motions associated with scratching itself. Using1 of 11Downloaded from http://advances.sciencemag.org/ on May 3, 2021Itch is a common clinical symptom and major driver of disease-related morbidity across a wide range of medicalconditions. A substantial unmet need is for objective, accurate measurements of itch. In this article, we present anoninvasive technology to objectively quantify scratching behavior via a soft, flexible, and wireless sensor thatcaptures the acousto-mechanic signatures of scratching from the dorsum of the hand. A machine learning algorithmvalidated on data collected from healthy subjects (n 10) indicates excellent performance relative to smartwatch- based approaches. Clinical validation in a cohort of predominately pediatric patients (n 11) with moderate tosevere atopic dermatitis included 46 sleep-nights totaling 378.4 hours. The data indicate an accuracy of 99.0%(84.3% sensitivity, 99.3% specificity) against visual observation. This work suggests broad capabilities relevantto applications ranging from assessing the efficacy of drugs for conditions that cause itch to monitoring diseaseseverity and treatment response.Copyright 2021The Authors, somerights reserved;exclusive licenseeAmerican Associationfor the Advancementof Science. No claim tooriginal U.S. GovernmentWorks. Distributedunder a CreativeCommons AttributionNonCommercialLicense 4.0 (CC BY-NC).
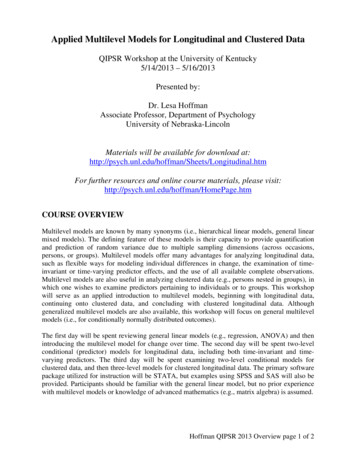
SCIENCE ADVANCES RESEARCH ARTICLEthe sensor data and an associated understanding of the physics of theprocesses of scratching, signal features that uniquely characterizescratching activities can be extracted to train and validate a machinelearning (ML)–based algorithm for scratch detection.The content begins with descriptions of systematic investigationsof the mechanics of scratching in a set of controlled experiments,followed by validation of the combined use of sensor signals with dataanalytics approaches in two human subject studies: an algorithmdevelopment study (n 10 healthy normal subjects) and a clinicalvalidation study (n 11 predominately pediatric patients with AD).The training study involves collection of scratching and nonscratchingdata in well-defined conditions to develop an ML algorithm tocategorize and quantify scratching behavior. The clinical studyvalidates the sensor and the algorithm in a cohort of patients withmoderate to severe AD. The performance compares well to a goldstandard defined by direct visual observation via manually labeledinfrared (IR) camera recordings.Sensor operation and performanceThe ADAM sensor is a small, soft, stretchable wireless device thatmounts using a thin adhesive onto the curvilinear surface of thedorsal hand, with an ability to be positioned across a range of possibleanatomical locations and with various orientations (Fig. 1A). Asdescribed in detail elsewhere, the sensor features a Bluetooth LowEnergy radio, electronics, and a rechargeable battery at one end of thedevice and, at the other, a millimeter-scale, three-axis accelerometerwith a sampling rate of 1600 Hz at a resolution of 16 bits and a dynamicrange of 2g, where g is the gravitational acceleration, 9.8 m/s2 (16).Studies reported here focus on accelerations measured in a directionperpendicular to the surface of the skin. A thin, low modulus silicone elastomer forms a skin-compatible encapsulating package, as awatertight enclosure for a flexible printed circuit board (fPCB) thatsupports and interconnects these various components. The fPCBadopts a patterned layout that includes a collection of freely deformable, serpentine interconnects specially designed by use of computational modeling to mechanically decouple the accelerometer from theother components of the device. This design optimizes the ability ofthe device to record subtle movements at the skin surface, accuratelyand without constraint. Figure 1A presents images that highlight these“soft” mechanical attributes and the overall “patch” form factor.Scratching activities generate two types of signals. The first corresponds to gross movements of the hand, for which characteristicfrequencies are in the range of a few hertz or less. The second, overlapping in time with the first, arises from subtle vibratory impulsesgenerated by motions of the fingertips and fingernails against a contacting surface. Here, frequencies extend into the range of a fewhundred hertz and exhibit amplitudes that decay rapidly with position along the fingers and into the hand, where they eventually passthrough the wrist and to the arm. Detailed multi-accelerometer measurements reported elsewhere hint at the physics of this second typeof signal, although in the context of haptic interfaces (17). Similardirect measurements of accelerations at different locations from thefingertip to the wrist reveal the spectral characteristics of signalattenuation for the scratching behaviors studied here (Fig. 1B). Measurements involve wireless accelerometers located at the fingertip,the midpoint along the finger, the dorsum of the hand, and the wrist, asin the right frame in Fig. 1B (fig. S1A). The tests capture signals dueChun et al., Sci. Adv. 2021; 7 : eabf940530 April 20212 of 11Downloaded from http://advances.sciencemag.org/ on May 3, 2021RESULTSto scratching the surface of the skin by articulating the arm for 10 sand then scratching with only the finger for 10 s. The peak-to-peakamplitudes of accelerations at the surface of the skin decay with increasing distance along the finger and the surface of the hand to thewrist. The color bars in spatial patterns in Fig. 1B represent the meanpower of the signal per frequency in each frequency band. The leftand right numbers indicate the maximum and minimum values foreach of the respective plots. For scratching by articulating the arm(the first row of the spatial pattern), the power decays from 20 dB/Hzat the fingertips, the point of initiation, to 32 dB/Hz at the wristin the frequency range from 10 to 100 Hz. The attenuation increases sharply with frequency. Specifically, the signal decreasesfrom 19 to 37 dB/Hz and 20 to 41 dB/Hz for frequency rangesof 100 to 200 Hz and 200 to 400 Hz, respectively. For both types ofscratching, the approximate power dissipation from the fingertip tothe wrist is 2 dB in the frequency range from 0.1 to 10 Hz, 12 dB inthe range from 10 to 100 Hz, 20 dB in the range from 100 to 200 Hzand 200 to 400 Hz, and 16 dB in the range from 400 to 800 Hz. Asexpected, the attenuation at low frequencies is much lower than thatat high frequencies. The power of the signal decreases exponentiallywith increasing propagation distance and with increasing frequency.A decay constant of , a frequency-dependent characteristic ofviscoelastic material obtained by fitting the experimental data, characterizes the behavior. In the experiment in Fig. 1B, has a value of0.38 for the case of vibrations that propagate from the fingertip tothe dorsum of the hand (fig. S1C). These results suggest that criticallyimportant high-frequency information associated with scratchingcan be captured most effectively by (i) locating the sensor in closeproximity to the fingertips and (ii) operating the accelerometer in ahigh bandwidth mode.Existing scratch sensors use relatively low bandwidth accelerometers (typically 50 Hz or less) and associated electronics in rigidenclosures that couple to the wrist using bands (18–20). Althoughthese devices can capture the first type of signal, they cannot recordthe second with adequate fidelity, consistent with the results of thepropagation studies described above. This limitation follows from(i) a nonideal mounting location, at the wrist, where high-frequencysignals have small amplitudes; (ii) measurement bandwidths that areinsufficient to capture high-frequency information; and (iii) a loosemechanical coupling to the skin. The ADAM sensor, by contrast,quantifies both types of signals with high precision because of itsproximity to the fingertips/fingernails, its high bandwidth operation,and its intimate mechanical interface to the skin. The result is asuperior capability for identifying scratching events with high specificity and sensitivity. Figure 1C presents representative data generated by scratching the arm with the pointer finger of the opposinghand, as illustrated in the left frame. The motions involve (i) translating the hand, wrist, and arm with the finger in a fixed position for10 s and then (ii) articulating the fingers only for 10 s. The two typesof signals discussed previously can be identified by passing the datathrough low-pass and high-pass filters with cutoffs at 2 Hz. The firsttype represents the movement of the hand and can serve as the basisfor detecting scratch events but, when used in isolation, without thesecond, can produce false-positive results from hand waving, essentialtremor, and other sources of motions unrelated to scratching (18).The critical high-frequency information originates at the fingertipsand transmits through the soft tissue and metatarsal bones to thelocation of the sensor, as described above and illustrated by redarrows in Fig. 1C. These features, which are time-synchronized with
SCIENCE ADVANCES RESEARCH ARTICLEABDownloaded from http://advances.sciencemag.org/ on May 3, 2021CDFig. 1. Overview of the ADAM sensor and signal outputs. (A) Image of the ADAM sensor in various states of deformation to highlight its soft, flexible construction.(B) Results of measurements of spatiotemporal patterns of motions and vibratory signatures of scratching, with a focus on five different frequency ranges. The experiments involve four accelerometers, one each located at the fingertip, finger, dorsum of the hand, and the wrist, during scratching by articulating the arm for 10 s and thenscratching with only the finger for the last 10 s. The color bars represent the mean power of the signal per frequency in each frequency band. The left and right valuesindicate the minimum and maximum of the respective plot. Upper spatial patterns are from scratching by articulating the arm, and lower spatial patterns are from scratchingwith only the finger. (C) Path of scratching and resulting data (raw and filtered) data from the sensor. (D) Comparison of signals captured during scratching with fivedifferent mounting locations as time series and spectrogram plots. The dorsal hand is an effective mounting location for capturing scratching with only the fingers.Photo credit: Keum San Chun, University of Texas at Austin.Chun et al., Sci. Adv. 2021; 7 : eabf940530 April 20213 of 11
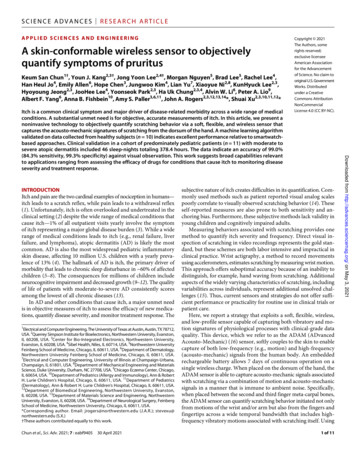
SCIENCE ADVANCES RESEARCH ARTICLECharacterizing scratchingScratching varies with individuals in response to both internal andexternal stimuli. Scratching can occur via articulation of the elbow,wrist, or fingers alone, as examined in the tests summarized aboveand in Fig. 1. In the mode that engages the entire upper arm, thefingers press against the surface and remain stationary, where movement of the forearm articulating at the elbow joint drives the scratching action. The finger scratching mode, on the other hand, involvesmainly local movements of the fingers, without substantial forearmor wrist motion. Mixtures of these two modes are also possible.Depending on the location of scratching and the degree of itch,individuals interchangeably use different modes of scratching. Forany type of scratching action, the intensity is also important. Theforce at the point of contact determines the friction between thefingertips and the surface, and can therefore be considered, alongwith frequency and speed, as a metric of the intensity of a scratchingevent. These factors contribute to differences in signals captured bythe ADAM sensor. Systematic studies for various types of scratchingactivities are important precursors to the development of a generalizable scratch detection algorithm.Control experiments for this purpose involve two body locations:dorsum of the hand (DH) and forearm (FA) (Fig. 2A), with theADAM sensor on the left dorsal hand (Fig. 1D), with two locationsscratched with the left hand by articulating the arm only and thenthe fingers only, at a high intensity followed by a low intensity. Theblue solid line in Fig. 2A shows the time-dependent z-axis accelerationfrom the vibrational motions at the surface of the skin in a directionChun et al., Sci. Adv. 2021; 7 : eabf940530 April 2021orthogonal to the plane of the scratching motion. The peak-to-peakamplitudes are larger for high-intensity scratching than for lowintensity, as expected. For instance, the amplitude of the signal forhigh-intensity FA scratching (45 to 55 s) is 1.5g, which is more thantwo times greater than that for the low-intensity case (65 to 75 s; 0.7g).For an otherwise similar scenario but by articulating only the fingers,the amplitudes of the high (125 to 135 s) and low (145 to 155 s) are0.4g and 0.15g, respectively. Results for articulating the arm only(0 to 80 s) show amplitudes larger than those for the fingers (80 to160 s) for each scratch location (DH, FA) and intensity level. Thefrequency domain content associated with these signals appears asspectrograms (Fig. 2A), plotted using the same window and framesize as Fig. 1C. In all cases, even at low intensity with fingers only,the high-frequency content, especially up to 200 Hz, features prominently in the data. The normalized spectral characteristics of highand low-intensity scratching events are largely the same, as in fig. S3.Scratching activities on five different body locations (head, arm,abdomen, knee, and leg) and nonscratching activities (simulatingscratching with fingers in the air, hand waving, texting using a cellphone, typing on a keyboard, and clicking a mouse) highlight the keydifferences in the signals and the importance of the high-frequencycontent in a range of practical scenarios (Fig. 2, B to D). Specifically,the data for all scratching activities have substantial energy above200 Hz, independent of location (Fig. 2C). As expected based on previous discussions, the spectrograms of most nonscratching activitiesexhibit minimal energy in this frequency range (Fig. 2E). Textmessaging, typing on a keyboard, and clicking a computer mouserepresent exceptions, where the data show contributions between100 and 200 Hz because of impulse components of these motions.Nevertheless, the spectral content across all frequencies, the temporalcharacteristics of the signals, and the low-frequency information canhelp to distinguish these activities from scratching. In other words,the high-frequency components of the recorded signals are importantindicators of scratch, but they must be used together with otherfeatures of the data to achieve high selectivity against a certain, relatively small, set of confounding activities. Furthermore, measurement of nocturnal scratching mitigates the need to differentiatefrom awake activities such as typing or text messaging. As an illustration, movies S1 and S2 highlight a form of manual signal analysisthat involves translation of the raw data into an audio file that canbe interpreted in a manner analogous to that of sounds from astethoscope. Various activities such as those described above can beimmediately distinguished from scratching in this manner. Thesecollective considerations motivate an ML approach to data analysis,in which various features, including but not limited to high-frequencycontent, contribute to a classification scheme for unmatched combined levels of sensitivity and specificity.Hand-mounted versus wrist-mounted scratch sensingAs mentioned previously, scratching behavior can occur via articulation of the fingers, wrist, elbow, or shoulder. A key limitation ofwrist-mounted sensors is the inability to measure motion associatedwith finger-only scratching and in difficulties in distinguishing between hand waving and scratching. Control studies reveal the performance of the ADAM system compared to a wrist-bound system(Apple Watch Series 4) with an embedded mobile application published previously to quantify scratch (18). The comparison focuseson two modes of scratching: one by articulating the arm and theother by only the fingers. To examine scratching by articulating the4 of 11Downloaded from http://advances.sciencemag.org/ on May 3, 2021sliding of the fingertips and, in some cases, with motions of the hand,include energy across a broad range of frequencies (21). Althoughtransmission through the body leads to attenuation that increaseswith frequency, particularly above 100 Hz (22), the associatedcomplex waveforms are well preserved at distances of several centimeters (17, 23).The effects appear in characteristics of signals captured by theADAM sensor placed at the dorsum of the hand and the wrist withhorizontal and vertical orientations, and on top of a smartwatch(Apple Watch Series 4) tightly strapped to the wrist. Measurementsinvolve first articulating the fingers with a scratching motion in theair for 2.5 s and then scratching the surface of the skin with the samemotions for 2.5 s. Time series and spectrogram representations ofthe data in Fig. 1D show the high-frequency content associated withscratching the skin versus the air, in all cases. The spectrograms inFig. 1D use a Hamming window with a frame size of 0.2 s and anoverlapping duration of 0.19 s. These identifying features extend infrequency up to 600 Hz, with some energy even up to 800 Hz, butwith the most notable amplitudes in the range of up to 200 Hz. Theresults show only modest dependence on mounting location provided that the sensor is on the radial half of the dorsum of the hand.Orientation has little effect, simply because the accelerometer resides at the front of the ADAM device, as described previously andhighlighted with a red dot in Fig. 1D. On the wrist, the high-frequencycomponents appear only as weak features in the data, consistent withthe previous attenuation results in Fig. 1B (fig. S1B). As mounted onthe back of the hand where the signal strength is high, the soft physical properties of the device and the medical-grade, hypoallergenic,single-use adhesive support a robust yet comfortable and nonirritating interface compatible with many daily activities involving varioushand and wrist motions (fig. S2).
SCIENCE ADVANCES RESEARCH ARTICLEABDownloaded from http://advances.sciencemag.org/ on May 3, 2021CDEFig. 2. Representative data collected by the ADAM sensor. (A) Sample time series data and spectrogram corresponding to scratching activities. Two modes of scratchingare conducted on two body parts, dorsum of the hand (DH) and forearm (FA), in two intensities of high (H) and low (L). (B) Time series data of scratching activity in whichfive different body parts include head (hairy skin), arm (normal skin), abdomen (soft skin), knee (bony prominence skin), and the leg (hard skin). (C) Spectrogram of eachtime series data in (B). The signals due to the scratching activities have the energy in the 0- to 800-Hz frequency range. (D) Time series data in a wide range of nonscratchingactivities including simulated moving fingers in the air, waving hand, text messaging, typing on the keyboard, and clicking the mouse. (E) Spectrogram of each time seriesdata in (D). The signals due to nonscratching activities have energy mainly in the range less than 200 Hz.arm, the set of activities includes knee scratching, hand waving, abdomen scratching, and head scratching in a sequence for 10 s separated by 5 s of pause. The blue line represents the time series of theraw data, and the red line indicates the final binary classificationresults where 0 and 1 correspond to nonscratch and scratch, respectively. The black dashed line highlights the classification results fromItch Tracker (18), with 0 representing nonscratch activity and 0.5 representing scratch activity (Fig. 3A). While Itch Tracker captures kneescratching and abdomen scratching, it misclassifies hand wavingChun et al., Sci. Adv. 2021; 7 : eabf940530 April 2021and head scratching. The former likely follows from a heavy relianceon hand motions for scratch detection. The latter probably occursbecause head scratching involves only short range of motions ofthe wrist. The ADAM system performs well across all of these andother scenarios.Additional experiments explore scratching modes that involveonly finger articulation (Fig. 3B). As with the previous comparisonusing the arm for scratching, the four activities include knee scratching, simulating scratching in the air, abdomen scratching, and head5 of 11
SCIENCE ADVANCES RESEARCH ARTICLEABscratching. In these activities, the Itch Tracker does not detect anyinstances of scratching because of the lack of motion at the wrist.On the other hand, the ADAM system detects all instances, and iteven accurately discriminates scratching from pseudo-scratching(Fig. 3B). Simulated scratching motion in the air provides an additional test of the ADAM system. The major difference betweenscratching and pseudo-scratching is the presence of frequency signatures above 100 Hz. While the ADAM system can capture frequencies as high as 800 Hz, most wrist-bound accelerometers suchas the Apple Watch record frequencies only as high as 50 Hz (i.e.,sampling rate of 100 Hz).ValidationA random forest (RF) classifier allows automated detection ofscratching activities. The training dataset contains scratching datafrom 15 different body locations and 6 types of nonscratching activities collected from 10 healthy normal subjects (Fig. 4, A and B).Results from leave-one-subject-out cross validation (LOSO-CV) applied to the training dataset form the basis for optimization of theRF classifier. In this process, a dataset from a single participantserves as the testing dataset, and the remaining data allow training.Iterating this process across all participants allows each participant’sdata to be used for testing once. The classification performance corresponds to averages from all iterations of the validation. LOSO-CV,Chun et al., Sci. Adv. 2021; 7 : eabf940530 April 2021unlike k-fold CV approaches, prevents the classifier from learning aconfounding relationship within a subject’s dataset, with unrealistically high classification accuracy as reported by Saeb et al. (24). TheRF model can be optimized by comparing the LOSO-CV outcomes.The parameters for this optimization include the number of trees inthe RF classifier and the minimum required scratching (MRS)duration. The RF classifier is a meta estimator that fits a number ofdecision tree classifiers on various subsamples of a dataset. Thechoice of number of trees in the forest fairly balances the complexityof the model and its performance. Increasing the number increasesthe training time and the potential for overfitting. Thus, the optimization focuses on examining a different number of estimators, from10 to 200 trees, and comparing the LOSO-CV performance. The classification performance reaches a maximum value at approximately30 decision trees.The MRS duration represents another optimization parameter.In the signal processing pipeline (Fig. 4C), the RF classifier returnspredictions at a 1-s frame level. The outputs are subsequently clustered using density-based spatial clustering of applications with noise(DBSCAN). The purpose of DBSCAN is to join two scratching framesin close proximity as a single scratching event. MRS defines theminimum number of frames to form a cluster of scratching events.MRS values from 1.5 to 8.5 s yield different classification performanceusing LOSO-CV. The performance increases with increasing MRS6 of 11Downloaded from http://advances.sciencemag.org/ on May 3, 2021Fig. 3. Comparison of results obtained with an ADAM device on the hand and an Apple Watch with the Itch Tracker mobile application. Time series data and thespectrograms for various scratch (skin over the knee where there is a bony prominence, skin of the soft abdomen, and skin of complex surface head) and nonscratch activities(waving of hand and scratching motion in the air), with a 5-s pause between each activity. (A) Scratching by articulating the whole wrist. The Itch Tracker misclassifieshand waving as scratching and fails to detect scratching on the head. (B) Scratching by articulating only the fingers. The ADAM sensor reliably discriminates scratchingthe skin using only articulation of the fingers. The Itch Tracker cannot detect scratches using only fingers, given its mounting loc
SCIENCE ADVANCES RESEARCH ARTICLE 2 of 11 the sensor data and an associated understanding of the physics of the processes of scratching, signal features that uniquely characterize scratching activities can be extracted to train and validate a machine learning (ML