Transcription
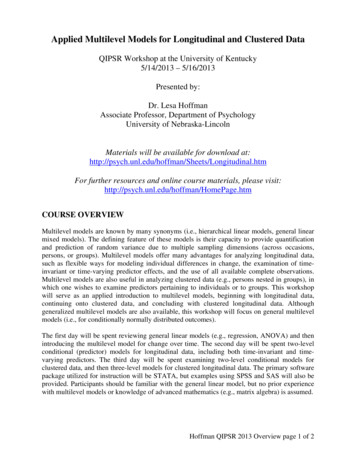
Applied Multilevel Models for Longitudinal and Clustered DataQIPSR Workshop at the University of Kentucky5/14/2013 – 5/16/2013Presented by:Dr. Lesa HoffmanAssociate Professor, Department of PsychologyUniversity of Nebraska-LincolnMaterials will be available for download l.htmFor further resources and online course materials, please RSE OVERVIEWMultilevel models are known by many synonyms (i.e., hierarchical linear models, general linearmixed models). The defining feature of these models is their capacity to provide quantificationand prediction of random variance due to multiple sampling dimensions (across occasions,persons, or groups). Multilevel models offer many advantages for analyzing longitudinal data,such as flexible ways for modeling individual differences in change, the examination of timeinvariant or time-varying predictor effects, and the use of all available complete observations.Multilevel models are also useful in analyzing clustered data (e.g., persons nested in groups), inwhich one wishes to examine predictors pertaining to individuals or to groups. This workshopwill serve as an applied introduction to multilevel models, beginning with longitudinal data,continuing onto clustered data, and concluding with clustered longitudinal data. Althoughgeneralized multilevel models are also available, this workshop will focus on general multilevelmodels (i.e., for conditionally normally distributed outcomes).The first day will be spent reviewing general linear models (e.g., regression, ANOVA) and thenintroducing the multilevel model for change over time. The second day will be spent two-levelconditional (predictor) models for longitudinal data, including both time-invariant and timevarying predictors. The third day will be spent examining two-level conditional models forclustered data, and then three-level models for clustered longitudinal data. The primary softwarepackage utilized for instruction will be STATA, but examples using SPSS and SAS will also beprovided. Participants should be familiar with the general linear model, but no prior experiencewith multilevel models or knowledge of advanced mathematics (e.g., matrix algebra) is assumed.Hoffman QIPSR 2013 Overview page 1 of 2
TENTATIVE SCHEDULE OF TOPICSDayTopic5/14 AMLecture 1: Introduction to Multilevel Models What is multilevel modeling? Concepts in longitudinal data From between-person to within-person models Kinds of ANOVAs for longitudinal data5/14 PMLecture 2: Describing Within-Person Change in Longitudinal Data Multilevel modeling notation and terminology Fixed and random effects of linear time Predicted variances and covariances from random slopes Dependency and effect size in random effects models Describing nonlinear change (polynomials, piecewise, nonlinear) Fun with likelihood estimation and model comparisons Data example 2 (data, syntax, and output provided)5/15 AMLecture 3: Time-Invariant Predictors in Longitudinal Models Missing predictors in MLM Effects of time-invariant predictors Fixed, systematically varying, and random level-1 effects Model building strategies and assessing significance Data example 3 (data, syntax, and output provided)5/15 PMLecture 4: Time-Varying Predictors in Longitudinal Models Time-varying predictors that fluctuate over time Person-Mean-Centering (PMC) Data example 4 (data, syntax, and output provided) Grand-Mean-Centering (GMC) Model extensions under Person-MC vs. Grand-MC Time-varying predictors that change over time5/16 AMLecture 5: Two-Level Models for Clustered Data Fixed vs. random effects for modeling clustered data ICC and design effects in clustered data Group-Mean-Centering vs. Grand-Mean Centering Data example 5 (syntax and output provided only) Model extensions under Group-MC and Grand-MC5/16 PMLecture 6: Three-Level Models for Clustered Longitudinal Data Decomposing variation across three levels in clustered longitudinal data Unconditional (time only) model specification Data example 6 (syntax and output provided only) Conditional (other predictors) model specification Other kinds of three-level designsTopics in italics may be skipped due to time constraints.Hoffman QIPSR 2013 Overview page 2 of 2
Introduction toMultilevel Models Topics:¾What is multilevel modeling?¾Concepts in longitudinal data¾From between-person to within-person models¾Kinds of ANOVAs for longitudinal dataLecture 11What is a Multilevel Model (MLM)? Same as other terms you have heard of:¾General Linear Mixed Model (if you are from statistics) ¾Random Coefficients Model (also if you are from statistics) ¾Random coefficients Random effectsHierarchical Linear Model (if you are from education) Mixed Fixed and Random effectsNot the same as hierarchical regressionSpecial cases of MLM:¾¾¾¾¾Lecture 1Random Effects ANOVA or Repeated Measures ANOVA(Latent) Growth Curve Model (where “Latent” Æ SEM)Within-Person Fluctuation Model (e.g., for daily diary data)Clustered/Nested Observations Model (e.g., for kids in schools)Cross-Classified Models (e.g., “value-added” models)2
The Two Sides of Any Model Model for the Means:¾Aka Fixed Effects, Structural Part of Model¾What you are used to caring about for testing hypotheses¾How the expected outcome for a given observation varies as afunction of values on predictor variablesModel for the Variances:¾Aka Random Effects and Residuals, Stochastic Part of Model¾What you are used to making assumptions about instead¾How residuals are distributed and related across observations(persons, groups, time, etc.) Æ these relationships are called“dependency” and this is the primary way that multilevelmodels differ from general linear models (e.g., regression)Lecture 13Dimensions for Organizing Models Outcome type: General (normal) vs. Generalized (not normal) Dimensions of sampling: One (so one variance term per outcome) vs.Multiple (so multiple variance terms per outcome) Æ OUR WORLD General Linear Models: conditionally normal outcome distribution,fixed effects (identity link; only one dimension of sampling) Generalized Linear Models: any conditional outcome distribution,fixed effects through link functions, no random effects (one dimension) General Linear Mixed Models: conditionally normal outcome distribution,fixed and random effects (identity link, but multiple sampling dimensions) Generalized Linear Mixed Models: any conditional outcome distribution,fixed and random effects through link functions (multiple dimensions) “Linear” means the fixed effects predict the link-transformed DV in a linearcombination of (effect*predictor) (effect*predictor) Lecture 1Note: LeastSquares isonly for GLM4
How We Will Learn MLM “Levels” are defined by the context of a studyLevel у a dimension of sampling (can be nested or crossed)¾ We will start with MLM for longitudinal data ¾Level 1 variation over time, Level 2 variation over persons¾More complex case because of the time dimension We will follow with MLM for clustered data Level 1 variation over persons, Level 2 variation over groups¾ and conclude with MLM for clustered longitudinal data¾Time (Level 1) within persons (Level 2) within groups (Level 3)¾Persons (Level 1) within occasions (Level 2) within groups (Level 3)Lecture 15What can MLM do for you?Model dependency across observations1. Longitudinal, clustered, and/or cross-classified data? No problem! Tailor your model of sources of correlation to your dataInclude categorical or continuous predictors at any level2. Time-varying, person-level, group-level predictors for each variance Explore reasons for dependency, don’t just control for dependencyDoes not require same data structure for each person3. Unbalanced or missing data? No problem!You already know how (or you will soon)!4. Use SPSS Mixed, SAS Mixed, Stata, Mplus, R, HLM, MlwiN What’s an intercept? What’s a slope? What’s a pile of variance?Lecture 16
1. Model Dependency Sources of dependency depend on the sources ofvariation created by your sampling design: residuals foroutcomes from the same unit are likely to be related,which violates the GLM “independence” assumption “Levels” for dependency “levels of random effects”Sampling dimensions can be nested¾ e.g., time within person, person within group, school within countryIf you can’t figure out the direction of your nesting structure,odds are good you have a crossed sampling design instead¾ e.g., persons crossed with items, raters crossed with targetsTo have a “level”, there must be random outcome variation due tosampling that remains after including the model’s fixed effects¾ e.g., treatment vs. control does not create another level of “group”Lecture 17Dependency comes from Mean differences across sampling units (persons, groups)¾¾ Individual/group differences in effects of predictors¾¾¾¾ Creates constant dependency over time (or persons)Will be represented by a random intercept in our modelsLongitudinal: individual differences in growth, stress reactivityClustered: group differences in slopes of person predictorsCreates non-constant dependency, the size of which dependson the value of the predictor at each occasion or for each personWill be represented by random slopes in our modelsLongitudinal data: non-constant within-person correlationfor unknown reasons (time-specific autocorrelation)¾Can add other patterns of correlation as needed for this (AR, TOEP)Lecture 18
Why care about dependency? In other words, what happens if we have the wrong modelfor the variances (assume independence instead)? Validity of the tests of the predictors depends onhaving the “most right” model for the variances¾¾ Estimates will usually be ok Æ come from model for the meansStandard errors (and thus p-values) can be inaccurateThe sources of variation that exist in your outcome willdictate what kinds of predictors will be useful¾¾¾Between-Person variation needs Between-Person predictorsWithin-Person variation needs Within-Person predictorsBetween-Group variation needs Between-Group predictorsLecture 192. Include categorical or continuouspredictors at any level of analysis ANOVA: test differences among discrete IV factor levels¾¾¾ Regression: test whether slopes relating predictors tooutcomes are different from 0¾ Between-Groups: Gender, Intervention Group, Age GroupsWithin-Subjects (Repeated Measures): Condition, TimeTest main effects of continuous covariates (ANCOVA)Persons measured once, differ categorically or continuously on aset of time-invariant (person-level) covariatesWhat if a predictor is assessed repeatedly (time-varyingpredictors) but can’t be characterized by ‘conditions’?¾Lecture 1ANOVA or Regression won’t work Æ need MLM10
2. Include categorical or continuouspredictors at any level of analysis Some things don’t change over measurements Sex, Ethnicity¾Æ Time-Invariant Predictor Person Level Some things do change over measurements Health Status, Stress Levels, Living Arrangements¾Æ Time-Varying Predictor Time Level Some predictors might be measured at higher levelsFamily SES, length of marriage, school size, country size¾ Interactions between levels may be included, tooDoes the effect of health status differ by gender and SES?¾Level:TimePersonFamilyLecture 1113. Does not require same data structureper person (by accident or by design)RM ANOVA: usesmultivariate (wide) datastructure:IDSexT1T2T3MLM: usesstacked (long)data structure:IDSexTimeY100015100026Only rowsmissing data areexcluded1000381000412101114100 uses 4 cases101 uses 3 cases10112710113.1011411T4100056812101147.11People missing any data areexcluded (data from ID 101are not included at all)Time can also be unbalanced across people such that each person canhave his or her own measurement schedule: Time “0.9” “1.4” “3.5” “4.2” Lecture 112
4.You already know how! If you can do GLM, you can do MLM(and if you can do generalized linear models,you can do generalized multilevel models, too)How do you interpret an estimate for ¾the intercept?¾the effect of a continuous variable?¾the effect of a categorical variable?¾a variance component (“pile of variance”)?Lecture 113Introduction toMultilevel Models Topics:¾What is multilevel modeling?¾Concepts in longitudinal data¾From between-person to within-person models¾Kinds of ANOVAs for longitudinal dataLecture 114
Options for Longitudinal Models Although models and software are logically separate,longitudinal data can be analyzed via multiple analyticframeworks:¾“Multilevel/Mixed Models” ¾“Structural Equation Models” ¾Dependency over time, persons, groups, etc. is modeled via randomeffects (multivariate through “levels” using stacked/long data)Builds on GLM, generalizes easier to additional levels of analysisDependency over time only is modeled via latent variables(single-level analysis using multivariate/wide data)Generalizes easier to broader analysis of latent constructs, mediationBecause random effects and latent variables are the same thing,many longitudinal models can be specified/estimated either way And now “Multilevel Structural Equation Models” can do it all Lecture 115Data Requirements for Our Models A useful outcome variable:¾Has an interval scale* ¾Has scores with the same meaning over observations A one-unit difference means the same thing across all scale pointsIn subscales, each contributing item has an equivalent scale*Other kinds of outcomes can be analyzed using generalizedmultilevel models instead, but estimation is more challengingIncludes meaning of constructIncludes how items relate to the scaleImplies measurement invarianceFANCY MODELS CANNOT SAVE BADLY MEASUREDVARIABLES OR CONFOUNDED RESEARCH DESIGNS.Lecture 116
Requirements for Longitudinal Data Multiple OUTCOMES from the same sampling unit!¾2 is the minimum, but just 2 can lead to problems: Only 1 kind of change is observable (1 difference)Can’t distinguish “real” individual differences in change from errorRepeated measures ANOVA is just fine for 2 observations– Necessary assumption of “sphericity” is satisfied with only 2observations even if compound symmetry doesn’t hold¾More data is better (with diminishing returns) More occasions Æ better description of the form of changeMore persons Æ better estimates of amount of individual differencesin change; better prediction of those individual differencesMore items/stimuli Æmore power to show effects of differencesbetween items/stimuli/conditionsLecture 117Levels of Analysis in Longitudinal Data Between-Person (BP) Variation:¾Level-2 – “INTER-individual Differences” – Time-Invariant¾All longitudinal studies begin as cross-sectional studiesWithin-Person (WP) Variation:¾Level-1 – “INTRA-individual Differences” – Time-Varying¾Only longitudinal studies can provide this extra informationLongitudinal studies allow examination of both types ofrelationships simultaneously (and their interactions)¾Any variable measured over time usually has both BP and WP variation¾BP more/less than other people; WP more/less than one’s averageI use “person” here, but level-2 can be anything that ismeasured repeatedly (like animals, schools, countries )Lecture 118
A Longitudinal Data Continuum Within-Person Change: Systematic change¾Magnitude or direction of change can be different across individuals¾“Growth curve models” Æ Time is meaningfully sampledWithin-Person Fluctuation: No systematic change¾Outcome just varies/fluctuates over time (e.g., emotion, stress)¾Time is just a way to get lots of data per individualPure WP ChangePure WP FluctuationTimeTimeLecture 119Introduction toMultilevel Models Topics:¾What is multilevel modeling?¾Concepts in longitudinal data¾From between-person to within-person models¾Kinds of ANOVAs for longitudinal dataLecture 120
The Two Sides of a (BP) Model୧ ଵ ୧ଶ ୧ଷ ୧ ୧Model for the Means (Predicted Values):୧Our focus todayEach person’s expected (predicted) outcome is a weighted linearfunction of his/her values on and (and here, their interaction),each measured once per person (i.e., this is a between-person model) Estimated parameters are called fixed effects (here, Ⱦ , Ⱦଵ , Ⱦଶ , and Ⱦଷ ) Model for the Variance (“Piles” of Variance):Ȉ ୧ Ͳ ǡ ɐଶୣ Æ ONE residual (unexplained) deviationȈ ୧ has a mean of 0 with some estimated constant variance ɐଶୣ ,is normally distributed, is unrelated to and , and is unrelated acrosspeople (across all observations, just people here) Estimated parameter is residual variance only in above BP modelLecture 121An Empty Between-Person Model(i.e., Single-Level)yi 0 ei140120Filling in values:32 90 -58100Y pred806040Mean 89.55Std. Dev. 15.114N 1,334Modelfor theMeansY ErrorVariance: (y – ypred)2N–120Lecture 122
Adding Within-Person Information (i.e., to become a Multilevel Model)Full Sample Distribution3 People, 5 Occasions each140120100806040Mean 89.55Std. Dev. 15.114N 1,33420Lecture 123Empty Within-Person Model140Start off with Mean of Y as“best guess” for any value:120 Grand Mean100 Fixed Intercept80604020Can make better guess bytaking advantage ofrepeated observations: Person MeanÆ Random InterceptLecture 124
Empty Within-Person ModelVariance of Y Æ 2 sources:140Between-Person (BP) Variance:120100806040ÆDifferences from GRAND meanÆINTER-Individual DifferencesWithin-Person (WP) Variance:ÆDifferences from OWN meanÆINTRA-Individual DifferencesÆThis part is only observablethrough longitudinal data.20Now we have 2 piles ofvariance in Y to predict.Lecture 125Hypothetical Longitudinal DataLecture 126
“Error” in a BP Model for the Variance:Single-Level Modeleti represents all Y variancee1ie2ie5ie4ie3iLecture 127“Error” in a WP Model for the Variance:Multilevel ModelU0i random intercept that represents BP variance in mean Yeti residual that represents WP variance in YU0ie1ie2ie3ie4ie5iU0i also represents constantdependency (covariance) due tomean differences in Y across personsLecture 128
Empty Within-Person ModelVariance of Y Æ 2 sources:140eti120U0i100eti80eti60Level 2 Random InterceptVariance (of U0i, as ૌ ܃ ):ÆBetween-Person VarianceÆDifferences from GRAND meanÆINTER-Individual DifferencesU0iLevel 1 Residual Variance(of eti, as ો ) ܍ :4020ÆWithin-Person VarianceÆDifferences from OWN meanÆINTRA-Individual DifferencesLecture 129BP vs. WP Empty Models Empty Between-Person Model (used for 1 occasion):yi 0 ei ¾ 0 fixed intercept grand mean¾ei residual deviation from GRAND meanEmpty Within-Person Model ( 1 occasions):yti 0 U0i eti¾ 0 fixed intercept grand mean¾U0i random intercept individual deviation from GRAND mean¾eti time-specific residual deviation from OWN meanLecture 130
Intraclass Correlation (ICC)Intraclass Correlation (ICC): ܃ ܃ ܍ ICC Proportion of total variance that is between persons ICC Average correlation among occasions ICC is a standardized way of expressing how much we need toworry about dependency due to person mean differences(i.e., ICC is an effect size for constant person dependency)Lecture 131Counter-Intuitive: Between-Person Variance is in thenumerator, but the ICC is the correlation over time!Lecture 1ICC BTW / BTW withinICC btw / btw WITHINÆ Large ICCÆ Small ICCÆ Large correlation over timeÆ Small correlation over time32
BP and WP Conditional Models Multiple Regression, Between-Person ANOVA: 1 PILE¾¾ yi ( 0 1Xi 2Zi ) eiei Æ ONE residual, assumed uncorrelated with equal varianceacross observations (here, just persons) Æ “BP (all) variation”Repeated Measures, Within-Person ANOVA: 2 PILES¾¾¾yti ( 0 1Xi 2Zi ) U0i etiU0i Æ A random intercept for differences in person means,assumed uncorrelated with equal variance across personsÆ “BP (mean) variation” ૌ ܃ is now “leftover” after predictorseti Æ A residual that represents remaining time-to-time variation,usually assumed uncorrelated with eq
package utilized for instruction will be STATA, but examples using SPSS and SAS will also be provided. Participants should be familiar with the general linear model, but no prior experience with multilevel models or knowledge o