Transcription
Pandemic twist and inflation challenge marketsRisk appetite proved resilient during most of the review period, but a wake-up callfrom renewed Covid-19 concerns curtailed the gains in late November.1 Before thenews of a new and threatening virus strain emerged, equity indices had risen stronglyin many advanced economies (AEs). Corporate credit spreads in AEs had remainedcompressed, with issuance close to past records, indicating that financial conditionswere still exceptionally accommodative. Government bond yields had increased,particularly sharply at the short end, as investors wrestled with fluid prospects ofincreased inflation and a removal of monetary accommodation. Government bondyields had also risen in emerging market economies (EMEs), as the fall in theircurrencies’ value against a broadly appreciating US dollar revealed concerns abouttheir economic outlook.After what had been a strong quarter in most markets, stocks suffered importantlosses late in the review period. Equity prices in AEs, especially the United States, hadclimbed on the back of continued strength in both realised and expected earnings.However, the perceived risk of sharp corrections – as implied by option prices –remained elevated, pointing to persistent investor unease. The correction thateventually shook markets at the end of the period erased part of the previous gainsin the United States, and left most other markets flat or with some losses.Resilient risk appetite sustained strong corporate credit through the period.Bond spreads were almost as narrow as at any time since 2010, even for companiesat the lower end of the ratings spectrum, although they widened in late November.Investment grade issuance remained strong, while that in the high-yield segmentapproached record highs. Exceptionally easy credit conditions prevailed beyondpublic markets, especially in the demand for cryptoassets and the private capitalmarkets that serve smaller and startup borrowers.Yield curves in AEs rose and flattened, as short-term yields surged midwaythrough the review period, amid sometimes disorderly trading conditions. Centralbanks in AEs continued dialling down the extraordinary support required by thepandemic, but they generally maintained cautious guidance for the short andmedium term. The apparent disconnect between this guidance and the sharp movesin front-end yields raised questions about whether investors disagreed on theoutlook for inflation or on the most likely policy response, or whether other factorswere at play, such as the forced unwinding of leveraged positions.Financial conditions continued to tighten for many EMEs. Government bondyields rose, especially outside emerging Asia. US dollar strength, which intensified atend-November, also contributed to the tightening and added to inflationarypressures. This worsened monetary policy trade-offs, especially for countriesgrappling with pandemic-related challenges against a background of limited fiscalspace. The stability of the Chinese renminbi stood out, despite the headwinds from aweakening growth outlook amid challenges for its real estate sector.1The period under review is from 13 September to 29 November 2021.BIS Quarterly Review, December 20217
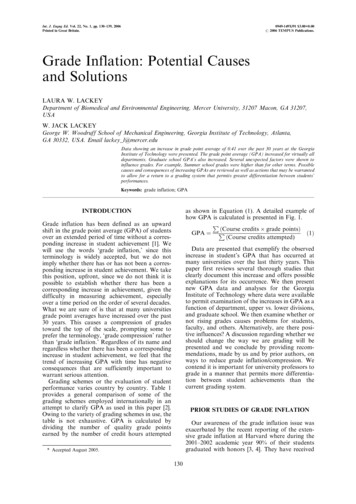
Key takeaways Advanced economies’ equity and corporate credit markets remained well supported, but sentimentwas curtailed by concerns over a new virus variant as the period drew to a close. Government bond markets saw sharp yield moves, particularly at the front end, as investors’expectations for short-term rates diverged from central bank guidance. US dollar strength added to tightening financial conditions in several emerging market economies,where monetary authorities continued to fight persistent inflationary pressures.Risky assets rise on earnings strengthGlobal markets for risky assets had proved resilient during the period under review,before the resurgence of virus concerns at end-November. Equity markets had postedmaterial gains, which were curtailed or fully erased on the news at the end of theperiod. Conditions were brisk in corporate credit markets, where issuance and pricingremained very supportive, despite the later souring of investors’ sentiment.Stock markets in AEs gained on strong earnings before the virus-induced setbackAE equity prices surged on strong expectedearningsImplied volatility spiked,tail risk remained elevated1 Jan 2021 100Per cent% pts12416351701181530160Graph 1Returns lagged in somekey sectors in China6Index45 215130941110120Q1 21 Q2 21 Q3 21 Q4 21S&P 500Other AEs1, 2Shanghai SE1, 3Other EMEsQ1 21 Q2 21 Q3 21 Q4 21Expected EPS growth:4DE5USQ1 21CommsCons �2010Q3 21VIX (lhs)SKEW (rhs)10IndustrialsShanghai SE year-to-datereturns (in %)30203040MSCI World year-to-datereturns (in %)The vertical line in the first panel indicates 13 September 2021 (start of period under review). The dashed lines in the third panel indicate2010–current medians.1GDP and PPP exchange rate weighted-average. 2 AU, CA, CH, DK, GB, NO, NZ and SE. 3 BR, CL, CO, CZ, HK, HU, ID, IN, KR, MY, MX, PE,PH, PL, RU, SG, TH, TR and ZA. 4 Growth of expected earnings per share (EPS) between end-2020 and end-2023. 5 On 23 September theDAX index added 10 members, applying a selection criterion based on market capitalisation. For consistency, pre-22 September data areadjusted to match the new post-22 September level. 6 Based on local currency-denominated stock indices.Sources: IMF; OECD; Bloomberg; Datastream; BIS calculations.8BIS Quarterly Review, December 2021
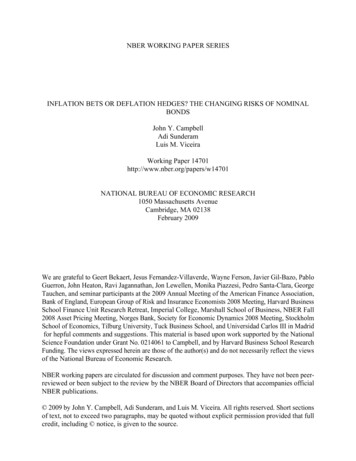
After a faltering start, equity markets gained strong momentum before recoilingat end-November. Early in the review period, stock prices lost ground in mostjurisdictions, as persistent pressure on supply chains and rising commodity pricesweighed on risk-taking (Graph 1, first panel). In AEs, particularly the United States,equity markets subsequently rebounded on the back of sustained strength inexpected earnings (second panel). This positive turn also temporarily boosted thestock prices of EMEs other than China. However, tail risks still loomed large forinvestors. During most of the review period, perceived downside risk – as derivedfrom option prices – remained high by historical standards (third panel, solid anddashed blue lines). Implied volatility, in turn, spiked when the emergence of theOmicron variant of Covid-19 made the downside risk more tangible (solid red line).The news erased gains in most markets, hitting sectors such as energy, financials, andindustrials particularly hard. The S&P 500, however, still managed to end the reviewperiod with some gains.Stock markets were subdued in China, staying largely detached from globaltrends. Developments in real estate markets and the policy pivot towards greaterstate oversight of key economic activities compounded concerns about slowinggrowth. Accordingly, the sectors with the most solid performance year-to-dateglobally (IT, real estate, financials) suffered valuation losses (Graph 1, fourth panel).The exceptions were energy, materials and industrials, where performance was in linewith global benchmarks.The corporate bond market remained buoyant, especially in its riskiest segments,notwithstanding the recent virus-induced spike. Spreads on investment grade (IG)and high-yield (HY) corporate bonds remained below historical norms in both theUnited States and the euro area, (Graph 2, first panel). For individual rating categories,spreads stayed at the lower end of their post-Great Financial Crisis (GFC) distributionBrisk corporate credit markets supported record issuance by lower-rated firmsDespite recent spike, also across the ratingsspreads were compressed distributionIssuance remained robust,especially in HY segmentBasis pointsUSD bnBasis pointsBasis pointsIG (lhs)Basis pointsGlobal private market dealskept increasingUSD bnIG (lhs)HY (rhs)Graph 2USD bnHY 1000000Q1 21Q3 21A BBB BB B CCCIG (rhs):HY (lhs):United StatesUS median1Europe1Europe median2Corporate spreadsLatest:ABBBBBBCCCCorporate bond issuance:2010–19 average20203202111 13 15 17 19 214Capital invested:Venture and growth capitalPrivate credit12010–current. 2 Whiskers show fifth and 95th percentiles; data starting in 2010. The corporate spreads displayed are the GDP and PPPexchange rate-weighted average of euro area and US ICE BofA Corporate spread indices. 3 For 2021, issuance data up to 29 November,projected to the full fourth quarter. 4 Data for Q3 2021 are still preliminary.Sources: Bloomberg; Dealogic; ICE BofAML indices; Pitchbook; BIS calculations.BIS Quarterly Review, December 20219
(second panel). Likewise, after a strong third quarter, corporate debt issuance rosecomfortably above the average of the pre-pandemic decade (third panel). Inparticular, HY issuance in both the United States and the euro area surpassed the2020 peaks on an annualised basis. Against this background, a record 80% ofcorporate bonds outstanding is currently rated BBB (ie just above HY) or below (HY),up from 75% in 2009.The exceptionally easy financial conditions in credit markets were visible beyondcorporate bonds, which are usually tapped by large companies. Indeed, the privatecredit markets, which serve smaller – typically, highly leveraged – borrowers, alsosustained their post-GFC momentum (Graph 2, fourth panel; see also Aramonte andAvalos (2021, in this issue)). These strong flows continued while survey data indicateda material increase in non-performing loans (from nearly 1% in 2018 to 3% in 2020),declines in estimated recovery rates and a higher likelihood of covenant suspensionsand acceptance of payment-in-kind. Resilient risk appetite extended beyondtraditional finance, generating a growing demand for cryptoassets. Hence theintroduction of the first bitcoin exchange-traded fund in the United States (Box A)and the continued startling growth in decentralised finance (see Aramonte et al(2021) in this issue).Yield curves wobble amid unusual volatilityDuring most of the review period, while corporate asset markets remained ebullient,government bond markets saw significant volatility and heightened illiquidity. Tworelated developments characterised the path of fixed income markets: an apparentdisconnect between central bank policy guidance and front-end rates that surfacedin October; and wide fluctuations in the shape of yield curves. As the review perioddrew to an end, the emergence of the new variant added some volatility to yields, butdid not materially affect the disconnect – which had already narrowed somewhat.Central banks in the largest AEs began to gradually lift the extraordinarymeasures deployed during the pandemic, while remaining on a cautious watch. InNovember, the Federal Reserve confirmed the widely anticipated beginning of itstapering of asset purchases, while the Bank of Canada stopped its securitiespurchasing programme altogether. The ECB had already indicated in December 2020that purchases under the Pandemic Emergency Purchasing Programme (PEPP) wouldlast at least until March 2022. Yet most major central banks indicated that the policyrate lift-off, while drawing closer, would not start soon, given the pandemic’s lingeringeffects. Furthermore, they repeatedly stressed that the increase in inflation wastransitory, even if more protracted than originally anticipated.In the wake of a cluster of CPI releases in early October, fixed income marketsswung and began pricing in policy rate hikes well in advance of central bank guidance.The extent of the gap can be assessed by comparing the time to lift-off implied bysurveys of professional forecasters – typically well attuned to central bankcommunication – with that implied by overnight index swap (OIS) rates. While thetwo sets of expectations were perfectly aligned for most AEs in June (Graph 3, lefthand panel, blue dots on the 45-degree line), by late October OIS rates suggestedthat the first hike would occur much earlier than forecasters anticipated (red dotsbelow the 45-degree line). The gap became particularly large in the case of Australiaand the euro area, where the time to lift-off implied in OIS was less than half of thatimplied by surveys.10BIS Quarterly Review, December 2021
Box ALaunch of the first US bitcoin ETF: mechanics, impact, and risksKaramfil Todorov The first US bitcoin (BTC) exchange-traded fund (ETF), “BITO”, started trading on 19 October 2021. The funddebuted as one of the most heavily traded ETFs in market history, attracting more than 1 billion in assets inthe first few days. Subsequently, the ETF accumulated a significant share of all short-term bitcoin futurescontracts, reaching about one third of the underlying futures market just 10 days after its launch (Graph A, firstpanel). This box explains how the futures-based structure of BITO differs from that of more traditional, nonfutures-based equity ETFs and analyses the possible implications for prices and risks.BackgroundSo far, the Securities and Exchange Commission (SEC) has delayed or declined applications to launch an ETFinvesting directly in bitcoin, due mainly to concerns that the asset is predominantly traded on non-regulatedexchanges. BITO is the first SEC-approved bitcoin ETF, largely because the fund is based on futures contractsthat are traded on the regulated Chicago Mercantile Exchange (CME).A futures contract is a legal agreement to buy or sell a particular asset at a predetermined price at aspecified time in the future. Such a contract allows investors to take positions without holding the underlyingasset. Since holding that asset gives rise to cost of carry – which may be positive in the presence of storagecosts or negative due to a convenience yield – the futures price is typically different from the asset’s spot price.In the particular case of BITO, the asset is bitcoin and the cost of carry tends to be positive, thus implying thatthe futures price is generally above the spot price, and that the futures curve tends to be upward-sloping (longterm futures contracts are more expensive than short-term ones).How it worksTo obtain bitcoin exposure, BITO enters into long positions in near-term (one-month) CME bitcoin futurescontracts. As the contracts near expiration, the fund gradually sells them and buys longer-dated contracts – astrategy called “roll”. In addition, BITO holds a liquid pool of cash or cash equivalents, such as Treasury bills(Graph A, second panel). When the bitcoin price goes up, BITO uses the gains from the futures contract toexpand its liquid pool. Conversely, when the bitcoin price goes down, BITO uses some of its liquidity to pay forthe losses on the futures contract. This structure is different from that of traditional bond or equity ETFs, whichsimply hold bonds and stocks, but is similar to the way commodity or VIX ETFs are structured (Table A).Futures-based ETFs vs. more standard equity and bond ETFsTable AFutures-based ETFs (eg, bitcoin or commodities)Standard ETFs (eg, equity or bond)HoldingsFutures contracts and cash equivalentsPhysical stocks/bondsCreations and redemptionsPredominantly in cashPredominantly in-kindRebalancingFrequent, due to expiring futures contractsRare, except for inflows/outflowsPerformance relative to spotUnder/outperforms if futures curve isupward/downward-slopingSimilar, up to a tracking errorSource: Author’s elaboration.The rebalancing strategy of BITO can erode performance over time in a similar way to that seen in othercommodity futures-based ETFs. Facing an upward-sloping futures curve, BITO pays “roll costs” when itrebalances its positions by selling expiring short-term contracts to buy long-term ones. Commodity futuresbased ETFs provide examples of substantial cumulative erosion due to an upward-sloping futures curve(Graph A, third panel). Likewise, had it been launched in 2018, BITO would have underperformed spot prices byabout 18% on a cumulative basis over the following four years to date (fourth panel).BIS Quarterly Review, December 202111
Futures-based bitcoin ETF: share of the market, holdings and performanceBITO quickly became a keyplayer in the market1The ETF holds futures andcash equivalents22825Oct 21Hypothetical BTC futuresbased ETF vs spot3USD mn1 Jan 2010 10012 Feb 2018 00002m BTC futures313m Treasury348.5m Treasury376.5m Treasury401m BTC futuresPer centUnderperformance of gasfutures-based ETF vs spotGraph ANov 212011Market share2014ETF20172020Spot20202021Futures-based rollTotal dollar position of the first US bitcoin (BTC) exchange-traded fund (ETF) BITO in the nearest two futures contracts divided by the totaldollar open interest in those contracts. 2 Holdings as of 4 November 2021. Futures holdings are reported in terms of exposure values;Treasury holdings are reported as market values. The chart excludes “net other assets/cash”. 3 For better visibility, the graph starts inJanuary 2020. The vertical line marks the launch of BITO (19 October 2021). For the period before the launch, the ETF return is approximatedwith a rolling futures position that rolls over a period of one week before expiration. Rolling over a week is a common strategy for manycommodity ETFs; see K Todorov, “Passive funds affect prices: evidence from the most ETF-dominated markets”, BIS Working Papers, no 952,July 2021. The bitcoin ETF does not have a clearly defined rolling period in the prospectus.1Sources: Bloomberg; author’s calculations.Impact on prices and risksIn general, a futures-based ETF is likely to affect prices in two main ways. The first effect works throughflow rebalancing: when an ETF buys futures contracts in response to inflows, it pushes futures prices up, andvice versa for outflows. The second effect works through calendar rebalancing: as the ETF gradually sells futurescontracts before expiration, their prices fall. At the same time, as the ETF buys longer-dated futures contracts,their prices increase. The predictable rebalancing behaviour of the ETF may also give rise to “front-running”incentives, motivating investors to purchase longer-dated bitcoin futures in anticipation of the ETF rolling intothose contracts. The price impact in the futures market can also spill over to spot prices through investors’hedging behaviour, especially for assets with physical settlements of the futures contract and large storagecosts. A prominent example is the drop of oil spot prices into negative territory in April 2020, when futuresbased ETFs probably contributed to the increase in storage costs and the subsequent decline in spot prices. The bitcoin ETF may amplify volatility in prices and create risks for investors if the fund is a large share ofthe futures market. Experience suggests that futures-based ETFs can exacerbate price movements and createadditional volatility when they have a large footprint in the underlying asset. For example, heavy ETF-inducedtrading unsettled VIX futures prices and contributed to the spike in VIX in February 2018. This led to investorlosses and subsequent delisting of the largest inverse VIX ETF. The trading by BITO could also spill over to fixedincome markets through its holdings of cash equivalents. If the ETF were to liquidate these instruments inresponse to bitcoin depreciation or excessive outflows, that could put pressure on bond markets. At present,BITO is unlikely to cause such disruptions, as it holds mostly highly liquid short-term Treasuries and it is smallrelative to the market for these instruments. The views expressed are those of the author and do not necessarily reflect the views of the BIS. The author thanks Claudio Borio,Stijn Claessens and Nikola Tarashev for valuable comments. Spot-based bitcoin ETFs predated BITO in several non-USjurisdictions, including Canada and some European countries.to demand from investors using futures to lever up. This is presumably due to a negative convenience yield, related See K Todorov, “Passive funds affect prices: evidence from the most ETF-dominated markets”, BIS Working Papers, no 952, July 2021. See S Aramonte and K Todorov, “Futures-based commodity ETFswhen storage is constrained”, BIS Bulletin, no 41, April 2021.12BIS Quarterly Review, December 2021
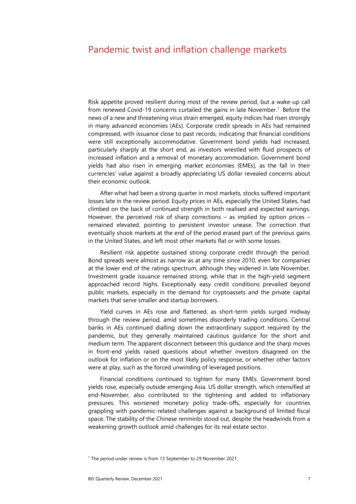
Markets and central banks do not see eye to eye on the policy rate path in AEsDivergent expectations regardingmonths to lift offUS GBCAAUNZUS102010AUNONOCAGBNZ30EA02030Surveys' expectation (in months)140Market expectation (in months)EAPer centPer cent0.51.40.00.7–0.50.0–1.0–0.7Q4 20 Q1 21 Q2 21 Q3 21 Q4 212yr government bond yields:USDEGBOther AEs430 June 202129 October 20212Long-term yields wiggle with theeconomic outlook345 Short-term yields surge as investorsreassess the path of inflationGraph 3Q4 20 Q1 21 Q2 21 Q3 21 Q4 2110yr government bond yields:USDEGBOther AEs4The shaded area in the centre and right-hand panels indicates 11–26 October 2021 (release of September 2021 CPI data).Based on Bloomberg’s weighted average of policy rate forecasts. 2 Date selected to capture markets’ reactions to the 11–26 October2021 cluster of CPI releases. The picture remains roughly unchanged also when considering market expectations as of 29 November2021. 3 Based on implied policy rates derived from OIS contracts. 4 Simple average across AU, CA, DK, NZ and SE.1Sources: Bloomberg; BIS calculations.The relative shift in lift-off expectations raised questions about an apparentdisconnect between central bank guidance and fixed income markets. Marketrepositioning aside (see below), such a disconnect could arise from differences inperceptions of the outlook – most notably as regards inflation – or amisunderstanding of central banks’ reaction function. In analysing these alternativeexplanations, Box B presents suggestive evidence supporting the former. As theperiod under review wore on, some central banks gradually pivoted to lessaccommodative guidance, which appeared to soften the disconnect with marketperceptions.The disconnect had a forceful expression at the front end of AE term structures.With mounting evidence that supply shortages and energy price surges sustained theinflationary momentum, short- to medium-term yields increased markedly after theCPI releases (Graph 3, centre panel). Indeed, under market pressure, the Reserve Bankof Australia abandoned its yield control programme in late October, a few days beforethe Board meeting in which monetary policy decisions are routinely taken. Yields fellsomewhat as the Omicron variant emerged in late November.Long-term yields also saw some volatility during the review period. They hadbeen on the rise since mid-August, particularly outside the United States (Graph 3,right-hand panel). In most AEs, 10-year yields had increased between 40 and 60 basispoints between August and early October, in a move that seemed to closely track thesudden increase in energy prices. As volatility took off in October at the front end ofthe yield curve (centre panel), longer yields eased, notably in the United Kingdom andthe United States.BIS Quarterly Review, December 202113
Box BFront-end yields and central bank guidance: what can explain the disconnect?Iñaki Aldasoro and Fernando Avalos , The increase in advanced economies’ front-end government yields between late September and late Octoberexhibited signs of a disconnect from central bank policy guidance. This is because central banks had expressed theview that inflationary pressures were temporary, and policy rate increases, according to their guidance, were still sometime away. In principle, two drivers could have accounted for the disconnect: investors’ disagreement with respect tocentral banks’ inflation outlook, or a misunderstanding of their reaction function. This box examines these driversand provides suggestive evidence that the disconnect was more likely to have stemmed from disagreements on theinflation outlook.The disconnect seems to hinge on the inflation outlookMarket reaction to inflation surprisesremains below pre-Covid normsGraph BThe impact of natural gas prices onbreak-evens has strengthenedBasis pointsBasis pointsPercentage points3.042.01.521.50.001.0–1.5–20.5–3.0Q1 21Q2 21Q3 21Inflation compensation divergedfurther from central bank projectionsQ4 21Response of expected rates toinflation surprises190% confidence intervalPre-Covid average response20.0–4Q1 21Q2 21Q3 21Q4 21Impact of natural gas on:310yr break-evens:2yr break-evens:Median4Pre-Covid average2USDEGBDifference between forward inflation5compensation and CB projection as of:2-year:10-year:Projection release (Aug, Sep 2021)22 October 2021The shaded area in the centre panel indicates 20 August 2021–latest (period covering the rally in natural gas prices).Coefficient obtained from a panel regression of changes in expected policy rate 12-months ahead (OIS) on inflation surprises. Inflationsurprises are computed as the difference between reported inflation and Bloomberg’s average of survey forecasts. The regression includesGDP and unemployment rates as controls, as well as country fixed effects. Coefficients are estimated on six-month rolling windows, with aone-month jump between windows. 2 Based on data from January 2017 to January 2020. 3 Based on vector autoregressions includingthe two- or 10-year break-evens and natural gas prices (in logs). The lines depict the respective semi-elasticities of break-evens with respectto natural gas prices. Coefficients are estimated on windows of 120 trading days, with a 20-day jump between windows. 4 Median coefficientof a sample of four AEs (AU, DE, IT and US) for two-year break-evens, and eight AEs (AU, CA, DE, GB, IT, JP, NZ, and US) for 10-year breakevens. 5 The forward inflation rates are based on zero coupon inflation swaps: for the two-year horizon, this corresponds to the one-year/one-year forward rate, while for the 10-year horizon this corresponds to the nine-year/one-year forward rate. Central banks’ projections areobtained from the FOMC Summary of Economic Projections (22 September 2021) for US, the ECB Economic Bulletin issue 6 (23 September2021) for DE and the BoE Monetary Policy Report (5 August 2021) for GB.1Sources: Bank of England; Board of Governors of the Federal Reserve System; ECB; Federal Reserve Bank of St Louis, FRED; Bloomberg; nationaldata; authors’ calculations.14BIS Quarterly Review, December 2021
The shifts in advanced economies’ (AEs) fixed income markets did not appear to be driven by any questioning ofcentral bank guidance. If investors doubted the guidance, inflationary surprises – ie differences between realisedinflation and the market consensus expectations – would have raised market-implied measures of expected policyrates. In fact, the sensitivity of such a measure (12 months ahead) to inflation surprises has been close to zerothroughout this year (Graph B, left-hand panel, solid line). Indeed, this sensitivity was much lower than before thepandemic, when most central banks were on a path to normalising monetary conditions (dashed line). Taken at facevalue, these findings suggest that investors seemed convinced that, by and large, central banks were sticking to theirguidance by “looking through” short-term inflation realisations.By contrast, the outlook for inflation seems to loom large in bond market pricing. Inflation compensation (orbreak-evens) across AEs was particularly sensitive to changes in energy prices in recent months, notably in the wakeof the extraordinary rally in the price of natural gas. The sensitivity of AE inflation break-evens to gas prices – whichcan drive inflationary pressures through wholesale electricity costs – has become much larger in recent months thanin the pre-Covid period (Graph B, centre panel, solid vs dashed lines). Remarkably, both short- and long-term breakevens have shown a large sensitivity to the price of this energy source, in turn suggesting that investors wereconcerned not only about the immediate impact of gas prices but also about the lingering effects. The material increase in the gap between inflation compensations – as captured by break-even rates – and centralbank inflation projections during October can be seen as a further indication of disagreement on the outlook. Therelatively large widening of the gap in October (Graph B, right-hand panel) points to a significant change in the attitudeor perceptions of investors with regard to the inflationary outlook. That change seems to have transpired irrespectiveof the magnitude of the inflation surprises observed in October. The variations in an already complex inflationaryoutlook reduced investors’ incentives to hold nominal bonds that were providing deeply negative yields in real terms(ie after inflation). The views expressed are those of the authors and do not necessarily reflect the views of the NikolaTarashevfor The authors thank Claudio Borio,helpfulcommentsanddiscussions. Granted, price shifts due to investor repositioning, or other technical issues reflected in impaired arbitrage, may have exacerbated thedisconnect. Other bottlenecks may be playing a role in the surge of inflation compensation as well, especially the shortage ofsemiconductors constraining several areas of manufacturing, and logistical bottlenecks that brake international trade and clog global valuechains. See D Rees and P Rungcharoenkitkul, “Bottlenecks: causes and macroeconomic implications”, BIS Bulletin, no 48, November 2021.Yield curves whipsawed as action shifted between the two ends of the termstructures. In a matter of a few days following the CPI news in October, term structuresthat had been steepening over several weeks suddenly flattened, compressing termspreads to the levels prevailing in mid-year (Graph 4, first panel). The additionalswings caused
1 Jan 2021 100 Per cent % pts Index The vertical line in the first panel indicates 13 September 2021 (start of period under review). The dashed lines in the third panel indicate 2010–current medians. 1 GDP and PPP exchange rate weighted-average. 2 AU, CA, CH, DK, GB, NO, NZ