Transcription
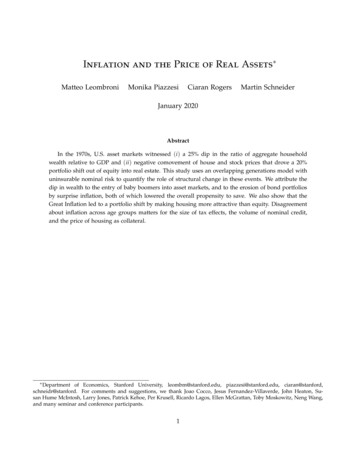
Int. J. Engng Ed. Vol. 22, No. 1, pp. 130 139, 2006Printed in Great Britain.0949-149X/91 3.00 0.00# 2006 TEMPUS Publications.Grade Inflation: Potential Causesand SolutionsLAURA W. LACKEYDepartment of Biomedical and Environmental Engineering, Mercer University, 31207 Macon, GA 31207,USAW. JACK LACKEYGeorge W. Woodruff School of Mechanical Engineering, Georgia Institute of Technology, Atlanta,GA 30332, USA. Email lackey l@mercer.eduData showing an increase in grade point average of 0.41 over the past 30 years at the GeorgiaInstitute of Technology were presented. The grade point average (GPA) increased for virtually alldepartments. Graduate school GPA's also increased. Several unexpected factors were shown toinfluence grades. For example, Summer school grades were higher than for other terms. Possiblecauses and consequences of increasing GPAs are reviewed as well as actions that may be warrantedto allow for a return to a grading system that permits greater differentiation between students'performances.Keywords: grade inflation; GPAas shown in Equation (1). A detailed example ofhow GPA is calculated is presented in Fig. 1.PCourse credits grade points GPA P1 Course credits attempted)INTRODUCTIONGrade inflation has been defined as an upwardshift in the grade point average (GPA) of studentsover an extended period of time without a corresponding increase in student achievement [1]. Wewill use the words grade inflation,' since thisterminology is widely accepted, but we do notimply whether there has or has not been a corresponding increase in student achievement. We takethis position, upfront, since we do not think it ispossible to establish whether there has been acorresponding increase in achievement, given thedifficulty in measuring achievement, especiallyover a time period on the order of several decades.What we are sure of is that at many universitiesgrade point averages have increased over the past30 years. This causes a compression of gradestoward the top of the scale, prompting some toprefer the terminology, grade compression' ratherthan grade inflation.' Regardless of its name andregardless whether there has been a correspondingincrease in student achievement, we feel that thetrend of increasing GPA with time has negativeconsequences that are sufficiently important towarrant serious attention.Grading schemes or the evaluation of studentperformance varies country by country. Table 1provides a general comparison of some of thegrading schemes employed internationally in anattempt to clarify GPA as used in this paper [2].Owing to the variety of grading schemes in use, thetable is not exhaustive. GPA is calculated bydividing the number of quality grade pointsearned by the number of credit hours attemptedData are presented that exemplify the observedincrease in student's GPA that has occurred atmany universities over the last thirty years. Thispaper first reviews several thorough studies thatclearly document this increase and offers possibleexplanations for its occurrence. We then presentnew GPA data and analyses for the GeorgiaInstitute of Technology where data were availableto permit examination of the increases in GPA as afunction of department, upper vs. lower divisions,and graduate school. We then examine whether ornot rising grades causes problems for students,faculty, and others. Alternatively, are there positive influences? A discussion regarding whether weshould change the way we are grading will bepresented and we conclude by providing recommendations, made by us and by prior authors, onways to reduce grade inflation/compression. Wecontend it is important for university professors tograde in a manner that permits more differentiation between student achievements than thecurrent grading system.PRIOR STUDIES OF GRADE INFLATIONOur awareness of the grade inflation issue wasexacerbated by the recent reporting of the extensive grade inflation at Harvard where during the2001 2002 academic year 90% of their studentsgraduated with honors [3, 4]. They have received* Accepted August 2005.130
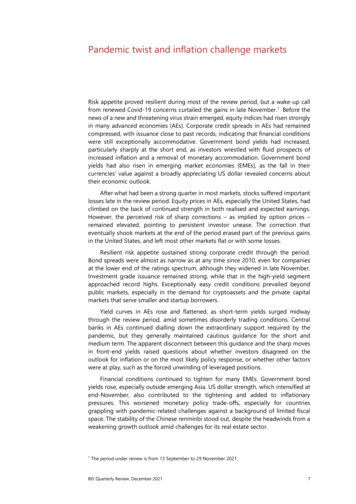
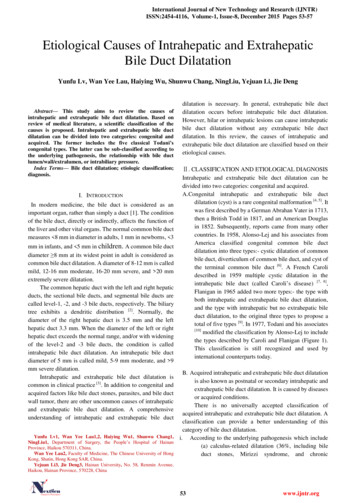
Grade Inflation: Potential Causes and Solutions131Table 1. Summary of selected international university level grading schemes [2]Country or RegionGrading ScaleScale SummaryUnited States, Canada, England, WalesA F systemA excellentB goodC averageD poorF failureArgentina1 10 scale10 excellent8 9.99 very good6 7.99 good4 5.99 sufficientUp to 3.99 insufficientChile1 7 scale7.0 excellent6 6.9 very good5 5.9 very good4 4.9 sufficient1 3.9 insufficientFinland0 5Fail/Pass0 fail1 5 passInternational BaccalaureateInteger 1 7 scale7 highest grade4 lowest passing gradeSwedenMost universities letter gradeEngineering colleges and universities numericVG passed with distinctionG passedU failed3 5 (5 is highest grade)U failRussia, Ukraine, Hungary, Poland5-point scale5 excellent4 good3 satisfactory or average2 unsatisfactory1 poorFrance, Belgium, Peru20-point scale20 best possible11 lowest passing gradeCroatia5-point scale5 excellent4 very good3 good2 sufficient1 insufficientDenmark10-point scale ranging from 00 to 1313 excellent8 average performance6 minimum passing grade00 completelyunacceptableGermany6-point scale1 excellent2 good3 satisfactory4 sufficient5 unsatisfactory6 poorItaly30-point scale18 30 passing0 17 non passingThe Netherlands10-point scale10 best score5.5 lowest passing gradethe brunt of the bad press' on grade inflation, eventhough grade inflation, or at least an increase inGPA, is well documented for a large number ofhighly respected universities. One readily availablesource, a Website, shows data for over 30 universities covering time spans of up to 35 years [5]. TheGPAs at these universities have increased by about0.15 per decade and the results are summarized inFig. 2 [5]. The figure summarizes GPA recordsfrom 20 public universities as well as GPA datafrom both Harvard and Princeton as both privateschools have recently been the focus of much presscoverage. In an effort to ensure academic integrityand to combat inflated GPAs, both private schoolshave recently chosen to act by implementing newgrading policies that limit the number of A'sawarded to students, and at Harvard the numberof students eligible to graduate with honors [4, 6].Numerous other studies document increases inGPA [see references 3, 7-10]. A report by the
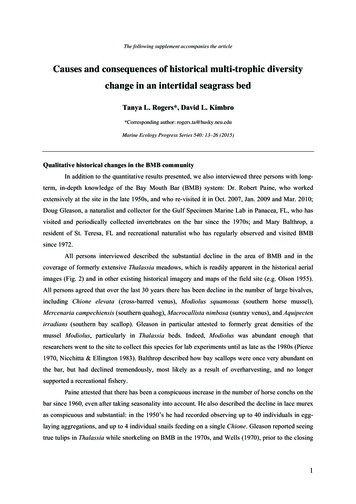
132Laura W. Lackey and W. Jack LackeyFig. 1. Detailed example of Grade Point Average (GPA) calculation.American Academy of Arts and Sciences [10]summarizes several studies involving 180 universities and surveys of over 50,000 students showsimilar increases in GPAs. Others present datathat indicate that if all of the colleges and universities in the nation were considered, there wouldnot, on average, be an increase in GPA over time[11]. Nevertheless, it is clear that an undeniableincrease in GPA has occurred at many prestigiousuniversities. We will not enter into the discussionas to whether a corresponding increase in studentachievement has occurred. This has already beenthoroughly discussed by a number of prior authors[10, 12].GRADE INFLATION AT GEORGIA TECHStudent GPAs, or grades on an A F scale thatwere readily convertible to GPA, and FreshmenFig. 2. Nationwide Trends in Grade Inflation. Public university data is the mean GPA based on 1968 2001 data at: Alabama, Arizona,Auburn, Central Michigan, University of Chicago, University of Colorado, University of Florida, Iowa State, University of Missouri,University of North Carolina Chapel Hill, Michigan, Northern Michigan, Ohio State, Southern Illinois University, University ofTexas, Utah, Western, University of Wisconsin Madison, and Washington State.
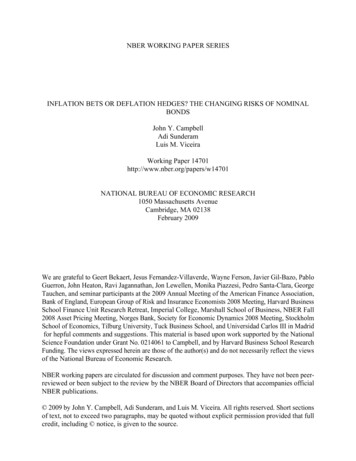
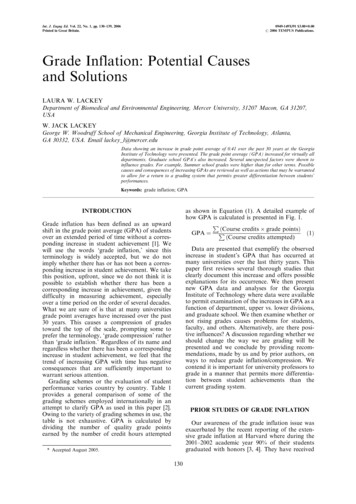
Grade Inflation: Potential Causes and Solutions133Fig. 3. Georgia Tech Fall Term undergraduate cumulative GPA.SAT scores were available from the Fact Book,which is published annually and shelved in theGeorgia Tech library [13]. The SAT is a trademarkfor a standardized college admissions exam. In theUnited States, The College Board administers theexam and their Website provides additional information about the program [14]. Georgia Tech'sGPA scale is based on an A yielding a GPA of 4.0.The available data dates back to 1977 and permitanalyses based on discipline, lower level (Freshmenplus Sophomores), upper level (Juniors plusSeniors), graduate school, and other groupings.Other data, back to 1972, were compiled andmade available by the Georgia Tech Office ofInstitutional Research and Planning.The Fall term cumulative GPA across the entireuniversity are plotted in Fig. 3. The average GPAhas increased 0.41 over 30 years, or 0.14 perdecade. The increase is very similar to the valuequoted previously for many other universities. ForFig. 4. Undergraduate GPA vs. Year for five disciplines. For clarity, there are three (Fall, Winter, Summer) semester and four (Fall,Winter, Spring, Summer) quarter terms within an academic year.
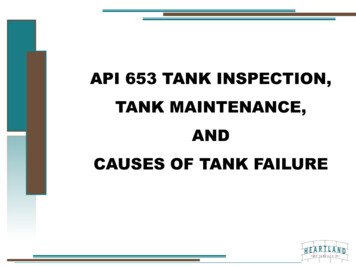
134Laura W. Lackey and W. Jack LackeyFig. 5. Undergraduate engineering GPA increased 0.08 per decade.example, the average GPA at Harvard and Princeton has increased per decade by 0.14 and 0.11,respectively. A study performed by a universitycommittee provides additional detail [7]. The latterstudy shows that the percentage of A's hasincreased. For example, for the undergraduatesfrom 1992 to 2001, the percent of A's increasedfrom 31.6 to 37.8. During the same time period, thepercent of B's, C's, and D's decreased from 35.6 to34, 23.3 to 19, and 6.4 to 5.7, respectively. Therewas a slight increase in F's, 3 to 3.6 percent. Avariety of other universities have observed asimilar trend.Figure 4 shows undergraduate GPA for architecture, college of computing, college of science,Ivan Allen college (management), and the collegeof engineering. These are GPA's for grades givenfor courses taught in those colleges. For example,the engineering GPA's do not include courses thatengineering students took in English, etc. With theexception of the college of computing (for whichthere is less data), the GPAs have drifted upwardsince 1977.A large fraction of the students at Georgia Techare enrolled in engineering. The undergraduateengineering GPA is plotted in Fig. 5. The dataFig. 6. Georgia Tech engineering courses GPA and freshmen SAT scores.
Grade Inflation: Potential Causes and Solutionsare for the Fall term and are weighted. That is, agrade of A' in a four-hour course has the sameimpact on GPA as four A's' in one-hour courses.The shape of the curve is somewhat similar tothose in Fig. 2. The GPA may have decreasedfrom the mid-1970's to the mid-1980's, but sincethen, there has generally been an increase in GPA.Overall, there has been an increase of 0.08 perdecade. The sharp drop in GPA for Fall 1999 ispresumed to be due to the quarter to semesterconversion. Both faculty and students reporteddifficulty in adjusting to the change. The effect ofconverting to semesters can also be seen in Figs. 3and 4. Whatever the cause for the abrupt decreasein GPA, the effect was short-lived, since the GPAshad risen to above the pre-1999 levels by 2002.A comparison of the GPA's of the engineeringstudents with the Fall term Freshmen engineeringSAT scores is presented in Fig. 6. It is clear thatboth the GPAs and SAT scores have increased, butone cannot say with any confidence that the higherSAT scores are responsible for the high GPAs.Many prior studies have shown that SAT scoresare not strongly correlated with student achievement [15].Figure 7 shows the Fall term, weighted GPAsfor the lower level and upper level engineeringstudents since 1973. The lines shown are leastsquare fits. The GPA's for the lower level engineering courses did not increase significantly, whileon average, the GPA's for the upper level coursesincreased 0.10 per decade.The weighted Fall term GPAs for mechanicalengineering courses are compared with Fall termGPAs for all engineering courses in Fig. 8. The135trends are very similar. Figure 9 shows themechanical engineering data divided into lowerand upper levels. There is no statistically significant trend for the lower level GPAs, but the GPAsfor the upper level mechanical engineering coursesincreased 0.11 per decade. There is greater than99% confidence that an increase has occurred.Figure 10 shows that grades tend to be higherduring Summer school. The plot is for mechanicalengineering undergraduate courses. Data were alsoavailable for mechanical engineering graduateschool courses. Figure 11 shows that the GPAincreased 0.10 0.03 per decade, where the uncertainty reflects the 95% confidence interval.REASONS FOR GRADE INFLATIONAt the onset of this project, our goal was toidentify causes for grade inflation. After analyzingthe Georgia Tech archival data and the abundanceof literature on the topic, we concluded that thereare insufficient data to definitely identify realcauses. Fortunately, possible causes have alreadybeen identified and discussed by several authors.Below, we briefly list possible causes without anyattempt to rank, justify, or discredit them. In someinstances, references that provide a discussion areprovided.1. Better students, higher SAT and ACT scores[8, 10, 11]. (The ACT is an acronym for American College Test' and is used to determine a student's readiness for college levelcoursework [16].)Fig. 7. GPA vs. Year for lower level and upper level engineering students.
136Laura W. Lackey and W. Jack LackeyFig. 8. Comparison of mechanical engineering undergraduates to Georgia Tech engineering undergraduates.2. Worse students, lower SAT scores, a largerpercentage of population attending university.This is offered as evidence that students arenot better, so grade inflation is occurring [3,10, 12].3. Professors influenced by desire for goodcourse evaluations by students [8, 10, 17].4. Salary, promotion, and tenure influenced bycourse evaluation by students.5. Fewer credit hours taken [8, 12].6. Fewe
from 20 public universities as well as GPA data from both Harvard and Princeton as both private schools have recently been the focus of much press coverage. In an effort to ensure academic integrity and to combat inflated GPAs, both private schools have recently chosen to act by implementing new grading policies that limit the number of A’s awarded to students, and at Harvard the number of .