Transcription
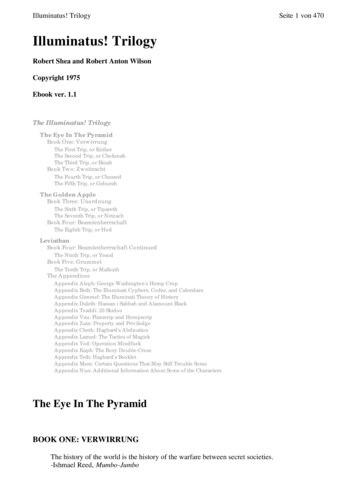
APPENDIX BTABLE B.1 Proportions of Area under the Standard Normal Curve: The Unit Normal TableColumn (A) lists z-score values. Column (B) lists proportion of the area between the mean and the z-score value. Column (C) liststhe proportion of the area beyond the z-score in the tail of the distribution. (Note: Because the normal distribution is symmetrical,areas for negative z-scores are the same as those for positive z-scores.)(A)z(B)Area BetweenMean and z(C)(A)AreaBeyond zin Tailz(B)(C)(A)Area BetweenMean and zAreaBeyond zin Tailz(C)AreaBeyondz in Tail(A)z(B)AreaBetweenMean and z(C)AreaBeyondz in Tail(A)z(B)AreaBetweenMean and 0.49200.03.01200.04(B)Area BetweenMean and z(C)AreaBeyond zin Tail(A)z(B)AreaBetweenMean and z(C)AreaBeyondz in 590.44.1700.3300629
630STATISTICS FOR THE BEHAVIORAL SCIENCES(A)z(B)AreaBetweenMean and z(C)AreaBeyondz in Tail(A)z(B)AreaBetweenMean and z(C)AreaBeyondz in Tail(A)z(B)AreaBetweenMean and z(C)AreaBeyondz in 7.2794.22061.10.3643.13571.43.4236.0764
APPEN D I X B S TAT I S T I C AL TAB L ES(A)z(B)AreaBetweenMean and z(C)AreaBeyondz in Tail(A)z(B)AreaBetweenMean and z(C)AreaBeyondz in 4279.07211.47.42921.48631(A)z(B)AreaBetweenMean and z(C)AreaBeyondz in 817.01832.42.4922.0078
632STATISTICS FOR THE BEHAVIORAL SCIENCES(A)z(B)AreaBetweenMean and z(C)AreaBeyondz in Tail(A)z(B)AreaBetweenMean and z(C)AreaBeyondz in Tail(A)z(B)AreaBetweenMean and z(C)AreaBeyondz in 9997.00003Source: Based on J. E. Freund, Modern Elementary Statistics (11th edition). Pearson Prentice Hall, 2004.
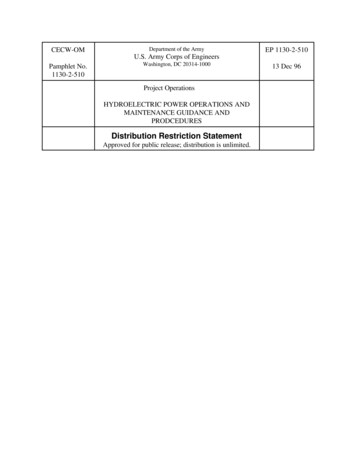
APPEN D I X B S TAT I S T I C AL TAB L ES633TABLE B.2 THE t-DISTRIBUTIONTable entries are values of t-corresponding to proportions in one tail or in two tails combined.One tail(either right or 2526272829304060120 .6830.6810.6790.6770.674Two tailscombinedProportion in One Tail0.100.050.0250.01Proportion in Two Tails Combined0.200.100.050.023.078 6.31412.70631.8211.886 2.9204.3036.9651.638 2.3533.1824.5411.533 2.1322.7763.7471.4762.0152.5713.3651.440 1.9432.4473.1431.4151.8952.3652.9981.397 1.86o2.3062.8961.383 1.8332.2822.8211.3721.8122.2282.7641.363 1.7962.2012.7181.356 1.7822.1792.6811.350 1.7712.1602.6501.345 1.7612.1452.6241.341 1.7532.1312.6021.337 1.7462.1202.5831.333 1.7402.1102.5671.330 1.7342.1012.5521.328 1.6992.0452.4621.310 1.6972.0422.4571.303 1.6842.0212.4231.296 1.6712.0002.3901.289 1.6581.9802.3581.282 e: Table III of R.A. Fisher and F. Yates, Statistical Tables for Biological, Agricultural and Medical Research, 6th ed. London:Longman Group Ltd., 1974 (previously published by Oliver and Boyd Ltd., Edinburgh). Adapted and reprinted with permission of theAddison Wesley Longman.
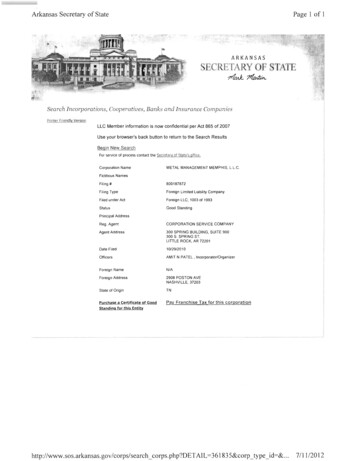
634STATISTICS FOR THE BEHAVIORAL SCIENCESTABLE B.3 Table entries indicate critical values for the F-distribution.Critcial values at a .05 level of significance are given in lightface type.Critcial values at a .01 level of significance are given in boldface type.Degrees of Freedom DenominatorDegrees of Freedom Numerator1234567891020 2.072.87
APPEN D I X B S TAT I S T I C AL TAB L ES635Degrees of Freedom DenominatorDegrees of Freedom Numerator1234567891020 1.912.511.591.88
636STATISTICS FOR THE BEHAVIORAL SCIENCESDegrees of Freedom DenominatorDegrees of Freedom Numerator1234567891020 .561.912.471.662.031.251.38 ce: The entries in this table were computed by the author.
APPEN D I X B S TAT I S T I C AL TAB L ESTABLE B.4 The Studentized Range Statistic (q)The critical values for q correspond to alpha .05 (lightface type) and alpha .01 (boldface 46.15637
638STATISTICS FOR THE BEHAVIORAL .744.114.904.265.044.395.154.505.234.595.34 284.994.395.084.475.16Source: The entries in this table were computed by the author.
APPEN D I X B S TAT I S T I C AL TAB L ESTABLE B.5 Critical Values for the Pearson Correlation**To be significant, the sample correlation, r, must be greater than or equal to the critical value in the table.Level of Significance for One-Tailed Test.05.025.01.005Level of Significance for Two-Tailed Testdf n - 39
640STATISTICS FOR THE BEHAVIORAL SCIENCESLevel of Significance for One-Tailed Test.05.025.01.005Level of Significance for Two-Tailed Testdf n - 2.267100.164.195.230.254Source: Table VI of R. A. Fisher and F. Yates, Statistical Tables for Biological, Agricultural and Medical Research, 6th ed. London:Longman Group Ltd., 1974 (previously published by Oliver and Boyd Ltd., Edinburgh). Adapted and reprinted with permission ofthe Addison Wesley Longman.
APPEN D I X B S TAT I S T I C AL TAB L ESTABLE B.6 Critical Values for the Spearman Correlation**To be significant, the sample correlation, r, must begreater than or equal to the critical value in the table.nLevel of Significance for One-Tailed Test.05.025.01.005Level of Significance for Two-Tailed 0.2450.2711000.1650.1970.2330.257Source: Reprinted with permission from the Journal of the American Statistical Association. Copyright 1972 by the AmericanStatistical Association. All rights reserved.641
642STATISTICS FOR THE BEHAVIORAL SCIENCESTABLE B.7 Critical Values of Chi-Square (χ2)Level of Significancedfa .05a rce: From Table IV of R. A. Fisher and F. Yates, Statistical Tables for Biological, Agricultural and Medical Research, 6th ed. London:Longman Group Ltd., 1974 Reprinted with permission of the Addison Wesley Longman Ltd.
6436789100.1170.234 0.273 0.274 0.246 0.2050.312 0.273 0.219 0.1640.1610.1640.1170.161Source: The entries in this table were computed by the author.“ ” relfects omited values for probabilities of 0.0005 or less.201918171615141312 15 16 17 18 19 200.1570.1210.1570.1830.1750.1960.175 0.1670.1840.167 0.1600.1760.1600.120 0.0010.001 0.002 0.0050.001 0.003 0.007 0.0150.002 0.006 0.012 0.022 0.0370.001 0.003 0.008 0.019 0.033 0.053 0.0740.002 0.006 0.014 0.028 0.047 0.071 0.096 0.1200.1440.1760.1760.1440.121 0.096 0.0740.003 0.010 0.022 0.042 0.067 0.094 0.1210.1480.1850.1850.1480.122 0.094 0.071 0.053 0.0370.001 0.005 0.016 0.035 0.061 0.092 0.1220.1520.1960.193 0.209 0.210 0.1960.1530.122 0.092 0.067 0.047 0.033 0.022 0.0150.121 0.087 0.061 0.042 0.028 0.019 0.012 0.007 0.0050.027 0.054 0.087 0.1220.002 0.01011 140.205 0.226 0.226 0.209 0.18390.008 0.031 0.0700.016 0.055 0.1090.004 0.018 0.044 0.08110 130.081 0.054 0.035 0.022 0.014 0.008 0.006 0.003 0.002 0.0010.032 0.094 0.164 0.219 0.246 0.246 0.226 0.1930.1560.312 120.010 0.005 0.003 0.002 0.001 110.109 0.070 0.044 0.027 0.016 0.010 0.006 0.003 0.002 0.001 0.0010.094 0.055 0.031 0.0180.312 0.234 0.1640.1560.032 0.016 0.008 0.004 0.002 0.0015Sample Size (n)87650.0620.250340.3762 0.250 0.3750.1250.2501 0.500 0.37540.06230.12520 0.250xTABLE B.8 Distribution of Binomial Probabilities When p 0.50
644STATISTICS FOR THE BEHAVIORAL SCIENCESTABLE B.9 Wilcoxon Signed-Ranks T Criticial Values*For values of T to be significant, T must be equal to or less than the critical value listed in the table for a given level of significance and samplesize n. Dashes (--) indicate that a decision is not possible.Level of Significance (Two-Tailed test)Level of Significance (One-Tailed 14011030137109151120Source: The entries in this table were computed by the author.
APPEN D I X B S TAT I S T I C AL TAB L ES645TABLE B.10A Critical Values of the Mann-Whitney U for a .05**Critical values are provided for a one-tailed test at a .05 (lightface type) and for a two-tailed test at a .05 (bold-face type).To be significant for any given nA and nB, the obtained U must be equal to or less than the critical value in the table. Dashes (-)in the body of the table indicate that no decision is possible at the stated level of significance and values off nA and nB.n B\ 094 10085 6559716477708375898195 101 10786 92 706377678375898196 102 109 11587 93 99 175678274888095 102 109 116 12386 93 99 106 84769283100 107 115 123 130 13890 98 105 112 119 776984769283100 107 115 123 130 13890 98 105 112 119 12710117 8Source: From KIRK. Statistics, 5E. 2008 Wadsworth, a part of Cengage Learning, Inc. Reproduced by permission. www.cengage.com/permissions.
646STATISTICS FOR THE BEHAVIORAL SCIENCESTABLE B.10B Critical Values of the Mann-Whitney U For a .01**Critical values are provided for a one-tailed test at a .01 (lightface type) and for a two-tailed test at a .01 (bold-face type). To be significantfor any given nA and nB, the obtained U must be equal to or less than the critical value in the table. Dashes (-) in the body of the table indicatethat no decision is possible at the stated level of significance and values off nA and nB.n B\ 9210799114105Source: From KIRK. Statistics, 5E. 2008 Wadsworth, a part of Cengage Learning, Inc. Reproduced by permission. www.cengage.com/permissions.
630 STATISTICS FOR THE BEHAVIORAL SCIENCES (A) z (B) Area Between Mean and z (C) Area Beyond z in Tail (A) z (B) Area Between Mean and z (C) Area Beyond z in Tail (A) z (B) Area