Transcription
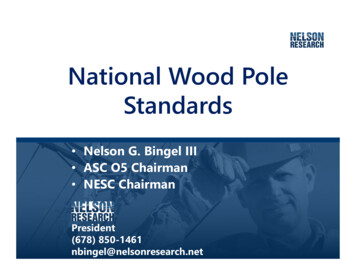
National Wood PoleStandards Nelson G. Bingel III ASC O5 Chairman NESC ChairmanPresident(678) 850-1461nbingel@nelsonresearch.net1
Benefits of Wood as a Utility Pole Material Long-Life Span 45 years national average without remedial treatment Lowest cost Both initial and full life-cycle costs Proven Performance “Go to” overhead line construction material since theearly 1900’s Climb-ability Ability to service attachments without heavy equipment2
Benefits of Wood as a Utility Pole Material Supply Chain is Proven Even in natural disaster events where demand is high, the woodpole industry has provided poles in required timeline. Beneficial Physical Properties Good insulator, resilience to wind and mechanical impacts Easy Maintenance and Modification in service “Green” a treated wood pole has a reduced environmental impact whencompared to other utility pole materials. A renewable and plentiful resource“10 Features Often Overlooked About the Extraordinary Wood Pole.” North American Wood Pole Council. www.woodpoles.org3
ANSIAmerican National Standards Institute4
ANSIAmerican National Standards InstituteANSI accredits the procedures of standards developing organizations5
ANSIAmerican National Standards InstituteANSI accredits the procedures of standards developing organizationsNational consensus standards6
ANSIAmerican National Standards InstituteANSI accredits the procedures of standards developing organizationsNational consensus standardsOpenness, balance, consensus and due process7
American Standards Committee O5 – ASC O5American National Standards InstituteAmerican Standards Committee O5USERSPRODUCERSGENERAL INTEREST8
National Wood Pole StandardsASC O5NESCAccredited StandardsCommittee O5:Standards for Wood UtilityStructures Secretariat: AWPA Revised: 5 year cycle Founded in 19249
ASC O5 StandardsPolesGlu-LamCrossarmsO5.4 - 2009 Naturally Durable Hardwood PolesO5.5 - 2010 Wood Ground Wire MouldingO5.6 - 2010 Solid Sawn Naturally Durable Hardwood Crossarms & BracesO5.TR.01-2004 Photographic Manual of Wood Pole Characteristics10
http://asco5.org/standards/11
http://asco5.org/standards/12
ScopeSingle Pole13
ScopeSimple CantileverSingle Pole14
ScopeSimple CantileverTransverseSingle Pole15
ScopeSimple CantileverTransverseSingle PoleGroundline16
Maximum Stress PointSolid, Round, Tapered, CantileverLoad(Wind Force on Wires, Equip., etc.)17
Maximum Stress PointSolid, Round, Tapered, CantileverLoad(Wind Force on Wires, Equip., etc.)Max Stress @ 1.5 Diameter Load Point18
Maximum Stress PointSolid, Round, Tapered, CantileverLoad(Wind Force on Wires, Equip., etc.)Max Stress @ 1.5 Diameter Load PointDistribution Usually Groundline19
Maximum Stress PointSolid, Round, Tapered, CantileverLoad(Wind Force on Wires, Equip., etc.)Max Stress @ 1.5 Diameter Load PointDistribution Usually Groundline20
ANSI O5.1 – Wood PolesWoodQuality21
ANSI O5.1 – Wood ons22
Wood Quality Allowable knots23
Wood Quality Sweep24
Wood Quality Growth Rings25
Pole Marking & Code Letters26
Pole Marking & Code Letters27
Transverse Wind LoadsIce28
Class Loads2 ftLcClass1097654321H1H2H3H4H5H6HorizontalLoad 6,4007,5008,70010,00011,40029
General Class Load Applications2 ad (lb)Industry Use370740Telecom Only Poles1,2001,5001,9002,400 00011,400Transmission30
Strengths are Average Values31
Wood vs. Steel VariabilityASCE Manual and Reports on Engineering Practice No. 14132
Applied Bending Load2 ftLcClass 1Class 2Class 3Class 4Class 54,500 lb3,700 lb3,000 lb2,400 lb1,900 lb33
Applied Bending Load2 ftDLcClass 1Class 2Class 3Class 4Class 54,500 lb3,700 lb3,000 lb2,400 lb1,900 lb34
Applied Bending Load2 ftLcApplied Bending Load Lc x D (ft-lb)DClass 1Class 2Class 3Class 4Class 54,500 lb3,700 lb3,000 lb2,400 lb1,900 lb35
L x D Bending Moment (ft-lb)40 ft Class 42400 lb32 ft76,800 ft-lb36
L x D Bending Moment (ft-lb)50 ft Class 440 ft Class 42400 lb2400 lb41 ft32 ft76,800 ft-lb98,400 ft-lb37
Fiber StrengthLc38
Fiber StrengthLcTension(psi)Compression(psi)39
Fiber StrengthLcTension(psi)Compression(psi)Fiber Strength40
Fiber StrengthLckTension(psi)xCompression(psi)Bending Capacity fiber strength x C3 (ft-lb)Fiber Strength41
Circumference3 EffectMG/L .000264 x Fiber Stress x Circumference 326”37,120 ft-lb34”83,010 ft-lbCircumference Increase - 30%Bending Capacity Increase - 123%42
Circumference3 EffectMG/L .000264 x Fiber Strength x Circumference 326”37,120 ft-lb34”83,010 ft-lbCircumference Increase - 30%Bending Capacity Increase - 123%43
Circumference3 EffectMG/L .000264 x Fiber Strength x Circumference 326”34”80-90%Pole’s Bending StrengthIn The Outer 2-3” Of Shell!37,120 ft-lb83,010 ft-lbCircumference Increase - 30%Bending Capacity Increase - 123%44
Table 1 – Designated Fiber Strength45
Table 1 – Designated Fiber StrengthGroup AAir Seasoning46
Table 1 – Designated Fiber StrengthGroup AAir SeasoningGroup BBoulton Drying47
Table 1 – Designated Fiber StrengthGroup AAir SeasoningGroup BBoulton DryingGroup CSteam Conditioning48
Table 1 – Designated Fiber StrengthGroup AAir SeasoningGroup BBoulton DryingGroup CSteam ConditioningGroup DKiln Drying49
Table 1 – Designated Fiber StrengthSouthern Yellow Pine8,000 psiDouglas fir8,000 psiWestern red cedar6,000 psi50
Pole Species51
Pole Species52
Pole SpeciesDistribution:Southern Yellow PineTransmission:Douglas firWestern red cedarSouthern Pine53
Pole SpeciesDistribution:Douglas firTransmissionDouglas firWestern red cedarDistribution:Southern Yellow PineTransmission:Douglas firWestern red cedarSouthern Pine54
Table 1 – Designated Fiber Strength55
Table 1 – Designated Fiber Strength1) The effects of conditioning on fiber strength have been accounted for in the Table 1values provided that conditioning was performed within the limits herein prescribed.56
Table 1 – Designated Fiber Strength1) The effects of conditioning on fiber strength have been accounted for in the Table 1values provided that conditioning was performed within the limits herein prescribed.4) The designated fiber strength represents a mean, groundline, fiber strength valuewith a coefficient of variation equal to 0.20.57
Through-boring58
Oregon State University-Through-Boring Project-59
60
61
Through-boring62
Table 1 – Designated Fiber Strength1) The effects of conditioning on fiber strength have been accounted for in the Table 1values provided that conditioning was performed within the limits herein prescribed.4) The designated fiber strength represents a mean, groundline, fiber strength valuewith a coefficient of variation equal to 0.20.5) Where Douglas-fir (coastal or Interior North) are through-bored prior to treatment, toaccount for the process, the designated fiber strength shall be reduced 5% to 7600 psi.63
2017 Table 1 added MOE64
2017 Table 1 added MOE65
2017 Table 1 added MOE1) The fiber strength and MOE values in Table 1 apply to wood utility poles meeting thisstandard. The effects of conditioning on fiber strength and MOE have been accounted for .66
2017 Table 1 added MOE1) The fiber strength and MOE values in Table 1 apply to wood utility poles meeting thisstandard. The effects of conditioning on fiber strength and MOE have been accounted for .7) The Modulus of Elasticity (MOE) represents a mean value.67
Circumference Dimensions6ftG/LTIP68
Circumference Dimensions6ftTIPG/LkxBending Capacity fiber strength x C3 (ft-lb)69
Circumference Dimension Tables70
Circumference Dimension Tables71
Circumference Dimension Tables1) The figures in this column are not recommended embedment depths; rather,these values are intended for use only when a definition of groundline is necessaryin order to apply requirements relating to scars, straightness, etc.72
Circumference Dimension Tables73
Annex B: Groundline Stresses74
Annex B: Groundline StressesMinimum circumferences specified at 6 feet from the buttWere calculated so each species in a given classCan support the class horizontal load applied 2 ft from the tip75
Annex B: Groundline StressesMinimum circumferences specified at 6 feet from the buttWere calculated so each species in a given classCan support the class horizontal load applied 2 ft from the tipApplied Bending Load Lc x D (ft-lb)76
Annex B: Groundline StressesMinimum circumferences specified at 6 feet from the buttWere calculated so each species in a given classCan support the class horizontal load applied 2 ft from the tipApplied Bending Load Bending Capacity Lc x D (ft-lb)k x fiber strength x C3 (ft-lb)77
Pole Dimension TableSouthern Pine and Douglas Fir(in)7878
Pole Dimension TableSouthern Pine and Douglas Fir(in)7979
Pole Dimension TableSouthern Pine and Douglas Fir(in)8080
Pole Dimension TableSouthern Pine and Douglas FirApplied Bending Load Class Load * Distance76,800 ft-lbs 2,400 lbs* 32ft(in)8181
Pole Dimension TableSouthern Pine and Douglas FirApplied Bending Load Class Load * Distance76,800 ft-lbs 2,400 lbs* 32ft(in)Bending Capacity k x fiber strength x C379,401 ft-lbs .000264 x 8000x 33.538282
40 ft Class 4 PolesDouglas fir(8000 psi)Western Red Cedar(6000 psi)83
40 ft Class 4 Poles2400 lbDouglas fir(8000 psi)Western Red Cedar(6000 psi)84
40 ft Class 4 Poles2400 lbDouglas fir(8000 psi)33 1/2”Western Red Cedar(6000 psi)36 1/2”85
Annex B: Groundline StressesNote 786
Annex B: Groundline StressesNote 7Average circumference tapersin the groundline zone of a pole87
ANSI O5.1 Summary2 ftBendingCapacity kLcxfiber strengthxC3 (ft-lb)88
ANSI O5.1 Summary2 ftBendingCapacity kLcxfiber strengthxC3 (ft-lb)89
ANSI O5.1 Summary2 ftLcAll SpeciesSame Length & ClassSimilar Load CapacityBendingCapacity kxfiber strengthxC3 (ft-lb)90
ANSI O5.1 Summary2 ftLcAll SpeciesSame Length & ClassSimilar Load CapacityBendingCapacity kxfiber strengthxC3 (ft-lb)91
ANSI O5.1 Summary2 ftLcAll SpeciesSame Length & ClassSimilar Load CapacityBendingCapacity kxfiber strengthxC3 (ft-lb)92
Fiber Strength ValuesForest Products Lab1965 PublicationFiber StrengthDerivation93
FPL 39 Table 4Final Adopted Fiber Strengths94
FPL 39 Table 4Final Adopted Fiber StrengthsNear 5% Lower Exclusion LimitOf Actual Average Bending StrengthOf Three Pole Groups95
Newer Test Data That Was Adjustedto Align with FPL 39Annex C – Poles 50 ft96
Newer Test Data That Was Adjustedto Align with FPL 39Annex C – Poles 50 ft and longer97
All Adjusted Full Scale Break TestsASTMEPRI98
All Adjusted Full Scale Break TestsASTMNo ChangetoEPRIPrevious Fiber Strengths99
Annex AFiber Stress Height Effect100
Annex AFiber Stress Height EffectRound timbers are known todecrease in ultimate unit strengthwith height above ground.101
Actual Pole Dimensions WA OR MTMEND MNID SDVT NHMIWI WY PAIANENVOHUTAZVAMOKYTNOKARNM MSTX LANJWVCOKSMARICTMCD DEDINILCANYAL NC SC GA FLSample Locations Coastal DF & Western Red (3) Northern Red Pine (3) Southern Yellow Pine (16) Western Red Cedar (5)Coastal Douglas Fir (8)102
Pole Circumference Data Coastal Douglas fir6,997 poles9 Producers; 11 Locations Southern Yellow Pine6,634 poles11 Producers; 16 Locations Western Red Cedar6,982 poles5 Producers; 9 Locations Northern Red Pine2,266 poles2 Producers; 4 Locations103
Pole Circumference Data Coastal Douglas fir6,997 poles9 Producers; 11 Locations Southern Yellow Pine6,634 poles11 Producers; 16 Locations Western Red Cedar6,982 poles5 Producers; 9 Locations Northern Red Pine2,266 poles2 Producers; 4 LocationsGrand Total 22,859 poles104
Fiber Stress Height Effect (FSHE) Tips average 1.5 to 2 classes larger Poles 55 ft and shorter Maximum stress is usually at G/L– FSHE not applied Maximum stress for guyed poles may be above G/L– Oversize offsets fiber stress height effect Poles 60 ft and taller If maximum stress is at the G/L, no FSHE If maximum stress is above ground, tables forreduction105
ASC O5 ossarmsO5.4 - 2009 Naturally Durable Hardwood PolesO5.5 - 2010 Wood Ground Wire MouldingO5.6 - 2010 Solid Sawn Naturally Durable Hardwood Crossarms & BracesO5.TR.01-2004 Photographic Manual of Wood Pole Characteristics106
National Wood Pole StandardsASC O5NESCAccredited StandardsCommittee O5:Standards for Wood UtilityStructures Secretariat: AWPA Revised: 5 year cycle Founded in 1924107
National Overhead Line StandardNESCANSI C2:National ElectricalSafety Code Secretariat: IEEE(Institute of Electrical andElectronics Engineers) Revised: 5 year cycle Established in 1915108
NESC Committee eChairmanTechnicalSubcommitteesVice ChairSecretary-IEEE25 – 35 MembersSecretary6 - 10 MembersChairmanSecretarySC 1 – Coordination; Sections 1,2,3SC 2 – GroundingSC 3 – SubstationsSC 4 – Overhead Lines – ClearancesSC 5 – Overhead Lines – Strength & LoadingSC 7 – Underground LinesSC 8 – Work Rules109
Purpose of the NESC110
Purpose of the NESCB. NESC rules contain the basic provisions, underspecified conditions, that are considered necessary forthe safeguarding of:1. The Public2. Utility workers (employees and contractors), and3. Utility facilitiesC. This code is not intended as a design specification or asan instruction manual.111
NESC Committee eChairmanTechnicalSubcommitteesVice ChairSecretary-IEEE25 – 35 MembersSecretary6 - 10 MembersChairmanSecretarySC 1 – Coordination; Sections 1,2,3SC 2 – GroundingSC 3 – SubstationsSC 4 – Overhead Lines – ClearancesSC 5 – Overhead Lines – Strength & LoadingSC 7 – Underground LinesSC 8 – Work Rules112
Overhead Lines Subcommittee 5Section 24Grades of Construction Grades B, C & N(B is the highest)Section 25Loading for Grade B&C Load FactorsSection 26Strength requirements Strength Factors Rule 250B:Combined Ice and WindDistrict Loading Rule 250C:Extreme Wind Loading Rule 250D:Extreme Ice with ConcurrentWind Loading113
Overhead Lines Subcommittee 5Section 24Grades of Construction Grades B, C & N(B is the highest)Section 25Loading for Grade B&C Load FactorsSection 26Strength requirements Strength Factors Rule 250B:Combined Ice and WindDistrict Loading Rule 250C:Extreme Wind Loading Rule 250D:Extreme Ice with ConcurrentWind LoadingSection 27Insulators Electrical Strength Mechanical Strength114
Section 24: Grades of Construction Grade B: (3.85 SF) Crossing Limited Access Highways Crossing Railways Crossing Navigable Waterways Grade C: (2.06 SF) All other standard construction Grade N: (Strength shall exceed expected loads) Mainly used for temporary and emergency construction115
Section 25 – Loadings for Grade B & CTRANSVERSEVERTICAL116
Transverse Loading Usually GovernsTRANSVERSEVERTICAL117
Calculating Transverse LoadsWind Bending Loads On:118118
Calculating Transverse LoadsWind Bending Loads On:WiresIce119119
Calculating Transverse LoadsWind Bending Loads On:WiresIcePole120120
Calculating Transverse LoadsWind Bending Loads On:WiresIcePoleEquipment121121
Calculating Transverse LoadsWind Bending Loads On:WiresIcePoleEquipmentOffset Bending Loads122122
Calculating Transverse LoadsWind Bending Loads On:WiresIcePoleEquipmentOffset Bending LoadsWire Tension123123
Section 25: Loading for Grade B & C Rule 250B: District LoadingCombined Ice and Wind Rule 250C: Extreme Wind Loading(60ft Exemption) Rule 250D: Extreme IceWith Concurrent Wind Loading(60ft Exemption)124
NESC District LoadingWinter Storm125
NESC District LoadingWinter Storm½” Ice – 40 mph¼” Ice – 40 mph0” Ice – 60 mph126
NESC District LoadingWinter Storm½” Ice – 40 mph¼” Ice – 40 mph40 mph 4 lbs/sqft60 mph 9 lbs/sqft0” Ice – 60 mph127
Medium Loading District40 mph¼” Ice128128
Wind Load Increase per Wire Sizes0.75”2x1.50” 100%2x3.00” 200%Double wire diameter Double the load129
Wind Load Increase With 0.25” Radial Ice0.75”1.50”3.00”2.00” 33%3.50” 17%.25” Ice1.25” 67%130
District Loads vs. Wire Size987RELATIVE LOAD6NESC-L5No ICE4NESC-M1/4” ICE3NESC-H21/2” ICE104ACSR1/0336556CONDUCTOR (SMALLEST TO LARGEST)131
Section 25: Loading for Grade B & C Rule 250B: District LoadingCombined Ice and Wind132
Section 25: Loading for Grade B & C Rule 250B: District LoadingDeterministicCombined Ice and Wind133
Extreme Wind– Rule 250C(60 ft. Exclusion)Summer Storm85 mph 18.5 lbs/sqft90 mph 21 lbs/sqft130 mph 43 lbs/sqft150 mph 58 lbs/sqft134
Extreme Ice with Concurrent Wind –Rule 250D(60 ft. Exclusion)Winter StormRadialIce0”Wind Speeds0.25”30 mph0.5”40 mph0.75”50 mph1.0”60 mph135
Section 25: Loading for Grade B & C Rule 250B: District LoadingDeterministicCombined Ice and Wind Rule 250C: Extreme Wind Loading(60ft Exemption) Rule 250D: Extreme IceWith Concurrent Wind Loading(60ft Exemption)136
Section 25: Loading for Grade B & C Rule 250B: District LoadingDeterministicCombined Ice and Wind Rule 250C: Extreme Wind Loading Probabilistic(60ft Exemption) Rule 250D: Extreme IceWith Concurrent Wind Loading(60ft Exemption)137
Section 25: Loading for Grade B & C Rule 250B: District LoadingDeterministicCombined Ice and Wind Rule 250C: Extreme Wind Loading Probabilistic(60ft Exemption) Rule 250D: Extreme Ice ProbabilisticWith Concurrent Wind Loading(60ft Exemption)138
Section 25 Load Cases Rule 250 B - Combined Ice & Wind–––– Light0” IceMedium¼” IceHeavy½” IceLoads to be Factored60 mph40 mph40 mphRule 250 C – Extreme Wind– Poles Taller than 60 feet Above Ground– Wind only (no ice)– Ultimate Load with probability of occurrence Rule 250 D – Extreme Ice with Wind– Poles Taller than 60 feet Above Ground– Ice Thickness with Concurrent Wind– Ultimate Load with probability of occurrence139
LoadStrengthAlternate MethodPole StrengthPole Strength Storm Loadx4 (B)Storm Loadx2 (C)140
LoadStrengthStrengthPole Strength x SFPole Strength x SF Alternate MethodPole StrengthPole Strength Storm Loadx4 (B)Storm Loadx2 (C)141
LoadStrengthLoadStrengthPole Strength x SFPole Strength x SF Storm LoadxLF (B)Storm LoadxLF (C)Storm Loadx4 (B)Storm Loadx2 (C)Alternate MethodPole StrengthPole Strength 142
Grade CxGrade CVertical Loads1.501.901.90Transverse Loads(wind)2.502.201.75LongitudinalLoads1.10No Req.No Req.250CWind Loads1.001.001.00Ice and Windloads1.001.001.00Rule 250BGrade B250DSection 25: Table 253.1-Load Factors143
Grade CxGrade CVertical Loads1.501.901.90Transverse Loads(wind)2.502.201.75LongitudinalLoads1.10No Req.No Req.250CWind Loads1.001.001.00Ice and Windloads1.001.001.00Rule 250BGrade B250DSection 25: Table 253.1-Load Factors144
Section 26: Strength Factors250C & 250DRule 250BTable 261‐1Grade BGrade CMetal Structures1.01.0Wood Structures0.650.85Metal Structures1.001.00Wood Structures0.750.75145
Section 26: Strength Factors250C & 250DRule 250BTable 261‐1Metal StructuresGrade BGrade C1.01.0Wood Structures0.650.85Metal Structures1.001.00Wood Structures0.750.75Fiber Strength (ANSI) Strength Factor (NESC) Allowable Stress of Pole146
Section 26: Strength Factors250C & 250DRule 250BTable 261‐1Metal StructuresGrade BGrade C1.01.0Wood Structures0.650.85Metal Structures1.001.00Wood Structures0.750.75Fiber Strength (ANSI) Strength Factor (NESC) Allowable Stress of Pole147
LoadStrengthLoadStrengthPole Strength x SFPole Strength x SF Storm LoadxLF (B)Storm LoadxLF
1 Nelson G. Bingel III ASC O5 Chairman NESC Chairman National Wood Pole Standards