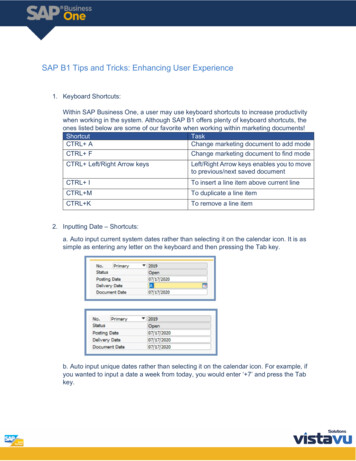
Transcription
Tips & Tricks 2014
Table of ContentsTool OverviewIn / Out. . . . . . . . . . . . . . . . . . . . . . . . . . . . . . . . . . . . . . . . . . . . . . . . . . . . . . . . . . . . . . . . . . . . .Preparation . . . . . . . . . . . . . . . . . . . . . . . . . . . . . . . . . . . . . . . . . . . . . . . . . . . . . . . . . . . . . . .Join. . . . . . . . . . . . . . . . . . . . . . . . . . . . . . . . . . . . . . . . . . . . . . . . . . . . . . . . . . . . . . . . . . . . . . . . .Parse. . . . . . . . . . . . . . . . . . . . . . . . . . . . . . . . . . . . . . . . . . . . . . . . . . . . . . . . . . . . . . . . . . . . . . .Transform. . . . . . . . . . . . . . . . . . . . . . . . . . . . . . . . . . . . . . . . . . . . . . . . . . . . . . . . . . . . . . . . . .Reporting. . . . . . . . . . . . . . . . . . . . . . . . . . . . . . . . . . . . . . . . . . . . . . . . . . . . . . . . . . . . . . . . . .Documentation. . . . . . . . . . . . . . . . . . . . . . . . . . . . . . . . . . . . . . . . . . . . . . . . . . . . . . . . . . . .Spatial . . . . . . . . . . . . . . . . . . . . . . . . . . . . . . . . . . . . . . . . . . . . . . . . . . . . . . . . . . . . . . . . . . . . .Interface. . . . . . . . . . . . . . . . . . . . . . . . . . . . . . . . . . . . . . . . . . . . . . . . . . . . . . . . . . . . . . . . . . .Data Investigation. . . . . . . . . . . . . . . . . . . . . . . . . . . . . . . . . . . . . . . . . . . . . . . . . . . . . . . . .Predictive. . . . . . . . . . . . . . . . . . . . . . . . . . . . . . . . . . . . . . . . . . . . . . . . . . . . . . . . . . . . . . . . . .Time Series . . . . . . . . . . . . . . . . . . . . . . . . . . . . . . . . . . . . . . . . . . . . . . . . . . . . . . . . . . . . . . . .Predictive Grouping. . . . . . . . . . . . . . . . . . . . . . . . . . . . . . . . . . . . . . . . . . . . . . . . . . . . . . .Connectors . . . . . . . . . . . . . . . . . . . . . . . . . . . . . . . . . . . . . . . . . . . . . . . . . . . . . . . . . . . . . . . .Address . . . . . . . . . . . . . . . . . . . . . . . . . . . . . . . . . . . . . . . . . . . . . . . . . . . . . . . . . . . . . . . . . . . .Demographic Analysis . . . . . . . . . . . . . . . . . . . . . . . . . . . . . . . . . . . . . . . . . . . . . . . . . . . .Behavior Analysis. . . . . . . . . . . . . . . . . . . . . . . . . . . . . . . . . . . . . . . . . . . . . . . . . . . . . . . . . .Calgary. . . . . . . . . . . . . . . . . . . . . . . . . . . . . . . . . . . . . . . . . . . . . . . . . . . . . . . . . . . . . . . . . . . .Developer. . . . . . . . . . . . . . . . . . . . . . . . . . . . . . . . . . . . . . . . . . . . . . . . . . . . . . . . . . . . . . . . . .Social Media. . . . . . . . . . . . . . . . . . . . . . . . . . . . . . . . . . . . . . . . . . . . . . . . . . . . . . . . . . . . . . .Laboratory. . . . . . . . . . . . . . . . . . . . . . . . . . . . . . . . . . . . . . . . . . . . . . . . . . . . . . . . . . . . . . . . .33577891011131517181920212123232526Getting Started – Module DesignGetting Started with Alteryx. . . . . . . . . . . . . . . . . . . . . . . . . . . . . . . . . . . . . . . . . . . . . .Renaming Tools. . . . . . . . . . . . . . . . . . . . . . . . . . . . . . . . . . . . . . . . . . . . . . . . . . . . . . . . . . . .Set Record Limit for the Input. . . . . . . . . . . . . . . . . . . . . . . . . . . . . . . . . . . . . . . . . . . . .Tool Container . . . . . . . . . . . . . . . . . . . . . . . . . . . . . . . . . . . . . . . . . . . . . . . . . . . . . . . . . . . .Module Packager. . . . . . . . . . . . . . . . . . . . . . . . . . . . . . . . . . . . . . . . . . . . . . . . . . . . . . . . . .2728292931Getting Started - Module OptimizationResource Optimization Settings . . . . . . . . . . . . . . . . . . . . . . . . . . . . . . . . . . . . . . . . . .Select Tool. . . . . . . . . . . . . . . . . . . . . . . . . . . . . . . . . . . . . . . . . . . . . . . . . . . . . . . . . . . . . . . . .Auto Field Tool. . . . . . . . . . . . . . . . . . . . . . . . . . . . . . . . . . . . . . . . . . . . . . . . . . . . . . . . . . . . .Disable Browse Tools. . . . . . . . . . . . . . . . . . . . . . . . . . . . . . . . . . . . . . . . . . . . . . . . . . . . . .33353636Data BlendingGetting Connected in a BIG Way . . . . . . . . . . . . . . . . . . . . . . . . . . . . . . . . . . . . . . . . . . 37Alias Repository . . . . . . . . . . . . . . . . . . . . . . . . . . . . . . . . . . . . . . . . . . . . . . . . . . . . . . . . . . . 40Dynamic Input and Directory Tools. . . . . . . . . . . . . . . . . . . . . . . . . . . . . . . . . . . . . . . 40
AnalyticsSpatial Relationship: Spatial Match Tips. . . . . . . . . . . . . . . . . . . . . . . . . . . . . . . . . .Street App Layer Extraction. . . . . . . . . . . . . . . . . . . . . . . . . . . . . . . . . . . . . . . . . . . . . . .Doughnuts Anyone? Trade Area Optimization. . . . . . . . . . . . . . . . . . . . . . . . . . . .How Calgary Indexes Work. . . . . . . . . . . . . . . . . . . . . . . . . . . . . . . . . . . . . . . . . . . . . . . .Fuzzy Match on a Calgary Dataset. . . . . . . . . . . . . . . . . . . . . . . . . . . . . . . . . . . . . . . .Calgary Best Practices . . . . . . . . . . . . . . . . . . . . . . . . . . . . . . . . . . . . . . . . . . . . . . . . . . . .41424342444547484849505253Publishing – ReportingCopy and Paste Map Tool Unique Value Settings. . . . . . . . . . . . . . . . . . . . . . . . .Using Legend Splitter/Builder to Modify the Legend. . . . . . . . . . . . . . . . . . . . .Overlay Tool Isn’t Just for Legends. . . . . . . . . . . . . . . . . . . . . . . . . . . . . . . . . . . . . . . .Reporting Email . . . . . . . . . . . . . . . . . . . . . . . . . . . . . . . . . . . . . . . . . . . . . . . . . . . . . . . . . . .55555657Add one or more of these tools in your data stream toreview and verify your dataInputs the current date and time at module runtime(Useful for adding a date-time header to a report)Directory ToolReturns all the files in a specified directory, along withfile names, paths, creation date, file size, and more!Input DataBring data into your module by selecting a file or connecting toa database (optionally, using a query)Map InputTool SpotlightRun Command. . . . . . . . . . . . . . . . . . . . . . . . . . . . . . . . . . . . . . . . . . . . . . . . . . . . . . . . . . . . .Tile Tool. . . . . . . . . . . . . . . . . . . . . . . . . . . . . . . . . . . . . . . . . . . . . . . . . . . . . . . . . . . . . . . . . . . .DateTime Tool and Time Based Calculations . . . . . . . . . . . . . . . . . . . . . . . . . . . . .Render Tool to Create Folders. . . . . . . . . . . . . . . . . . . . . . . . . . . . . . . . . . . . . . . . . . . . .BrowseDateTimePublishing - Analytical Apps and MacrosAdding Description to Your App/Changing Icon. . . . . . . . . . . . . . . . . . . . . . . . . .Analytical App Values . . . . . . . . . . . . . . . . . . . . . . . . . . . . . . . . . . . . . . . . . . . . . . . . . . . . .Chained Apps: Pick up a File From TEMP. . . . . . . . . . . . . . . . . . . . . . . . . . . . . . . . . .Analytical App: Update an IN() Clause From Tree Selection . . . . . . . . . . . . . .Analytical Apps Best Practices. . . . . . . . . . . . . . . . . . . . . . . . . . . . . . . . . . . . . . . . . . . .Macro Connection Abbreviations. . . . . . . . . . . . . . . . . . . . . . . . . . . . . . . . . . . . . . . . .Batch Macros. . . . . . . . . . . . . . . . . . . . . . . . . . . . . . . . . . . . . . . . . . . . . . . . . . . . . . . . . . . . . .In / Out59606162An interactive tool that allows users to draw points, linesor polygons, to be used as the input in their module.Output DataUsed any time results are needed from your analysis.This tool can write to: csv, dbf, xlsx, ODBC, shp, tab, yxdb, accdb,and many more!Text InputManually add data that will be stored in the modulePreparationAuto FieldAutomatically sets the field type to the smallest possiblesize and type that will accommodate each column2 Tool Overview 3
Date FilterRecord IDDesigned to allow a user to easily filter data based on aAssign a unique identifier to each recorddate criteria using a calendar-based interfaceSampleFilterLimit the data stream to a number, percentage, or random setQuery records based on an expression to split data into twoof recordsstreams: True (records that satisfy the expression) and FalseSelectFormulaSelect, de-select, reorder and rename fields, change fieldCreate or update fields using one or more expressions totype or size, and assign a descriptionperform a broad variety of calculations and/or operationsSelect RecordGenerate RowsSelect specific records and/or ranges of records includingCreate new rows of data. Useful for creating a sequence ofdiscontinuous ranges. Useful for troubleshootingnumbers, transactions, or datesand samplingImputationSortUpdate specific values in a numeric data field with anotherSort records based on the values in one or more fieldsselected value. Useful for replacing NULL() valuesTileMulti-Field BinningGroup data into sets (tiles) based on value ranges in a fieldGroup multiple numeric fields into tiles or bins, especially forUniqueuse in predictive analysisSeparate data into two streams (duplicate and unique records)Multi-Field Formulabased on the fields of the user’s choosingCreate or update multiple fields using a single expression toperform a broad variety of calculations and/or operationsJoinMulti-Row FormulaAppend FieldsCreate or update a single field using an expression that canAttaches the fields of one small input (Source) to every record ofreference fields in subsequent and/or prior rows. Useful foranother larger input (Target)parsing complex dataBusiness Match (US)Random % SampleMatch customer or prospect field to the Dun & BradstreetGenerate a random number or percentage of recordsBusiness Filepassing through the data stream4 Tool OverviewTool Overview 5
ConsumerView MatchingAn updated version of the Household File Matching ToolParsewith functionality and new matching criteriaDate TimeTransform date/time data to and from a varietyFind Replaceof formatsSearch for data in one field from one data stream and replaceit with a specified field from a different streamRegEx(Similar to Excel’s VLOOKUP)Parse, match, or replace data using regularexpression syntaxFuzzy MatchIdentify non-identical duplicates in a data streamText to ColumnsSplit the text from one field into separate rowsHousehold File Matchingor columnsMatch customer file to the Experian ConsumerViewHousehold FileXML ParseRead in XML snippets and parse them into individual fieldsJoinCombine two data streams based on common fields(or record position). In the joined output, each row will containdata from both inputsJoin MultipleCombine two or more inputs based on common fields(or record position)Make GroupAssemble pairs of matches into groups based on theirrelationships. Generally used with the Fuzzy Match ToolUnionCombine two or more data streams with similar structuresbased on field names or positionsTransformArrangeManually transpose and rearrange fields forpresentation purposesCount RecordsCount the records passing through the data stream.A count of zero is returned if no records pass throughCross TabPivot the orientation of the data stream so thatvertical fields are on the horizontal axis, summarizedwhere specifiedRunning TotalCalculate a cumulative sum per record in a data stream6 Tool OverviewTool Overview 7
SummarizeMap Legend SplitterSummarize data by grouping, summing, counting, spatialSplit the legend from the report map tool into its componentprocessing and much more. Output results are of theparts for customization by other toolscalculations onlyOverlayTransposeArrange reporting snippets on top of one another for output viaPivot the orientation of the data stream so that horizontalthe Render toolfields are on the vertical axisRenderWeighted AverageOutput report snippets into presentation-quality reports in aCalculate the weighted average of a set of values where somevariety of formats, including PDF, HTML, XLSX, and DOCXrecords are configured to contribute more than othersReport FooterReportingAdd a footer to a report for output via the Render toolChartingReport HeaderCreate a chart (Area, Column, Bar, Line, Pie, etc.) for output viaAdd a header to a report for output via the Render toolthe Render toolReport MapEmailCreate a map for output via the Render toolSend emails for each record with attachments or emailgenerated reports if desiredReport TextAdd and customize text for output via the Render toolImageAdd an image for output via the Render toolTableCreate a data table for output via the Render toolLayoutArrange two or more reporting snippets horizontally orvertically for output via the Render toolDocumentationCommentMap Legend BuilderAdd annotation or images to the module canvas to captureRecombine the component parts of a map legendnotes or explain processes for later reference(created using the Map Legend Splitter) into a singlelegend tableExplorer BoxAdd a web page or Windows Explorer window to your canvas8 Tool OverviewTool Overview 9
Tool ContainerPoly-BuildOrganize tools into a single box that can be collapsedCreate a polygon or polyline from sets of pointsor disabledPoly-SplitSpatialSplit a polygon or polyline into its component polygons,lines, or pointsBufferExpand or contract the extents of a spatial objectSmooth(typically a polygon)Round off sharp angles of a polygon or polyline by addingnodes along its linesCreate PointsCreate spatial points in the data stream using numericSpatial Infocoordinate fieldsExtract information about a spatial object, such as area,centroid, bounding rectangle, etc.DistanceCalculate the distance or drivetime between a point andSpatial Matchanother point, line, or polygonCombine two data streams based on the relationship betweentheir spatial objects to determine if the objects intersect,Find Nearestcontain or touchIdentify the closest points or polygons in one file to the pointsin a second fileSpatial ProcessCreate a new spatial object from the combination orGeneralizeintersection of two spatial objectsSimplify a polygon or polyline object by decreasing the numberof nodesTrade AreaDefine radii (including non-overlapping) or drive-time polygonsHeat Maparound specified pointsGenerate polygons representing different levels of “heat”(e.g. demand) in a given area, based on individual records (e.g.Interfacecustomers)ActionMake GridUpdates the configuration of a module with values provided byCreate a grid within spatial objects in the data streaminterface questions, when run as an app or macroNon Overlap DrivetimeCheck BoxCreate drivetime trade areas that do not overlap for a point fileWill display a check box option to the end user in anapp or macro10 Tool OverviewTool Overview 11
ConditionNumeric Up/DownTests for the presence of user selections. The state is either trueDisplay a numeric control in an appor falseRadio ButtonControl ParameterDisplay a mutually exclusive option in an appThe input for each iteration in the Batch MacroText BoxDateDisplay a free form text box in an appWill display a calendar in app or macro for the end user tospecify a date valueTreeDisplay an organized, hierarchal data structure in an appDrop DownDisplay a single selection list in an app or macro to an end userData InvestigationError MessageWill throw an Error message to the end user of an app or macroAssociation AnalysisDetermine which fields in a database have a bivariateFile Browseassociation with one anotherWill display a file browse control in an appContingency TableFolder BrowseCreate a contingency table based on selected fields, to listDisplays a folder browse control in an app or macroall combinations of the field values with frequency and percentcolumnsList BoxDisplays a multi-selection check box list in an app or macroCreate SamplesSplit the data stream into two or three random samplesMacro Inputwith a specified percentage of records in the estimation andUsed to display input parameters (arrows, source, and interface)validation samplesfor a macroField SummaryMacro OutputProduce a concise summary report of descriptive statistics forUsed to display output arrows on a macro toolthe selected data fieldsMapFrequency TableDisplay an interactive map for the user to draw or select mapFrequency analysis for selected fields - outputs a summary ofobjects in an app or macrothe selected field(s) with frequency counts and percentages foreach value in a field12 Tool OverviewTool Overview 13
HistogramCreates a histogram plot for a numeric field. Optionally, itprovides a smoothed empirical density plotOversample FieldSample incoming data so that there is equal representation ofdata values to enable effective use in a predictive modelPearson CorrelationDivide the covariance of two variables by the product of theirstandard deviationsPlot of MeansTake a numeric or binary categorical field as a response fieldPredictiveAB AnalysisCompare the percentage change in a performance measure tothe same measure one year priorAB ControlsMatches one to ten control units to each member of a set ofpreviously selected test units, on criteria such as
Contingency Table Create a contingency table based on selected fields, to list all combinations of the field values with frequency and percent columns Create Samples Split the data stream into two or three random samples validation samples Field Summary Produce a concise summary repo
