Transcription
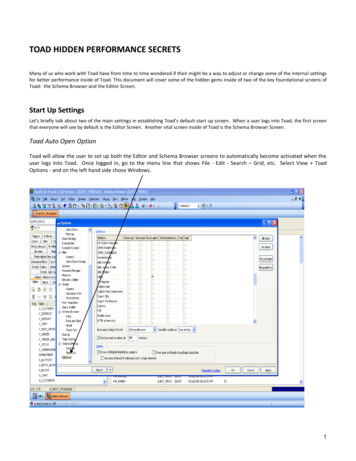
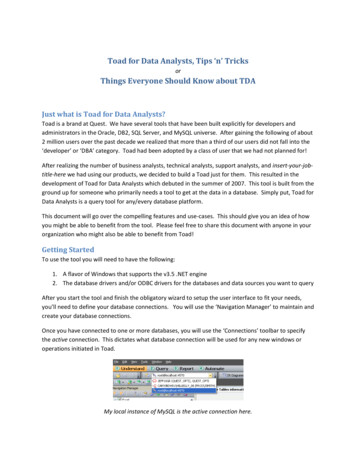
Toad for Data Analysts, Tips ‘n’ TricksorThings Everyone Should Know about TDAJust what is Toad for Data Analysts?Toad is a brand at Quest. We have several tools that have been built explicitly for developers andadministrators in the Oracle, DB2, SQL Server, and MySQL universe. After gaining the following of about2 million users over the past decade we realized that more than a third of our users did not fall into the‘developer’ or ‘DBA’ category. Toad had been adopted by a class of user that we had not planned for!After realizing the number of business analysts, technical analysts, support analysts, and insert-your-jobtitle-here we had using our products, we decided to build a Toad just for them. This resulted in thedevelopment of Toad for Data Analysts which debuted in the summer of 2007. This tool is built from theground up for someone who primarily needs a tool to get at the data in a database. Simply put, Toad forData Analysts is a query tool for any/every database platform.This document will go over the compelling features and use-cases. This should give you an idea of howyou might be able to benefit from the tool. Please feel free to share this document with anyone in yourorganization who might also be able to benefit from Toad!Getting StartedTo use the tool you will need to have the following:1. A flavor of Windows that supports the v3.5 .NET engine2. The database drivers and/or ODBC drivers for the databases and data sources you want to queryAfter you start the tool and finish the obligatory wizard to setup the user interface to fit your needs,you’ll need to define your database connections. You will use the ‘Navigation Manager’ to maintain andcreate your database connections.Once you have connected to one or more databases, you will use the ‘Connections’ toolbar to specifythe active connection. This dictates what database connection will be used for any new windows oroperations initiated in Toad.My local instance of MySQL is the active connection here.
Special Note Regarding MS Excel ConnectionsYes! You can connect to an XLS or XLSX file and query it just like a database! When you connect to thespreadsheet bear in mind Toad prefers to see Named Regions in your spreadsheet. The named regionswill show as a table in the Database Explorer. If you do not use named regions, have no fear! On theconnection dialog, be sure to check the ‘Show System Tables.’Once connected, each workbook will display as a table in the Database Explorer.Database BrowserThe Database Browser allows you to navigate and interact with the contents of your database. You caneasily drill down into a table or view for example and extract said data to a pivot table in MS Excel.Tips & Tricks for the BrowserUse the splitter control to ‘hide’ thenavigation manager (circled in red)Investigate the different layouts; mypersonal favorite is the ‘Flat Tree’.Filtering – tell Toad to hide certain schemasor certain object types based on names or otherobject properties. You can give these filters ‘names’so you can easily switch between different sets ofobjects in your database.Mouse-right-click on an object to see all theToad features availableYou can multi-select objects and right-clickto fire an operation against more than one table
Double-click on an object to open the ‘Object Viewer’Object ViewerThe Object Viewer shows all of the properties for the object selected in the Database Browser. Theinformation and operations you will be able to access here will be directly impacted by the securityprivileges setup for the account you are using. Toad itself does not restrict you from making changes tothe data or objects in the database!Toad is available in a Read Only installation that prohibits changes to the database.The Relationships TabThe information shown in the Relationships tab is compiled based on the referential integrity defined inthe database. Please note that not all database applications use foreign keys in the database to controltables. In the case that your application has the business rules defined outside the database, this tabwill be blank. In this case, you can manually build your own diagrams in the ‘ER Diagram’ window.
The Data TabThe Data Tab will retrieve the first 1,000 records for each object you select in the Database Browser.You can retrieve more records as you need them by scrolling or paging down the grid, or you can mouseright-click in the grid and choose ‘Read All Rows’.Important Tip: Toad uses the Auto Commit feature to ensure browsing tables does not create excessivelocks in your database.The data grids in Toad can be manipulated to hide information you do not need to see. Do you reallyneed to see all 255 columns or all million rows in a table? If you are trying to create a report ofcustomers and their addresses, wouldn’t you prefer to click your way through it rather than manuallywrite a query in Toad editor? Whenever possible, use the data grid to build your reports! This will saveyou time and resources in the database.Manipulating the Data Grids‘Fixing’ columns – you can fix one or more columns so that when you scroll left-right-up-down, thecolumns of interest remain ‘fixed.’ To do this, mouse-right-click on the column header of interest and
choose ‘Fix Column - Left Right’.As I scroll left and right, only the non-fixed columns move.‘Hiding’ columns – you can turn columns off. Doing this not only makes the data easier to read, butwhen you do a report or export, these columns are left off. Note you can also drag the columns aroundin the order of your choice, which also affects the reports and exports. To hide a column, mouse-rightclick on any column header and choose ‘Column Chooser.’
As you drag columns to the ‘Customization’ box, they will be removed from the grid. Simply drag themback to the grid column header space to undo the ‘hide’ action.‘Grouping’ Columns – You can group the data by specific values directly in the grid. To do this, mouseright-click on the column header of choice and select ‘Group By This Column.’ You may also want toactivate the ‘Group By Box’ to easier see what is being grouped as you can have multiple levels.You can also add column totals by right-clicking in the gutter space for each column.
Export Formats AvailableWhen you want to send the data in a grid to a file, you can use the Export Wizard. In any data grid justmouse-right-click and choose:Formats other than Excel: Export Wizard
For any/all Excel exports: Quick ExportThe Export Wizard will allow you to build any of the following:1.2.3.4.5.6.Access Database FileDelimited Text (you pick the delimiter)XMLHTMLSQL Script (Insert Statements)Create as New Table\View (will build a new object in the database)The Quick Export flyouts allow you to quickly build new spreadsheets or append data to existingworkbooks. You can also use it to help you with your pivot tables.Some Tips/Tricks for Excel Exports1. Use the ‘Instance’ options to append data to an existing workbook. Place your cursor in the cellto let Toad know where to put the data if you are using the ‘ At Active Cell’ option2. Use the ‘Linked Query’ options to build a spreadsheet with the query embedded into thespreadsheet. When you open the report, you’ll have the option refreshing the data ‘live’ fromthe database.3. If you need just a quick-n-dirty pivot, do that directly in the Toad editor.My Data Isn’t All in One Table/View, Now What Do I Do?If you need to pull data from multiple objects to build your report or do your analysis, you will need tobuild a query. There are several ways to do this in Toad. First, the easy way.The Query BuilderFrom the ‘Relationships Tab’, if you were to mouse-right-click, you can automatically build a SQL SELECTstatement to pull data from all the related tables.
Send to Query Builder will auto-load your tables and build your joins.If your query or report needs to pull data from non-related objects in terms of referential integrity, youcan still use the Query Builder. You will just need to manually add the objects and draw therelationships manually.If you have ever used MS Access to build a report, then the Query Builder should be familiar to you. Ifnot, you will learn to use it very quickly!Some Tips/TricksChecking an object column will add it to the query. From there you can set filtering propertiesin the field grid below.
You can add a ‘Calculated Field’, for example the AVG of a numerical value, or the UPPER of atext value by clicking on the cool little Greek letter in the toolbar You can build SELECT, INSERT, UPDATE, DELETE, INSERT AS SELECT, or CREATE or REPLACE VIEWcommands with the Query BuilderYou can include UNION, INTERSECT, & MINUS clausesYou can add multiple sub-queries and model them as wellUse Calculated fields to help write your WHERE clauses on ID fieldso Right-click on an ID and select ‘Find Lookup Table’
oConfigure the descriptive data you want shown next to the ID valuesSee how the Department names are listed with the Department IDs?When working with DATE values, let Toad fill in the blanks for you!If you need help with a query that’s already been written, the Query Builder can reverseengineer it so you can model it instead!Toad can query objects from different databases and data sources! For example, if I haveinformation in an Excel file and an Oracle table, I can drag both objects to the query builder.This should be reserved for quick and dirty reports that do not involve large amounts of data.This type of query forces the ODBC connector and can be client CPU/Memory intensive.
You’ll need to manually add the relationship/join to the query.EditorThe editor is where you will be manually writing and executing your SQL statements. These tips andtricks can, over time, save you a tremendous amount of time. Remember though, if all of your data is ina single table or view, you may want to investigate manipulating the data grid in the Object Viewer toget to your report.Code Insight Type-Ahead-TechnologyToad can offer to auto-complete your queries. Our parser can identify and recognize your SQL. Thisallows Toad to display objects from the database that might be coming next in your queries. Here aresome examples:After keywords ‘SELECT’, ‘FROM’, WHEREToad sees we are looking for tables or views, so it shows them to us. In the other example, itknows we need a WHERE clause, so it offers up the Foreign Key relationships to choose from.
After a ‘.’ [DOT]In the second example we can see where an aliased object is resolved. In the case of columninsight, we will also show you the comments available from the table definition if available.SQL RecallEach statement you execute in Toad is stored so it can be recalled later. The full recall list can beopened by using the SHIFT F8 keystroke. It’s also available under the View menu.You may notice that the docked panel can take up large amount of real estate in the Toad applicationwindow My personal favorite method for recalling SQL statements is using the ALT Up/Dn Arrow keys. Thiswill cycle through your query statements in the editor. Very handy!You should investigate the options if you want to increase the default amount of queries to be recorded(100.)
Options Tip: Use the Search mechanism to quickly find what you’re looking for.Group ExecuteIf you have one or more queries you want to execute against more than one database, this will be anextremely useful feature. First you need to make sure it’s enabled. In the Toad editor, mouse-right-clickand toggle on ‘Show Group Execute.’Once active, click in this docked panel, and choose the databases you want to execute your queries. Ifthis is enabled, you will get a visual indicator, and a prompt to ensure you really want to execute againstmultiple sources. BE CAREFUL WITH THIS FEATURE!Query Results, Seeing DifferencesIf you are running multiple versions of the same query, you may need some help deciphering the resultsof each query. As you execute queries in Toad, you will get a new data grid in the editor. If you want to
see what is different between any of these grids, simply mouse-right-click in the grid and choose‘Compare To’.Toad will show you rows missing from each set and rows that differ apart from the primary key values.Pivoting DataToad’s pivot grids can reorganize and summarize data to create meaningful reports. You can sort andsum data independent of the original data layout. This can be useful for creating financial and statisticalreports.
Chart WizardYou can turn any data grid into a chart on the fly. Simply mouse-right-click in a grid and choose ‘Send To- Chart Designer.’ Needless to say, you can have a lot of fun here!Full Report WizardInstead of sending your data to the Chart Wizard, you can also choose to work with the ‘Data ReportDesigner.’ Toad will ask you which columns from your query you want to report on, if you want to doany grouping, and if you want to add any additional statistical fields.Once you have finished the wizard, it will send you to the reporting IDE. Again this may look familiar ifyou have ever built a report with Access. This format does not allow for a full tutorial here, but thereare some good things to know and will help you get started.Use the ‘Preview’ tab to see what your report will look like. You can also export your report toPDF, RTF, and several image file types from here.Be sure to hide/minimize the ‘Navigation Manager’ panel, you will need as much real estatehere as you can get!If you want to change something in the report, click on it, then go to the ‘Properties’ panel toadjust as necessary.You can add pictures, charts, and other objects by simply drawing them onto the report page.
Tip: Need your query exported to PDF? Use the Report Designer!General Tips & TricksNeed to close everything but your current document? Right-mouse-click on the document taband choose ‘Close Other Tabs’Want Toad to look and feel like MS Query Analyzer or SQL Navigator? Run the Tools Configuration Wizard.Use the Project Manager to easily recall your previous work like reports and ER DiagramsBe sure to check out the following utilities, they are extremely powerful!o Data Compare and Sync (compare tables and get INSERT/UPDATE/SYNCH scripts)o Master Detail Browser (view data via ROI diagrams)o Import Wizard (automatically import data from Excel to your database)o Automate (create Toad macros and replay or schedule them to run at any time)o Email (Automate feature can email your reports and exports automagically!)Bookmark ToadWorld and the Toad User CommunityNeed help? Watch the movie! Look for the movie camera icon at the bottom of your screen.
Toad for Data Analysts, Tips ‘n’ Tricks or Things Everyone Should Know about TDA Just what is Toad for Data Analysts? Toad is a brand at Quest. We have several tools that have been built explicitly for developers and administrators in the Oracle, DB2, SQL Server,