Transcription
ResearchAsset AllocationJune 2021Sector Rotation:Can theApproach Workin DifferentCountries?Daniel Ung, CFA, CAIA, FRMHead of Quantitative Research & Analysis, SPDR ETFModel Portfolio Solutions, State Street Global AdvisorsShankar AbburuQuantitative Research & Analysis, SPDR ETF ModelPortfolio Solutions, State Street Global Advisors
SPDR — The Powerhouseof SectorsExperiencedManagementA leader in ETFs with more than 984 billion globally.1 Track record of managing sector ETFssince 1998.Physical ReplicationOne of the only providers with a full suite of physically replicated World, US and Europe sectorETFs in Europe.Cost-Efficient*World UCITS Sector ETFs: 0.30%US UCITS Sector ETFs: 0.15%Europe UCITS Sector ETFs: 0.23%1 Sources: Bloomberg Finance L.P., State Street Global Advisors, as of 31 March 2021.* Frequent trading of ETFs could significantly increase commissions and other costs such that they may offset any savings from low fees or costs.Sector Rotation: Can the Approach Work in Different Countries?2
Contents5Sector Rotation Across Regions7 Sector Selection ResearchModel Methodology10Strategy PerformanceSector Rotation: Can the Approach Work in Different Countries?3
Executive SummaryResearch on sector rotation, which is a popular tactical asset allocation technique, often centreson using price momentum as the sole criterion to identify outperforming sectors. The aim hereis to give investors ideas on implementing a tactical sector rotation strategy systematicallyusing sector ETF building blocks. In this paper, we examine the viability of implementing a sectorrotation strategy using a blend of parameters. These include macroeconomic indicators andfundamental information, in addition to price momentum.The selection approach was simulated across different geographies (namely the US, Europe andWorld developed markets) and rebalanced at the end of every month. We call this approach theSector Selection Research Model.Results show that the sector rotation strategy beat its respective benchmarks across all regionsover the entire period, and with diminished volatility. The tactical nature of the allocation meansthat the portfolio turnover, which is a major driver of transaction costs, was remarkably high( 200%).2 Even so, the outperformance of the simulated sector rotation strategies remainedrobust after including estimated transaction costs. This suggests there may be merit incombining multiple criteria to select the most attractive sectors.2 Source: State Street Global Advisors, as of 31 March 2021.Sector Rotation: Can the Approach Work in Different Countries?4
Sector RotationAcross RegionsCan SectorRotation Work inDifferent Countries?Sector allocation has been one of the main pillars in institutional equity portfolio managementand is a key component of tactical asset allocation. The central principle of this investmenttechnique relates to the ability of investors to back sections of the market that are experiencingfavourable conditions while avoiding those in distress.Most Existing Researchis Based on MomentumApplied to the USMuch of the publicly available research concentrates on approaches to sector rotation in theUS. However, its applicability to other regions attracts far less focus and is often overlooked.Commentators have offered various explanations for this observation. Some believe thatregions outside of the US lack the sector diversity needed to implement a viable sector rotationstrategy. In the past, these challenges were compounded by the limited availability of liquid andcompetitively priced sector building blocks needed to execute a rotation strategy successfully.The rise of sector ETFs has eliminated that last hurdle. The ETF trend appears set to consolidateeven further as a high dispersion of sector returns may give investors more profit-makingopportunities. Indeed, the current spread between global sector returns continues to widen toits largest level since 2000.1At the heart of sector rotation strategies is the tenet that return can be improved by timing ortilting to sectors on the strength of economic or other quantitative information. Of the differentmethods used to pick sectors, price momentum is by far the most studied. For instance,Moskowitz and Grinblat (1999)2 reviewed the returns of single stocks and sectors between1963 and 1995 and concluded that momentum strategies applied to sectors generated a higherreturn than those applied to individual stocks.Other authors, such as Burch and Swaminathan (2001), found that institutional investors — mostnotably, insurance companies, banks, investment advisors and fund managers — often usemomentum as a means of making their equity investment selections.Besides momentum, another extensively employed technique is to consider macroeconomicdata and the business cycle. The rationale behind this is that if the correct phase in the businesscycle is identified, then it is possible to predict the performance of different sectors. Kouzmenkoand Nagy (2014)3 assessed the relationship between sector performance and business cyclesbetween 1976 and 2009 using both inflation and the OCED Composite Leading Indicators.They found that the returns of cyclical sectors were higher in economic expansions thancountercyclical ones.Sector Rotation: Can the Approach Work in Different Countries?5
In this paper, we seek to add to the current body of research in this area by examining theperformance of a sector rotation technique that blends both macroeconomic, fundamental andquantitative data, including price momentum, in different regions. To test the feasibility acrossdifferent geographies, the strategy — which is known as the Sector Selection Research Model —was created and tested in the US, Europe and World developed markets.In our study, we also examined the impact of estimated trading costs on return. The initialselection universes used for the analysis include the 11 GICS sectors that make up the S&P 500,MSCI Europe and MSCI World Indices. These sectors are communication services, energy,materials, health care, industrials, consumer discretionary, consumer staples, financials, realestate, information technology and utilities. In addition to using publicly available sources forprice and fundamental data, the analysis in this research also utilises proprietary information oninvestor positioning derived from anonymised custody data of institutional investors from StateStreet Global Markets.Sector Rotation: Can the Approach Work in Different Countries?6
Sector SelectionResearch ModelHow Does theModel Work?The Sector Selection Research Model deploys a rule-based, sector rotation approach thattargets the most relatively attractive sectors using a blend of price, macroeconomic andfundamental factors. The importance of these selection factors is captured in the dynamicweighting scheme of the research model.Furthermore, the model provides for a mechanism that ensures risk is controlled andopportunities arising from dispersion are seized. In all, the approach comprises two majorsteps: sector selection and sector weighting. This process is repeated on a monthly basis.Sector SelectionSectors are chosen based on three factors, hereafter known as ‘components.’ Thesecomponents are: price momentum, macroeconomic environment and fundamental data(see Figure 1). Sector selections are conducted independently and are based solely on thecriteria that make up the component and the best five sectors are selected in each component.Once the selections are determined, a return time series is generated for that component.If all the sectors record a negative reading across most of the criteria in a given component,no sectors will be selected and the return for the month is assumed to be cash.Figure 1 How the Sector Selection Research Model Selects SectorsSector SelectionSector MomentumMacroeconomic IndicatorsSector Fundamentals12-Month Price MomentumLeading Economic IndicatorTrailing Fundamental RatiosROE, Net Profit MarginPoint-in-Time InvestorFlow PositioningCiti Economic Surprise IndicatorAnalyst ForecastsChange in % upgrades — Changein % DowngradesExcluded: Overcrowded SectorHoldings (90th percentile)Sector MomentumTime SeriesMacro SelectionTime SeriesFundamental SelectionTime SeriesSource: State Street Global Advisors. For Illustrative purposes only.Sector Rotation: Can the Approach Work in Different Countries?7
Sector Selections areDone IndependentlyUsing Momentum,Macroeconomicsand Fundamentals Sector Momentum Component In this component, sectors are ranked based on thehistorical 12-month price momentum as well as the most recent investor flow positioningmetric, which is a proprietary State Street indicator that shows how real money investors arepositioned. Sectors that are heavily held by investors, the so-called ‘overcrowded sectors,’ arealso removed at this stage. Macroeconomic Indicators Component The current macroeconomic regime isdetermined principally by leading economic indicators, supported by the Citi EconomicSurprise Index. Once the current regime is ascertained, sectors are chosen on the strengthof their past performance whilst being in the same macroeconomic regime in the past. Sector Fundamentals Component Sector fundamentals account for both trailingfundamental information as well as forward-looking analyst consensus forecasts. Trailinginformation includes return on equity and net profit margin (or, in the instance of the financesector, net interest margin). On the other hand, forward-looking information includes thepercentage change between analyst upgrades and downgrades for a given sector. Sectorsare then classified by means of a blend of trailing and forward-looking measures.Sector WeightingSector weighting is influenced both by the dynamic weighting of the components as well as thesubsequent calibration of final weights. This approach is designed to limit risk and capitalise onopportunities stemming from sector dispersion.Weighting is Based onthe Relative Importanceof Components,as well as Risk Controland DispersionHaving selected the most relatively attractive sectors in the previous step, the research modelapplies a dynamic weighting scheme to reflect the relative importance of the components.This ultimately affects the weight of the sectors that the strategy chooses and is achievedthrough a mean-variance optimisation process, which uses the time series of the componentscomputed previously, in such a way as to maximise the portfolio risk-adjusted return(see Figure 2). The outcome of this process is what produces the ‘pure sector strategy.’Figure 2 The Dynamic Weighting Scheme of the Components in the Research ModelSector SelectionSector MomentumMacroeconomic IndicatorsSector ce optimisationover 3 years, subject to constraintsPure Sector StrategySource: State Street Global Advisors. For illustrative purposes only.Sector Rotation: Can the Approach Work in Different Countries?8
Figure 3The Allocationin Each of theComponents in theUS Sector SelectionResearch Model ce: State Street Global Advisors. Monthly weights as of March 2020.The final step in determining the sector weights involves restricting the amount of risk the puresector strategy incurs, as well as encouraging it to run more risk where opportunities fromdispersion emerge. To avoid running excessive risk, the Sector Selection Research Model targetsa tracking error of 10% p.a. and any excess tracking error is curbed through increasing theallocation in the benchmark.In addition, the research model also evaluates whether there is a sizeable opportunity inmaking sector bets by examining the average sector dispersion. A high sector dispersionsignifies that there is a material difference between the best and worst performing sectorand that, if the sector bet is correct, there is potentially a substantial gain from it. For thisreason, the research model has embedded a mechanism whereby if there is material sectordispersion, it will reduce the allocation in the benchmark and boost the allocation in the puresector strategy and vice versa.Sector Rotation: Can the Approach Work in Different Countries?9
Strategy PerformanceOverviewHere we examine the allocation sector decisions of the Sector Selection Research Model in eachregion. We also analyse how the strategies performed against their reference benchmarks overthe entire study period, as well as during specific historical periods.US Sector SelectionIn the US, the US Sector Selection Research Model (SSRM) exceeded the S&P 500 benchmarkover the entire study period (January 1999 to February 2021) and in the majority of the calendaryears (see Figure 5). On an absolute basis, the model outperformed the S&P 500 benchmark byaround 3% p.a. with a correspondingly lower volatility and, together, this produced a strong riskadjusted return of 0.64, which is nearly twice that of the benchmark (see Figure 4). This level ofperformance was achieved by virtue of the strategy’s dynamic monthly rebalancing mechanism.Another notable observation was the seemingly defensive nature of the sector strategy, whichis evidenced by having a quite lower market beta of around 0.80 and a substantially lowermaximum drawdown than its benchmark (-40% versus -54%). We can potentially attributethis observation to the strategy’s capacity to allocate into cash or defensive sectors duringbear markets.However, during the last year the strategy underperformed against S&P 500 benchmark. Thisunderperformance was mainly due to a lack of direction and heightened volatility in the financialmarkets. That being said, the strategy incurred a lower drawdown than the S&P 500 during theCOVID-19 market turmoil.Figure 4Risk-ReturnCharacteristics ofUS Sector SelectionResearch ModelAnnual Return (%)Annual Volatility (%)Return per unit RiskMaximum Drawdown (%)Sector Selection Research Model(without costs)*S&P 500 Net Total : Bloomberg Finance L.P., State Street Global Advisors. As of April 2021. Monthly data from January 1999 to February2021. Past performance is not a reliable indicator of future performance. Index returns are unmanaged and do not reflect thededuction of any fees or expenses. This information should not be considered a recommendation to invest in a particularsector or to buy or sell any security shown. It is not known whether the sectors or securities shown will be profitable in thefuture. The results shown represent current results generated by our Sector Selection Research Model. The results donot reflect actual trading and do not reflect the impact that material economic and market factors may have had on StateStreet Global Advisors’ decision-making. The results shown were achieved by means of a mathematical formula, and are notindicative of actual performance which could differ substantially. The performance reflects management fees, transactioncosts, and other fees expenses a client would have to pay.* Transaction costs, which include taxes, commissions and trading costs, are assumed to be minimal, such that there is little tono impact on the categories above.Sector Rotation: Can the Approach Work in Different Countries?10
Figure 5 CalendarYear Returns of USSector SelectionResearch ModelCompared toS&P 50040Calendar Year Returns (%)30201022 2519121452014 14 1110 1354-2019181311425 2718 191212216161411-10 -10-13-1422-9-5-25-30-33-40-50-6029 2760-1023-471999 2000 2001 2002 2003 2004 2005 2006 2007 2008 2009 2010 2011 2012 2013 2014 2015 2016 2017 2018 2019 2020 YTD2021SSRM US Strategy (without cost)S&P 500Source: Bloomberg Finance L.P., State Street Global Advisors. As of May 2021. Monthly data from January 1999 to February 2021. Past performance is not a reliableindicator of future performance. Index returns are unmanaged and do not reflect the deduction of any fees or expenses. The results shown represent current resultsgeneratedby ourSectorSelectionX AxisLabelGoesHere (IfResearchNeeded) Model. The results do not reflect actual trading and do not reflect the impact that material economic and market factorsmay have had on State Street Global Advisors’s decision-making. The results shown were achieved by means of a mathematical formula, and are not indicative of actualperformance which could differ substantially. The performance reflects management fees, transaction costs, and other fees expenses a client would have to pay.European SectorSelectionThe sector selection strategy in Europe surpassed its MSCI Europe benchmark on an absolutebasis over the study period, which spans from January 2001 to February 2021 (see Figure 6).Risk-adjusted performance of the sector selection research model was equally robust at morethan double that of the benchmark. The more anticyclical nature of the strategy also meansthat its maximum drawdown over the entire study period was much shallower. As seen in the USmodel, the European counterpart was dynamic and racked up a portfolio turnover of 200% p.a.,owing to its embedded monthly rebalancing feature.Judged over the entire period, the strategy only assigned a modest weight to cash and did nothave any material sector biases. A careful examination of the strategy’s allocation decisionsshows that it was overweight consumer staples, especially in the second half of the period whenwe saw heightened turbulence in the equity markets.Over recent years, the strategy outperformed significantly especially during periods of marketstress. A case in point is the turbulence experienced in the financial markets at the start of theCOVID-19 pandemic. The drawdown experienced by the strategy was 13%, which was just underhalf the amount the MSCI Europe benchmark experienced (24%).Sector Rotation: Can the Approach Work in Different Countries?11
Figure 6Risk-ReturnCharacteristics of EuropeSector Selection ResearchModel from January 1999to February 2021Sector Selection Research Model(without costs)MSCI Europe NetTotal Return4.872.95Annual Volatility (%)12.1115.53Return per unit Risk0.350.11-42.66-56.18Annual Return (%)Maximum Drawdown (%)Figure 7 CalendarYear Returns ofEurope SectorSelection ResearchModel Compared toMSCI Europe40Calendar Returns (%)302014 14 1211100231925 271518613161011473-10231812813-8-8-11-20-17 -1823141065-5-1122-3-30-40-37-50-60-70-43-572001 2002 2003 2004 2005 2006 2007 2008 2009 2010 2011 2012 2013 2014 2015 2016 2017 2018 2019 2020 YTD2021SSRM Europe (without cost)MSCI EuropeSource: Bloomberg Finance L.P., State Street Global Advisors. As of May 2021. Monthly data from January 1999 to February 2021. Past performance is not a reliableindicator of future performance. Index returns are unmanaged and do not reflect the deduction of any fees or expenses. The results shown represent current resultsgeneratedby ourSectorSelectionX AxisLabelGoesHere (IfResearchNeeded) Model. The results do not reflect actual trading and do not reflect the impact that material economic and market factorsmay have had on State Street Global Advisors’s decision-making. The results shown were achieved by means of a mathematical formula, and are not indicative of actualperformance which could differ substantially. The performance reflects management fees, transaction costs, and other fees expenses a client would have to pay.World SectorSelectionSimilar to both the US and Europe, the World Sector Selection Research Model outperformedthe MSCI World benchmark on both an absolute and relative basis (see Figure 8). This can partlybe attributed to the monthly rebalancing mechanism, which has allowed it to react to prevailingmarket conditions. As a result, the strategy incurred an average portfolio turnover of around200% p.a., which is a typical feature of highly tactical allocation strategies.When viewed over the whole period, sector allocations were anodyne as they were la
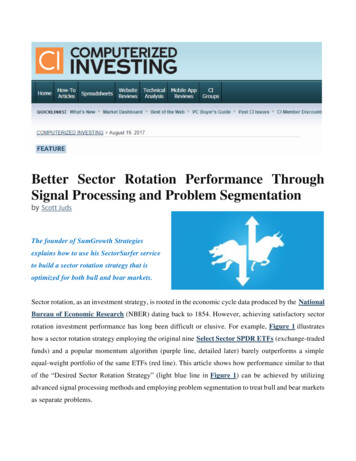
Research on sector rotation, which is a popular tactical asset allocation technique, often centres on using price momentum as the sole criterion to identify outperforming sectors. The aim here is to give investors ideas on implementing a tactical sector rotation
