Transcription
ANTIFRAGILE ASSET ALLOCATION MODELGioele Giordano, CFTeItalian Society of Technical Analysis56, Corso Magenta, 20123 Milano, Italygiordano.gioele@gmail.comABSTRACTMost of the active investment strategies focus on the constant excess returns generation over time,through a dynamic management of positions on the market. These positions are subject to possibleBlack Swans, events that are by definition unpredictable, destructive and only explainableafterwards. The conventional approach to risk management is to diversify investments across assetclasses, however the crashes of 2001 (Dotcom bubble) and 2008 (Great Financial Crisis) questionedthose portfolios so far considered well diversified. The risk of such events occurring is called tailrisk. Over the last few years, many tail risk protection strategies have spread, often producingunsatisfactory results. This paper aims to demonstrate how the combination of an activequantitative investment model and an effective tail risk hedging strategy leads to the creation of anantifragile portfolio, immune to the black swans and able to exploit them to their advantage.1
I.INTRODUCTIONIn the financial world the Black Swan concept has found a considerable diffusion thanks to Taleb’s(2007) literary book, the New York Times bestseller “The Black Swan”, in combination with theturbulences in financial markets.There are three main factors that describe a Black Swan event: Rational explanations are given after a black swan event occurs. This is based on the factthat humans are able to explain and justify unexpected phenomena after it occurred. A black swan event always has an extreme impact: the Great Financial Crisis had anextreme and destructive impact on the financial markets. A black swan event is unexpected and is deemed "improbable". It is impossible to predict ablack swan event ahead of time because it is unthinkable for most of the people until ithappens.The main issue of Black Swans is the inability for investors to predict such extremes events (tail riskevents) and correctly incorporate their impact into portfolios; they try to apply financial modelsbased on known probabilities instead of actually taking into account their unpredictability.Financial disasters are therefore very similar to natural disasters. Earthquakes, for example, areconsidered to be random events, accidental and unpredictable. The occurrence of seismic events onthe earth's surface is a certainty, the uncertainty concerns where they will occur, when and to whatextent.2
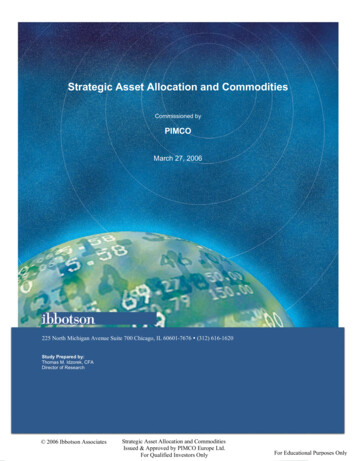
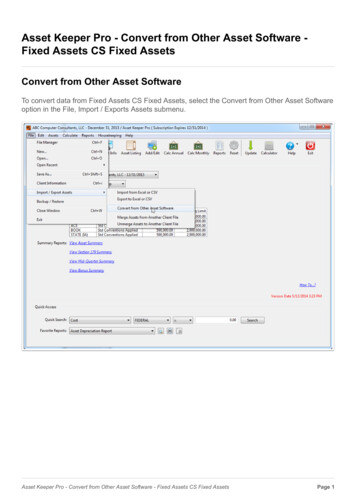
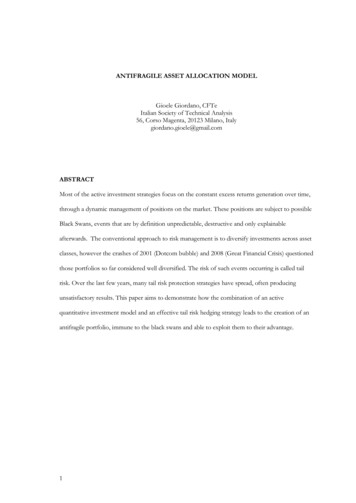
Figure 1. Relative annual energy release from earthquakes, magnitude 6 or greater, from 1900 to 2010. Source: U.SGeological Survey, http://www.johnstonsarchive.net/Figure 2. Dow Jones Industrial Average (black). Black Swan Indicator (red) shows the market corrections. Monthlydata, from February 1915 to February 2019.Through the use of historical data and statistical models it is possible to identify areas of higherseismic risk, the same way as in the financial markets it is possible to identify the riskiest assetclasses based on volatility.3
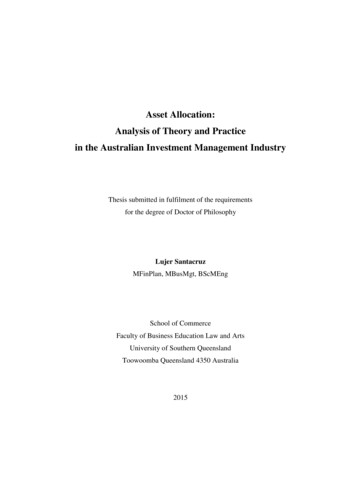
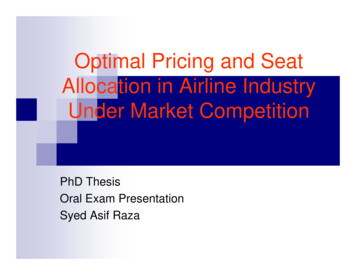
Figure 3. Areas across United States that are most likely to experience a significant earthquake in the next 50 years.Source: U.S Geological Survey.Table 1. Asset Classes’ average annual return and standard deviation, from 1926 to 2011. Source: BofA MerrillLunch, Ibbotson.The unpredictability of earthquakes, however, has not prevented humanity from building houses,selecting the most suitable land and the best technologies to make the building as resistant andflexible as possible to seismic events. The rarity, inexplicability and uncertainty of Black Swansmakes our investment management models and, consequently, our portfolios fragile. The bestantidote against fragility is Antifragility, a system that can take advantage of randomness, chaos.This paper aims to demonstrate how merging the Sector Rotation Model, a sector rotationquantitative strategy, and the Black Swan Hedging Model, a tail risk hedging strategy, leads to amodel capable of producing excess returns and outperformance both during positive market phasesas well as during extremely negative events. I named such model Antifragile Asset AllocationModel.4
II.BACKGROUND AND METHODOLOGYThis paper originates from considerations about the studies of different authors, providing a linkbetween different concepts and methods through personal implementations. It is worth mentioningthe most influential authors, with reference to their contribution: Nassim Nicholas Taleb, for his contribution in defining the concept of Black Swans,indicating how to manage them through Antifragitility; Wouter J. Keller and Hugo S. van Putten, for their contribution in the definition of a newquantitative strategy, the Flexible Asset Allocation; Meb Faber, for his research on quantitative analysis and non-discretionary strategies; Welles Wilder, for technical studies on breakout, range and trend concept models; Robert Engle and Tim Bollerslev, for the development of analytical methods of economichistorical series with dynamic volatility over time; Martin J.Pring, for the works on the stages of the economic cycle and their definition.The paper consists of four parts. The first part covers the illustration of the Sector Rotation Model,managed by a ranking algorithm that selects the best sectors. The main quantitative factors of theranking system are explained and the calculations details are shown. The second part explains howsome tail risk hedging strategies work and how they can be improved through a more adaptivestrategy such as the Black Swan Hedging Model. The third part shows the Antifragile AssetAllocation Model, obtained by merging the models mentioned above. The final part illustrates theresults of a model backtesting, represented through monthly performances from June 2004 toFebruary 2019.5
III.SECTOR ROTATION MODELSector Rotation consists of shifting investment assets from one sector of the economy to another,in order to capture returns from different market cycles. Sector Rotation strategies are popularbecause they provide diversification and risk-adjusted returns over time.The Sector Rotation Model consists of 11 sectors of the S&P500, represented by their respectiveETFs.Table 2. Sector Rotation Model: list of ETFs.The Sector Rotation Model is the main pillar of the Antifragile Asset Allocation Model, because ofits ability to adapt to market cycles (Recession, Early Recover, Late Recovery, Early Recession)providing the portfolio flexibility and robustness.Each month the Sector Rotation Model ranks the 11 ETFs based on the following factors: (M) Absolute Momentum: to determine assets’ profitability. Calculation: 4 monthsmomentum (ROC – Rate of Change) (V) Volatility Model: to determine assets’ risk. Calculation: edited version of GARCHModel. (C) Average Relative Correlations: to achieve diversification. Calculation: 4 months averagecorrelation across the ETFs (T) ATR Trend/Breakout System: to determine assets’ directionality. Calculation: ATRBands on daily timeframe. Upper Band 42 periods ATR Highest Close of 63 periods.Lower Band 42 periods ATR Highest Low of 105 periods.6
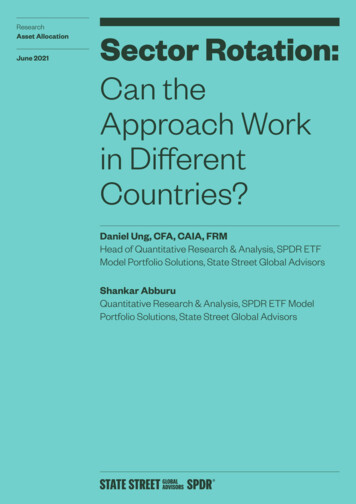
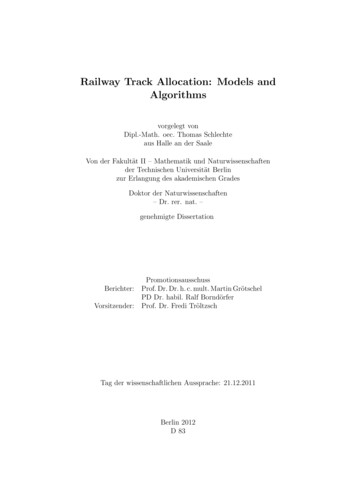
𝑇𝑅𝐴𝑁𝐾 (𝑤𝑀 𝑅𝑎𝑛𝑘(𝑀) 𝑤𝑉 𝑅𝑎𝑛𝑘(𝑉) 𝑤𝐶 𝑅𝑎𝑛𝑘(𝐶) 𝑤𝑇 𝑇) 𝑀/𝑛Where:𝑅𝑎𝑛𝑘(𝑀) ranking from 1 to 11 of the asset based on the Absolute Momentum.𝑅𝑎𝑛𝑘(𝑉) ranking from 1 to 11 of the asset based on the Volatility Model𝑅𝑎𝑛𝑘(𝐶) ranking from 1 to 11 of the asset based on the Average Relative Correlation𝑇 ATR Trend/Breakout System.𝑤𝑀 % weight assigned to 𝑅𝑎𝑛𝑘(𝑀) for TRank evaluation𝑤𝑉 % weight assigned to 𝑅𝑎𝑛𝑘(𝑉) for TRank evaluation𝑤𝐶 % weight assigned to 𝑅𝑎𝑛𝑘(𝐶) for TRank evaluation𝑤𝑇 % weight assigned to 𝑅𝑎𝑛𝑘(𝑇) for TRank evaluation𝑛 number of assetsThe best 5 ETFs are selected based on each TRank and are equally weighted in the portfolio.Figure 5. Sector Rotation Mode (red) and SPDR S&P500 (black), performances comparison. Monthly Data, fromAugust 2003 to February 2019.7(1)
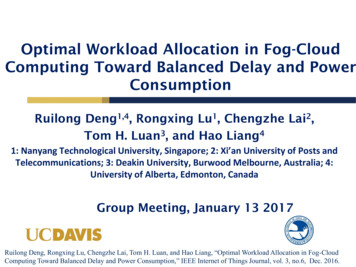
Table 3. Sector Rotation Model, historical returns. Monthly Data, from August 2003 to February 2019.Figure 6. Sector Rotation Model, allocation across time. Monthly data, from August 2003 to February 2019.The Rotation Sector Model beats the S&P500 index over time, constantly outperforming it. Themodel demonstrates flexibility, adapting to different market cycles, and robustness, showingresilience to medium market corrections. However, the model is not immune to crashes and blackswans, so it needs a dedicated protection against such events.8
IV.BLACK SWAN HEDGING STRATEGYIn statistics “tails” are defined as the extremes of a distribution, the outcomes that have a smallprobability of occurring. In finance tail risk represents the loss at the most negative part of an assetor portfolio’s return distribution caused by infrequent and outsized downside market moves. Manystudies show that equity market returns do not follow a normal distribution, with tails fatter thanpredicted. The traditional approach to managing portfolio risk involves investments diversificationamongst not correlated assets classes: if the correlation amongst assets is low, this will mitigate theimpact of big market corrections on the portfolio. However extreme losses occur during times ofcrisis or financial market distress, characterized by a contagion effect and a pronounced rise inmany asset classes correlations to equities.Recent market turmoils have highlighted that extreme market moves occur more frequently thanmost statistical models predict and diversification strategies typically break down in thesecircumstances. The infamous black swans of the first two decades of the 21st century generatedattention and investment flows aimed to hedge against tail risk. Theoretically, a tail risk strategy actsas a sort of insurance, since it has a low or negative required rate of return but it pays off at times ofmarket distress. There are several Tail Risk Hedging strategies (Puts, Delta-hedged options,volatility products) but there is a significant disagreement regarding the efficacy of such strategiesand their cost/benefit tradeoffs.Figure 7. Hypothetical Cumulative Growth of 100 into 1-Year OTM Puts on the S&P. Monthly Data, from 1996 to2012. Source: AQR.The following chart represents how adding a permanent Tail Risk strategy that buys monthly 5%out of the money options on the S&P500 with 90% of allocation invested in 10-year U.S.Government Bonds affects portfolio returns.9
Table 4. Tail Risk strategy and S&P500 performance comparison. From June 1986 to December 2012. Source: MebFaber/GFDIn all cases the Tail Risk Strategy brings a decrease in drawdowns but the reduction in volatilitydoes not compensate for the reduction in returns, so Sharpe Ratio worsens. According to thewriter's opinion, the current tail risk strategies are too static and unable to adapt to different typesof market corrections.The Black Swan Hedging Model, hereby explained, consists of 7 ETFs representing different typesof asset classes that can benefit from market corrections of different nature.Table 5. Black Swan Hedging Model: list of ETFs.The best 3 ETFs will be taken in consideration for the upcoming allocation, based on the rankingsystem described in the prior paragraph. For each of the 3 ETFs, if it has a positive AbsoluteMomentum (M), then it will be included in the portfolio, otherwise its weighting will be replacedwith Cash, represented by iShares 1-3 Year Treasury Bond ETF.In an extreme case where all the top 3 ETFs have a negative Absolute Momentum (M), Cash willassume a 100% weighting.10
Figure 8. Black Swan Hedging Model (red) and SPDR S&P500 (black), performances comparison. Monthly Data, fromAugust 2003 to February 2019Table 6. Black Swan Hedging Model, historical returns. Monthly Data, from August 2003 to February 2019Table 7. Black Swan Hedging Model, , statistics summaryThe Black Swan Hedging Model provides effective protection against market corrections,demonstrating the ability to take advantage of the most extreme events.11
Figure 9. Black Swan Hedging Model, allocation across time. Monthly data, from August 2003 to February 2019V.ANTIFRAGILITYThe Antifragile Asset Allocation Model represents the union between the Sector Rotation Modeland the Black Swan Hedging Model. The Sector Rotation Model selects the best 5 sector ETFs.For each of the 5 ETFs, if it has a positive Absolute Momentum (M), then it will be included in theAntifragile Portfolio with a 20% weighting. If all the top 5 sector ETFs have a negative AbsoluteMomentum (M), the Black Swan Hedging Model allocation will assume a 100% weighting.The unassigned weighting will be replaced with the Black Swan Hedging Model allocation.12
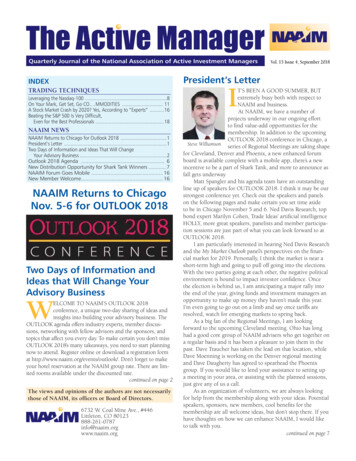
Table 8. Antifragile Asset Allocation Model, list of ETFs and respective weighting, updated to 02/19/2019.Figure 10. Antifragile Asset Allocation Model (red) and SPDR S&P500 (black), performances comparison. MonthlyData, from August 2003 to February 2019.13
Table 9. Antifragile Asset Allocation Model, historical returns. Monthly data, from August 2003 to February 2019The Antifragile Asset Allocation Model maintains the qualities of the strategies which it derivesfrom, showing adaptability to different market cycles, resilience against market corrections andantifragility against extreme events.VI.APPLICATION AND EMPIRICAL TESTSThe Antifragile Asset Allocation Model works by applying the algorithms discussed in the previousparagraphs. The database is end-of-day and it is downloaded from Yahoo! Finance. Wherenecessary, interpolations have been made with consistent historical series in order to achievetemporal homogeneity.Data interpolation was performed on RStudio; Absolute Momentum, Volatility Model, AverageRelative Correlation and ATR Trend/Breakout System indicators were programmed on Metastock;classification and the rankings were programmed on Excel. The test was performed on a USDPortfolio, consisting mainly of ETFs, to ens
ANTIFRAGILE ASSET ALLOCATION MODEL Gioele Giordano, CFTe Italian Society of Technical Analysis 56, Corso Magenta, 20123 Milano, Italy giordano.gioele@gmail.com ABSTRACT Most of the active investment strategies focus on the constant excess returns generation over time, through a dynamic management of positions on the market. These positions are subject to possible Black