Transcription
Analysis of Complex Rotation Spectra1. Fourier and All Poles transforms2. Maximum Entropy spectral analysis3. Time domain analysis versus frequency domainanalysis
Grouping for TF DataA dephasing effect will reduce the asymmetry of TF data if notenough groups are used:N 4N 8TF Groups16842Dephasing factor sin(p/N) / (p/N)Dephasing Factor99 %98 %90 %64 %i.e. 8 TF groups are sufficient for most purposes
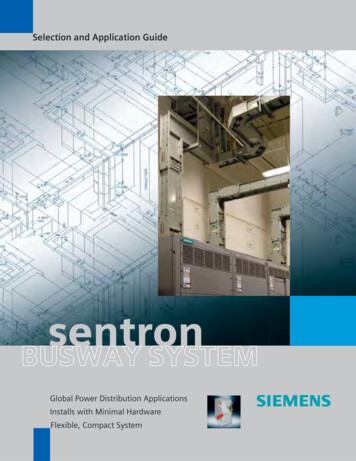
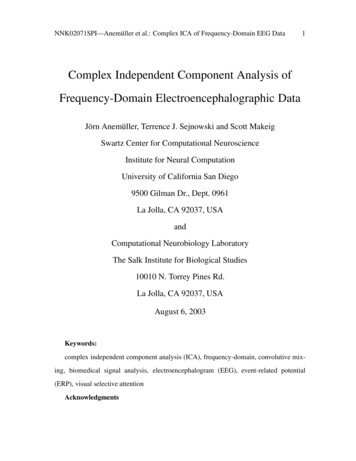
Fourier and All-Poles TransformsFFT (Fast Fourier Transform) is the standard way to convert from time domain tofrequency domain.FFT assumes frequency spectrum is well represented by array of evenly spacedpoints, which works well for spectra containing broad spectral features.However, if the spectrum contains very narrow features, other types of frequencytransform can work better.The All-Poles (maxent) method is one such method, which makes an expansion ofthe data in terms of a series of sharp frequenciesSee Press et al, Numerical Recipes, CUP for further details of the All-PolestransformAll transform methods assume that the data error is independent oftime, which is clearly not the case for mSR data.Data filtering (apodization) is an important step before transforming.
ApodizationApodization involves multiplying the time data by a smooth cutoff function (e.g. a Gaussian orexponential decay) before making the transform into frequency spaceThis addresses two problems:1) Finite time window of the data (e.g. 0 to 32 ms at ISIS)without apodization the instrument responsein frequency space is a sinc functionwith apodization the instrumental function becomes smoothwithout any troublesome lobes, however the frequencyresolution is lowered2) Decrease of signal to noise ratio at longer timesBy weighting towards early time data and against long time datathe S/N of the frequency spectrum is kept under controlFor narrow spectra one can turn off the apodization and directly model the instrumental functionin frequency space
Combining Groups: Power Spectra versusPhase-Corrected Cosine SpectraSpectral intensity from power spectraAdvantages:simplicitycopes with different t0 for different componentsDisadvantages:broadened spectral tailsnon-linear processing distorts errorsSpectral intensity from phase-corrected spectraAdvantages:no extra broadening or tailslinear processDisadvantages:phase estimation step neededproblem if t0 varies across spectrum
Fourier and All-Poles TransformsOptimal filtering time constant for a single undamped test frequency
Fourier and All-Poles TransformsA close pair of undamped test frequencies
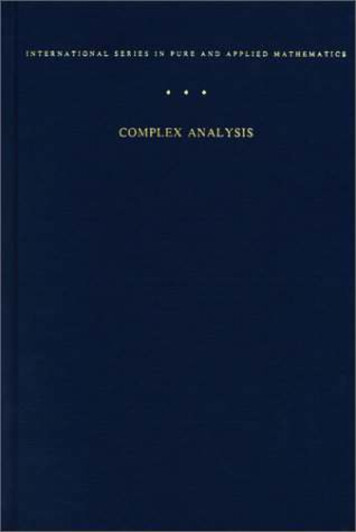
The Maximum Entropy MethodAvoids the noise problem and need for filtering; takes data errors fully into accountIterative procedure for constructing the frequency spectrum with the minimum structure(i.e. maximum entropy) that is consistent with the measured dataEntropy here is determined from the frequency spectrum pkS kpkplog kbbThe procedure involves maximising S – l c2 , where l is a Lagrange multipliera key point is that the model spectrum is being transformed rather than the dataSee Rainford and Daniell, Hyperfine Interactions 87, 1129 (1994)for a detailed discussion of using Maximum Entropy in mSRfor a general reference see:‘Maximum Entropy in Action’, Buck and Macaulay, OUP (1991)
The Maximum Entropy MethodDemonstration of MaxEnt using the test data used for the transforms
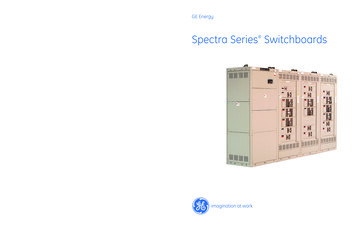
Organic Superconductor ExampleMaximum Entropy SpectraCharacteristic field distributiondue to vortex lattice
Time Domain Analysis versusFrequency Domain AnalysisSingle FrequencyFreq (MHz)Width (MHz)Test Data1.00000.000Time domain fit0.9998(1)0.001(1)Maximum Entropy1.0060.003Freq (MHz)Width (MHz)Pair of FrequenciesTest Data0.9500,1.05000.000,0.000Time domain fit0.9493(1)1.0499(3)0.003(3)0.004(3)Maximum Entropy0.9561.0540.0020.005
Time Domain Analysis versusFrequency Domain AnalysisTransforms are good for determining a qualitative picture of data:FFT best for spectra containing relatively broad featuresAll-poles transform best for spectra composed of sharp featuresIterative Maximum Entropy Method gives an ‘unbiased’ view of the databut Time Domain Fitting gives best ultimate accuracy, provided the correctmodel is being used.CONCLUSIONA combination of Frequency Domain and TimeDomain analysis usually works best in practice
Test Data 0.9500, 1.0500 0.000, 0.000 Time domain fit 0.9493(1) 1.0499(3) 0.003(3) 0.004(3) Maximum Entropy 0.956 1.054 0.002 0.005. Time Domain Analysis versus Frequency Domain Analysis Transforms are good for determining a qualitative picture of data: FFT best for spectra containing relatively broad features All-poles transform best for spectra composed of sharp features Iterative Maximum .