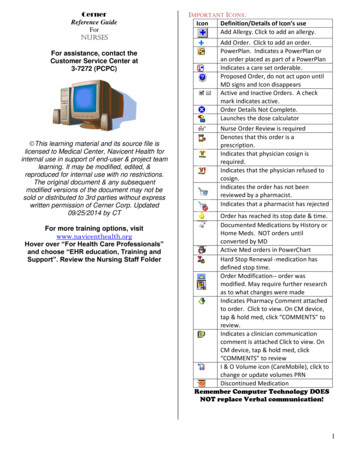
Transcription
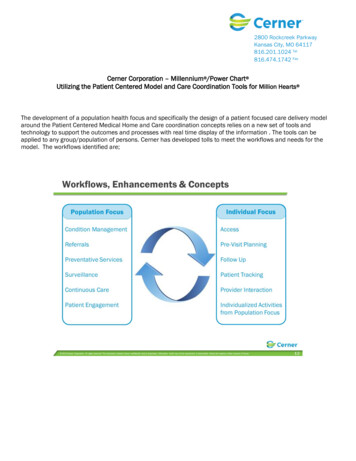
2800 Rockcreek ParkwayKansas City, MO 64117816.201.1024 Tel816.474.1742 FaxCerner Corporation – Millennium /Power Chart Utilizing the Patient Centered Model and Care Coordination Tools for Million Hearts The development of a population health focus and specifically the design of a patient focused care delivery modelaround the Patient Centered Medical Home and Care coordination concepts relies on a new set of tools andtechnology to support the outcomes and processes with real time display of the information . The tools can beapplied to any group/population of persons. Cerner has developed tolls to meet the workflows and needs for themodel. The workflows identified are;
The specific tools include:The following pages will walk you through the tools and how they are utilized and relate to Million Hearts andexamples of quality measures related to cardiovascular disease: smoking & tobacco use cessation, high bloodpressure, and LDL-C screening. The screenshots and descriptions follow a care coordinator workflow but can beused by providers or any role/person on the care team.2
First Step (worklist registry)The first step in the workflow is to identify your patient list e.g. the patients you are following within your practicethat are assigned to you. Open Power Chart and in the organizer level tool bar click on the registry worklist.Displays number of patients on my list.Data is real time and refreshesautomatically.This displays all the patients you are following.3
Step 2You can filter the list numerous ways by expanding each filter on the left side and choosing what you would like toview. All the Million Hearts quality measures can be “filtered for” and viewed both at the population healthperspective as well as the specific patient level. For Hypertensive patients, you can filter the list to find thosepatients with Hypertension. For Hypertension, you would expand the Conditions filter and check Hypertension;You will notice the list was revised and shows only those patients with Hypertension. The conditions are determinedby various data points but the most common criteria used is the diagnosis/problem list (ICD, SNOMED, LOINC).4
Step 3For High blood pressure, use the vital signs filter and you can choose the value you are looking for (130/90,140/80). You can use this filter to find patients with a specific BP reading (like greater than 140/90 over aspecified look back period (i.e. 180 days).5
Step 3 , continuedYou can choose to filter the list by one condition or by combinations of conditions. For example,The list was filtered to show those patients with CHF or Diabetes or Hyperlipidemia. (You have the option ofchoosing “And”/ “Or”).6
Step 4Further, you can filter by Health Expectations, based on best practice criteria. So for LDL, colorectal screening,Pneumovax, cervical screening, etc. you can choose from the list and filter;For Smoking Cessation;7
For BMI, you would filter on the measurements filter;8
Step 5To access specific patient/person information, the worklist also has an expanded view where the Summary Pagedisplays along with the ability to send messages, add comments, actions, patient goals, screenings (three views toshow the various sections of the Summary Page) as well as direct access to the patient record;9
Step 5, continuedStep 6From the expanded view page, you can create reminders, send invitations/letters and access most commonly usedforms, assessments and screenings documents.10
Step 7From the Summary page, you can click the header of each component to open that section of the chart. Forexample, patient goals. Clicking on this section header from the Summary Page will take you to the specificpatient’s goals page within the chart. Goals are in patient terminology and can be team or patient defined.11
Step 8To add a goal, click the blue plus sign located at the top of the component. To save goals, click the purple floppydisk on the top right side of the component. To print goals so the patient can take them home, click the icon withthe paper/magnifying glass on the top right side of the component.12
Step 9For any required reports, you can generate those reports through the Power Chart solution. Currently, meaningfuluse, PQRS reports come standard with the solution. For additional, specific NCQA reports, a reporting package isavailable.For those organizations that have purchased Cerner’s HealtheIntent cloud based solution and the associatedprograms (HealtheRegistries, HealtheCare and HealtheRecord), there is the ability to bring data from multiple datasources incuding disparate EMRs, Claims, Pharmacy, Lab and other data sources. Whether a person has an EDvisit across town, receives multiple prescriptions or has lab tests drawn elsewhere, the ability to access and viewthat data is possible – a true longitudinal record. The HealtheIntent platform and programs also has thecapabilities to not only view the information “face up” but also produce analytics, reports and dashboards.Specifically as it pertains to Million Hearts , below are screen shots and examples that can be viewed forHypertension.You can view the organization level performance – in this view, you can see all the registries included for thisorganization and the combined performance of all the providers within the organization. Hypertension is one of theregistries;You can see that 141 persons qualified for this registry, 90% of the measures associated with this registry havebeen met and that of the 141 persons, 41% of them met the criteria/measures (BP 140/90). You can view theprovider level data as well13
And then to the person level.In this case, the person had a blood pressure of 120/80 taken on October 19, 2015 therefore meeting the criteriafor the measures ( 140/90) and by hovering we can see where the data/information originated – in this case theEMR14
If the measure was NOT achieved, the tile would be red15
You can view the measures across time and venues through the Clinical Information tabIn addition, reports and analytics provide the ability to view data from multiple levels and requirements, such asACO, Contractual formulas, over time, across population. As an example, this report shows the ACO measures forthe organization on top with lower sections showing organization and provider percent met. Hovering over the “X”shows the underlying data16
Further capabilities exist through analytics17
Department of Health and Human Services, Office of the National Coordinator for Health Information Technology Subject The tools and how they are utilized and relate to Million Hearts and examples of quality measures related to cardiovascular disease: smoking & tobacco