Transcription
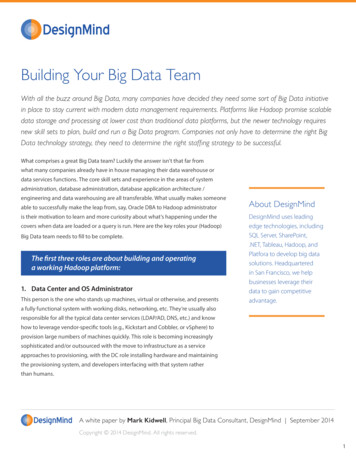
Journal of Business Cases and ApplicationsVolume 29STARFusion: Integrating Alteryx and Big Data Tools within theAccounting CurriculumJoseph M. RaganSaint Joseph's UniversityAdam F. DobroskeySaint Joseph's UniversityWilliam E. LeggSaint Joseph's UniversityCaroline E. TadduniSaint Joseph’s UniversityABSTRACTThis paper explores several sets of tools and technologies within the Accountingclassroom. It responds to a clarion call for accounting professors to incorporate more technologybased skills within their courses. In order to prepare students for careers in the accounting field,it also presents a technology delivery model for integration within advanced accounting coursesusing Alteryx and Tableau. Alteryx Designer is an ETL (Extract, Transform, Load) and DataAnalytics software that allows users to perform several types of analytics, including predictiveand spatial, as well as to develop business applications with a single workflow. Tableau is avisualization software that combines business intelligence platforms with interactive dashboardsand analytic applications – all in one display - that can be used for interpretation of a business’key performance indicators. Tableau can visualize data originating from several file types, suchas CSV files, SAP databases, and Microsoft Excel spreadsheets.Keywords: Data Analytics, Tableau, Alteryx, ETL, Data Visualization, Predictive Analytics, BigDataCopyright statement: Authors retain the copyright to the manuscripts published in AABRIjournals. Please see the AABRI Copyright Policy at http://www.aabri.com/copyright.htmlSTARFusion, Page 1
Journal of Business Cases and ApplicationsVolume 29INTRODUCTION AND PRIOR RESEARCHThis paper analyzes the implementation of an Accounting Information Systems courseproject completed by students within an undergraduate accounting curriculum. The purpose is toshow students the value of analytic reporting using Alteryx and Tableau. A survey administeredto 72 students enrolled in a typical Accounting Information Systems course was conducted andresponses were evaluated. The primary objective of this project is to: (1) provide betterunderstanding of the role that ETL and analytic packages offer to the modern accountant (2) togain confidence in the use of these types of tools (3) improve big data gathering capabilities andinformation analysis skills (4) develop and improve documentation and communicationcapabilities and (5) realize the presentation value that analytical tools offer in all aspects of theaccounting professionVisualization software has emerged in university business schools across the world. Itspurpose is to provide students with real business insights on how to manage and analyze vastamounts of data. Analytics has enjoyed remarkable growth in business – the challenge remains tooffset that growth with able professionals who are familiar with analytic tools and use those toolseffectively (Abbasi, Sarker, and Chiang, 2016). Rapid advances in technology have driven thegrowth of technology-driven strategies in education. The desire to produce learners with state-ofthe-art tools will be a dominant direction of education for many years to come. Learninganalytics crosses many discipline boundaries and diverse fields (Gašević et al, 2015). Agarwaland Dhar (2014) emphasize the benefit of using diverse data analysis methods and the challengeof incorporating them within classroom projects across multiple disciplines. Current literatureoffers many diverse types of data mining. techniques and analytical methods.According to research conducted by Davenport (2006) and Daniel (2015) the dataanalytics process of today’s businesses involves several challenges, primarily selecting andcategorizing voluminous data and analyzing how that data will be used to make decisions.Current ERP systems enable the capturing of metadata very effectively and efficiently. Thebiggest challenge today lies in creating meaningful analytic visualization reports. Alteryxanalytics is a tremendous platform allowing analysts to easily prep, blend, and interpret their datausing a repeatable workflow. Add to that the power of Tableau and you have a seamless processby which to interpret business decision making. Moffitt and Vasarhelyi (2013) recognize thataccountants have become the key figures in providing process strategic insight using analyticsskills necessary to envision and fulfill long-term objectives. They note that accountants are nolonger confined to just ledgers, but instead can use their expertise to interpret information inways that a traditional data analyst cannot.Reyes (2015) notes the necessity for accounting educators to sense these growingdemands and provide educational programming that adapts to their students’ skillsets toincorporate more analytic tools in the delivery of business education programs. Siegal, Sorensen,Klammer, and Richtermeyer (2010) emphasize that firms are demanding analytic skillsets beintegrated into all accounting coursework so as to enable students to become better, moretechnology-enabled professionals. Bichsel (2012) points to many shortfalls in the delivery ofaccounting curriculum in terms of analytic programming. The most effective way for accountingeducation to implement these technologies to incorporate elements of data analytics with a focuson real world applications into most accounting courses in the accounting curriculum. Thefollowing case study provides an efficient way to integrate analytics using two of the leadingtools, namely Alteryx and Tableau.STARFusion, Page 2
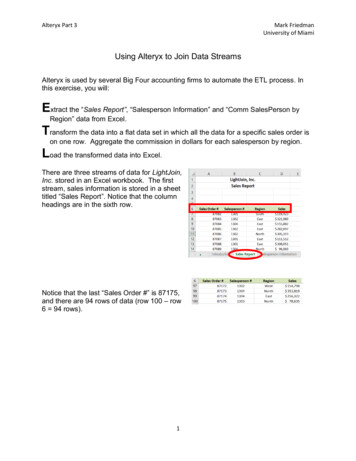
Journal of Business Cases and ApplicationsVolume 29CASE BACKGROUND: THE ZEUS CORPORATIONZeus Corporation is a privately held company that designs and manufactures outdooraccessories for men, women and children. While the company started by making clothing forrock and alpine climbing, they now offer products targeted towards bikers and other populationsof athletic product users. They are a large international company, operating in over 15 differentcountries and offering merchandise in 12 different product lines. Zeus, along with itssubsidiaries, has a large customer list, and generates high annual revenues compared to itscompetition. GBI is looking to acquire Zeus in order to take advantage of their product lines,retail locations, international outlets, and supply chain. A user of SAP S/4 HANA, Zeus Corp.holds all of their operations data in an SAP database. To store the company’s financial data in amore versatile format, Zeus Corp. exports their annual Operations Reports from an SAP databaseand saves it in the form of Microsoft Excel files, one for each of the past three fiscal years. Inorder to get an executive overview of Zeus’s transactions, GBI is looking to analyze Zeus’s threefiscal years’ worth of operations reports together in a single consolidated database. Likewise,they would like to be able to quickly add new years to this aggregated database for analyticspurposes. Finally, they would like to utilize the power of data visualization to determine if keyperformance indicators are up to GBI’s standards. GBI needs you to serve as a consultant toassess the overall performance of Zeus and identify key performance indicators that will help ArtVandelay determine if the company is a valuable acquisition target.The case and process overview is included as Appendix A at the end of this paper.PROJECT OBJECTIVESPhase 1: Zeus Corp. Database – Broken Down by 3 Fiscal YearsZeus Corp. retains its transactional data from SAP by creating Excel data extracts. Thisprocess is completed on a yearly basis, and files are independently stored in separate databases.For our analysis, we must aggregate the data from three prior years into one database. This willprovide us with more complete information, accurate visualizations, and precise forecasts. Thisphase begins the Extract, Transform, Load (ETL) process.Phase 2: Extract Data for Analysis – Filtering Key Information for Workflow AnalysisThe databases held by Zeus Corp. contain a multitude of information meant to be used byall facets of the enterprise. However, some of these measures are not required for our analysis,and other key metrics, such as Cost of Goods sold, are missing from the database and must begenerated. To keep the reports organized, we will remove columns that are unnecessary for ouranalysis. Likewise, we may desire summary reports to analyze independent variables in order tofurther analyze the company’s operations. This phase encompasses the Extract and Transformactions of the ETL process.Phase 3: Transform into Internal Report – Output Created for Summary of Analysis andEventual ExportSTARFusion, Page 3
Journal of Business Cases and ApplicationsVolume 29Once the data is cleansed and prepared for visualization, an output must be created.Outputs could be formatted in several different file types, including but not limited to: Excel,CSV, Tableau Data Extract, JSON, etc. Output selection is determined by the end user’spreferences for further visual analyses. This phase begins the Load action of the ETL process.Phase 4: Load Analysis into Visualization Software – This can be done using spreadsheetsoftware (Excel)The aggregated database alone is not sufficient for our analytic purposes. To gaininformation about the corporation on an enterprise level, we must load the newly createddatabase into a visualization software. This software will allow us to analyze multipledimensions of the business and obtain a solid understanding of the key performance indicators ofthe business. Our decision to acquire or not acquire Zeus Corp. will be based on the knowledgeobtained from these visualizations. This phase concludes the Load action of the ETL process.Phase 5: Predictive and Prescriptive Modeling – Allows Exploration of Measures andDimensions Over Time – Country and Multiple Variants. This will also enable preparationof the critical final report.Before visualizations are created, we must understand the information we wish to obtain.Primarily, we would like to understand the global reach of Zeus Corp., and how GBI’s supplychain and logistics channels can adapt to new markets. Likewise, we would like to create apredictive model to give our decision makers information about the future of the business basedon historical trends. Finally, it is important that Zeus Corp. owns successful product lines thatcomplement GBI’s existing products and generate future value for the business. Thesevisualizations will be used to generate a dashboard that will give a full view of the operations ofZeus Corp. over the last three years.ASSESSMENT OF LEARNINGAssessment of learning rubric is included in Appendix B.BEST PRACTICES AND LESSONS LEARNED Business analytics applications are best taught with a top-down approach allowingstudents to walk through pre-established modeling problems, slowly increasing theircomplexity. This is different from the normal course approach and is best with analytics.Teaching using analytics is an iterative approach that requires curiosity on the part of thestudents. The models are easy to use but require databases that are often challenging to obtain fromreal companies. Creating your own database can take time and resources. To this end, it isoptimal if you can create a partnership with a large corporate enterprise that wouldprovide databases to you. This information could be masked so as not to allow to accessproprietary data Students need multiple exposure to these types of products. Our experience is to includeit in a series of linked courses. For example, intermediate and advanced accounting. ForSTARFusion, Page 4
Journal of Business Cases and ApplicationsVolume 29example, exposing students to applications in intermediate accounting before they takethe advanced course. The key here again is the iterative process focusing on providingstudents with growing insights that evolve from the data emerging within theorganization. Students report best results when they have a sense of participating in areal-world problem-solving environment.CONCLUSION AND FUTURE DIRECTIONSFuture research should focus on additional activities that could engage students within theproject assignments. The case provided students with several years of financial data from asimulated company. It would be a worthy challenge to find data on their own and build it into aMicrosoft Excel spreadsheet that would be compatible with Alteryx. Alteryx Designer offersmany applications that could be explored by students, allowing them more freedom in the designof their final reports. The case could also allow students to export into data visualization productsother than Tableau, for example Power BI and SAP Cloud Analytics.This case provides a worthwhile student experience on the use of business analytics in anadvanced accounting course. Student responses to a survey indicated that the exercise engagedstudents and provided a great deal of satisfaction and competence in their attempt to understanddata analytics.STARFusion, Page 5
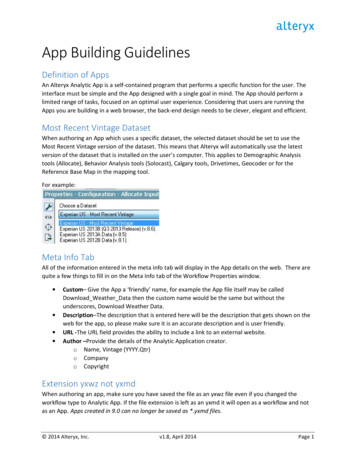
Journal of Business Cases and ApplicationsVolume 29APPENDIXAppendix AGeneral Notes and InformationIt is strongly recommended that you read through the entire exercise prior to starting. Notall instructions can be provided in a linear manner.Process OverviewAlteryx Designer is an ETL (Extract, Transform, Load) and Data Analyticssoftware that allows users to perform several types of analytics, including predictive andspatial, as well as to develop business applications with a single workflow.Tableau is a visualization software that combines business intelligence platformswith interactive dashboards and analytic applications – all in one display - that can beused for interpretation of a business’ key performance indicators. Tableau can visualizedata originating from several file types, such as CSV files, SAP databases, and MicrosoftExcel spreadsheets.This case study describes how to use Alteryx Designer, and then visualize thetransformed data using Tableau. The questions are based on sales data of ZeusCorporation, who operates globally.The key learning goal is not only to understand the use of Alteryx Designer andTableau, but how to accurately and efficiently synthesize the financial data of a simulatedcompany and recommend some action to be taken. This would also require the studentsto develop a written report analyzing the information provided using the analytic reports.STARFusion, Page 6
Journal of Business Cases and ApplicationsVolume 29Case Overview: Zeus CorporationObjective: Possible Acquisition of Zeus Corp.Company comparison:Growth and Profit IncreaseGlobal Bike Incorporated (GBI)Zeus CorporationProducts Sold: Bicycles and AccessoriesProducts Sold: Outdoor ApparelProduct Lines: 2Product Lines: 12Market Presence: Operating in 2 countriesMarket Presence: Operating in 15 countriesGoal: Use the historical and future data of Zeus to determine whether GBI should acquire thecompany to take advantage of their product lines, locations, and supply chain.STARFusion, Page 7
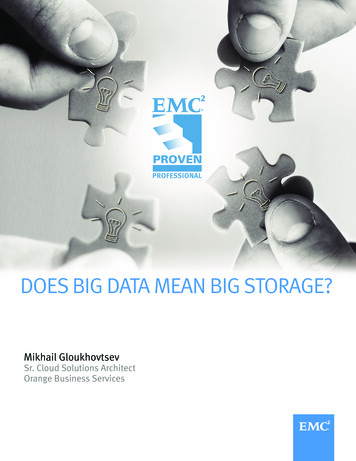
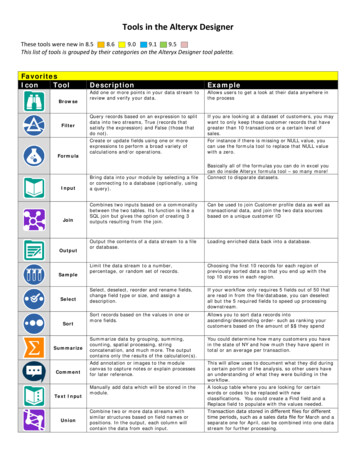
Journal of Business Cases and ApplicationsVolume 29Analytics & Reporting in Action – Alteryx Designer and TableauZeus Corp. OperationsReports: ExcelDownloadOpening AlteryxDesignerDownload Zeus Corp.’s Operations Reports from Canvas. In your Canvas Site, download the three Zeus Corp. Operations Reports Excel files found underSTARFusion: Alteryx in Action. Each file represents one fiscal years’ worth of data for ZeusCorporation. Save/move each of the files to your desktop. Additionally, download the Excel file titled Zeus Corp. C.O.R. from the Canvas site. This file is alsolocated under STARFusion: Alteryx in Action. Save/move the file to your desktop.Launch Alteryx Designer & Upload Zeus’s Operations Reports1. On your desktop, locate the Alteryx Designer Application and double click on it2. Once opened, you may be prompted to activate Alteryx. If so, enter your email address and the keycodeincluded in your Alteryx download email and click Activate. If not prompted, skip this step.3. If the Start Here.yxmd tab is selected by default, click the New Workflow1 tab to create a newworkflow. The blank screen created in the New Workflow1 tab is referred to as a Workflow CanvasUse the Input Data Tool to import Zeus’s Operations Reports into AlteryxUsing the Input DataTool1. From the In/Out tab, click and drag the Input Data Tool onto theWorkflow Canvas towards the middle-left portion.2. Click the drop-down next to the Connect a File or Database field. From the popup window, select Microsoft Excel .xlsx3. Select the Zeus 2017 Operations Report file from your desktop and click Open4. Repeat Steps 1-3 for the Zeus 2018 Operations Report and Zeus 2019 OperationsReport Excel filesUse the Union tool to join 3 years’ worth of Operations Reports into 1consolidated datasetUsing the Union Tool1. From the Jointab, click and drag the Union Tool onto the WorkflowCanvas.2. Click the Link Start Tab located to the right of the Zeus 2017 OperationsReport file and drag it to the Link End Tablocated on the left side of theUnion tool.3. Repeat Steps 1 & 2 for the Zeus 2018 Operations Report and Zeus 2019Operations Report files.Use the Select Tool to choose the data you want to analyzeUsing the Select Tool1. From the Preparation taband click and drag theSelect Tool onto the workflow canvas.2. Click the Link Start Tab located on the right of the Union tooland drag it to the Link End Tablocated to the left of the Select tool.3. Click on the Select tool once and in the Workflow Configurationwindow on the left side of the Canvas, ensure that only the boxes nextto the following fields are checked:- Category- Product Lines- City- Country- Date- Quantity Sold- Sales Revenue- Gross Margin- Number of Issues Reported- GMR- Fiscal Quarter- Fiscal Year-*UnknownSTARFusion, Page 8
Journal of Business Cases and ApplicationsVolume 29Use the Summarize Tool to configure an Alteryx-embedded reportUsing the SummarizeTool1. From the Transform tabclick and drag theSummarize Tool onto the top portion of the Workflow Canvas2. Click the Link Start Tablocated on the right of the Uniontool and drag it to the Link End Tablocated to the left of theSummarize tool.3. In the pop-up window under Fields, click the white box next tothe Product Lines field, select the drop-down in the Add box andselect Group By4. Click the white box next to the Number of Issues field, selectthe drop-down in the Add box and select CountUse the Sort Tool to organize the report in descending orderUsing the Sort Tool1. From the Preparation tabclick the SortTool. Drag it to the right of the Summarize Tool2. Click the Link Start Tablocated on the right of theSummarize tool and drag it to the Link End Tablocatedto the left of the Sort tool.3. Under the Name field, select the Count option4. Under the Order field, select the Descending option5. Click the Run button at the top of the screen.6. Click the Link End Tab to the right of the Sort tool.The completed summary will appear at the bottom of thescreen.Use the Formula Tool to create a Cost of Goods SoldcalculationUsing the FormulaTool1. From the Preparation tabclick and dragthe Formula Tool onto the Workflow Canvas to theright of the Select Tool2. Click the Link Start Tab located on the right ofthe Select tool and drag it to the Link End Tablocated to the left of the Formula tool3. In the Formula Configuration Window on the leftside of the screen, click the drop-down arrow locatednext to Select Column and select Add Column. Namethis new column Cost of Goods Sold4. Click the Columns and Constants buttonandselect Sales Revenue. Once entered into the Formulabox, type a minus sign (-) next to [Sales Revenue]5. Click the Columns and Constants buttonon theleft sidebar and select Gross Margin6. Next to the Data Type box, click the drop-down andselect DoubleSTARFusion, Page 9
Journal of Business Cases and ApplicationsVolume 29Use the Output Data Tool to create a consolidated
Journal of Business Cases and Applications Volume 29 STARFusion, Page 1 STARFusion: Integrating Alteryx and Big Data Tools within the Accounting Curriculum Joseph M. Ragan Saint Joseph's University Adam F. Dobroskey Saint Joseph's University William E. Legg Saint Joseph's Universi