Transcription
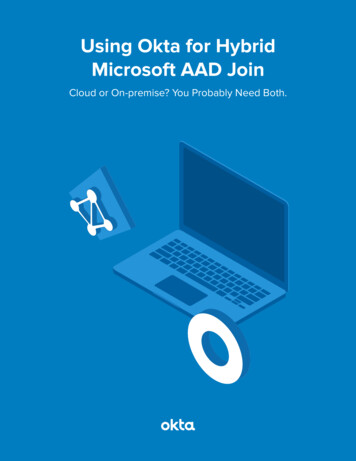
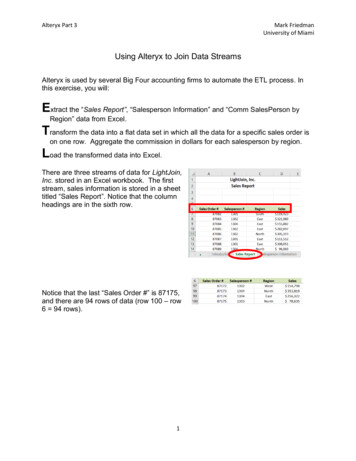
Alteryx Part 3Mark FriedmanUniversity of MiamiUsing Alteryx to Join Data StreamsAlteryx is used by several Big Four accounting firms to automate the ETL process. Inthis exercise, you will:Extract the “Sales Report”, “Salesperson Information” and “Comm SalesPerson byRegion” data from Excel.Transform the data into a flat data set in which all the data for a specific sales order ison one row. Aggregate the commission in dollars for each salesperson by region.Load the transformed data into Excel.There are three streams of data for LightJoin,Inc. stored in an Excel workbook. The firststream, sales information is stored in a sheettitled “Sales Report”. Notice that the columnheadings are in the sixth row.Notice that the last “Sales Order #” is 87175,and there are 94 rows of data (row 100 – row6 94 rows).1
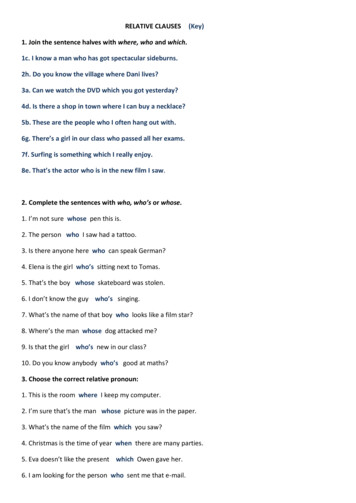
Alteryx Part 3Mark FriedmanUniversity of MiamiThe second stream contains dataregarding the Salesperson’s name andtitle are stored in a sheet titled“Salesperson Information”. Notice thatthe column headings are in the fourthrow.The third stream contains thecommission percentage earned by thesalesperson by region in which thesales were made. Data regarding theSalesperson’s commission rate isstored in a sheet titled “CommSalesPerson by Region”. Notice thatthe column headings are in theseventh row.The deliverable is a commission in dollars report bysalesperson, loaded back into Excel.2
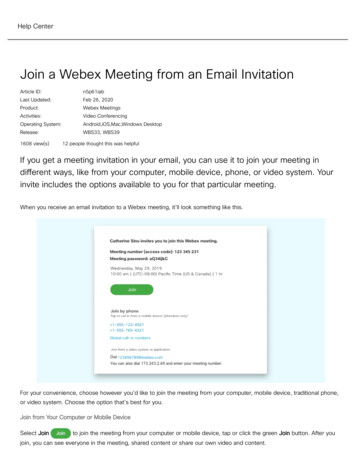
Alteryx Part 3Mark FriedmanUniversity of MiamiStart AlteryxNote: You cannot extract data from an open Excel file, so make sure that the Excel fileis closed before starting to input the data.There are four major parts of the Alteryx window. The first is the Canvas, and that’swhere the workflow will be created. Second, the Tools Palette is where all the tools arestored. Third, the Configuration area is where the tool settings are modified. Lastly, theResults window shows the outcome after “Run” is selected to apply the changes.Tool 1: Input Data Tool – Input Excel fileDrag the “Input Data Tool”from the Tools Palette to the Canvas.RunTools PaletteConfigurationCANVASResults Window3
Alteryx Part 3Mark FriedmanUniversity of MiamiIn the Configuration area, select the “Connect a File or Database” drop-down arrow.Select “File”.Browse for the desired file and selectthe version with the .xlsx file extension.Select “Open”.4
Alteryx Part 3Mark FriedmanUniversity of MiamiSelect the drop-down arrow to the right of “Comm SalesPerson by Region”.Select “Sales Report”.Select “OK”.5
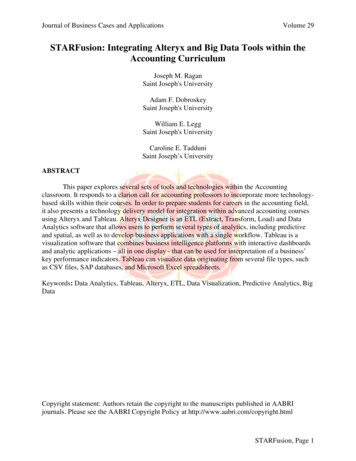
Alteryx Part 3Mark FriedmanUniversity of MiamiRemember that the field names are in the sixth row.In the Configuration area, change thenumber in “Start Data Import on Line”to “6”.Select “Run”.The Results window will display thefield headings and the data.Notice that five fields were extractedwhile we need only four fields and thatthere are 100 records. The extra rowsthat contain “Null” and the extra fieldsmust be removed. There are 94 rows ofdata and the last one is “Sales Order #”87175.6
Alteryx Part 3Mark FriedmanUniversity of MiamiThe workflow must be saved.Select “File”.Select “Save”.Browse to the required directory.Type in the name of the file that will be uploaded.Select “Save”.7
Alteryx Part 3Mark FriedmanUniversity of MiamiExport the workflow and the related input files so that the project can becompleted on another computer or uploaded to the web.Select “Options”.Select “Export Workflow”.Verify the “Workflow”.Verify the “Package Location”.Select “Save”.8
Alteryx Part 3Mark FriedmanUniversity of MiamiSelect “OK”9
Alteryx Part 3Mark FriedmanUniversity of MiamiTool 2: Filter Tool – Exclude all rows that do not contain dataThere are several rows that do not contain a sales order number. We can modify theworking dataset so that it includes only those rows that contain sales order numbersgreater than one. Note that nothing is being deleted from the source data file. Theworking dataset will be split into two subsets. The first subset, “True”, will include allrows with “Sales Order #” greater than one. The second subset, “False”, will contain allrows with “Sales Order #” less than one.Drag the “Filter Tool”from the Tools Palette to the right of the “Input DataTool” on the Canvas. The two will be connected automatically. The outflow from the toolon the left is the inflow to the one on the right.With the “Filter Tool” selected, the “Basic” filter in the Configuration area can bemodified to filter the field “Salesperson #” for those accounts greater than “1’.To apply the latest change, select “Run”.10
Alteryx Part 3Mark FriedmanUniversity of MiamiThe records that meet the filtered conditions, “Salesperson #” 1”, are displayed as T(True). There are 94 records displayed and the last one is “Sales Order #” 87175.11
Alteryx Part 3Mark FriedmanUniversity of MiamiTool 3: Select Tool – Remove fields that contain no data, F5 and UnknownDrag the “Select Tool” from the Tools Palette to the True output ofthe “Filter Tool” on the Canvas. The two will be connectedautomatically.Remove the extra fields by unchecking them.Select “Run”.12
Alteryx Part 3Mark FriedmanUniversity of MiamiRepeat Tools 1- 3 and extract the data from the “Salesperson Information” sheet.Data regarding the Salesperson’sname and title are stored in an Excelsheet titled “Salesperson Information”.Notice that the column headings are inthe fourth row.Tool 4: Input Data Tool – Input Excel fileDrag the “Input Data Tool” from the Tools Palette to the Canvas.13
Alteryx Part 3Mark FriedmanUniversity of MiamiIn the Configuration area, select the “Connect a File or Database” drop-down arrow.Select “File”.Browse for the desired file and selectthe version with the .xlsx file extension.Select “Open”.14
Alteryx Part 3Mark FriedmanUniversity of MiamiSelect the drop-down arrow to the right of “Comm SalesPerson by Region”.Select “Salesperson Information”.Select “OK”.15
Alteryx Part 3Mark FriedmanUniversity of MiamiRemember that the field names are inthe fourth row.In the Configuration area, change thenumber in “Start Data Import on Line” to“4”.Select “Run”.The Results window will display the field headings and the data. Notice that nine fieldswere extracted while only three fields are needed and that there are 105 records. Theextra rows that contain [Null] and the extra fields must be removed. There are four rowsof data and the last Salesperson ID, “SPID” is 1304.16
Alteryx Part 3Mark FriedmanUniversity of MiamiTool 5: Filter Tool – Exclude all rows that do not contain dataDrag the “Filter Tool”from the Tools Palette to the right of the “Input DataTool” on the Canvas.The two will be connected automatically. The outflowfrom the tool on the left is the inflow to the one on the right.With the “Filter Tool” selected, the “Basic” filter in the Configuration area can bemodified to filter the field “SPID” for those accounts greater than “1’.To apply the latest change, select “Run”.The records that meet the filtered conditions, “SPID 1”, are displayed as T (True).There are four records displayed and the last one is “SPID” 1304.17
Alteryx Part 3Mark FriedmanUniversity of MiamiTool 6: Select Tool – Remove Fields That Contain No DataDrag the “Select Tool” from the Tools Palette to the True output of the “Filter Tool” onthe Canvas. The two will be connected automatically.Remove the extra fields by unchecking them.Select “Run”.Review the data.18
Alteryx Part 3Mark FriedmanUniversity of MiamiThe commission percentage earned by the salesperson is a function of the region inwhich the sales was made. Dataregarding the Salesperson’scommission rate are stored in an Excelsheet titled “Comm SalesPerson byRegion”. Notice that the columnheadings are in the seventh row.Tool 7: Input Data Tool – Input Excel FileDrag the “Input Data Tool” from the Tools Palette to the Canvas.19
Alteryx Part 3Mark FriedmanUniversity of MiamiIn the Configuration area, select the “Connect a File or Database” drop-down arrow.Select “File”.Browse for the desired file and selectthe version with the .xlsx file extension.Select “Open”.20
Alteryx Part 3Mark FriedmanUniversity of MiamiThe “Comm SalesPerson by Region” sheet is the default sheet.Select “OK”.21
Alteryx Part 3Mark FriedmanUniversity of MiamiRemember that the field names are in the seventh row.In the Configuration area, changethe number in “Start Data Import onLine” to “7”.Select “Run”.The Results window will display the field headings and the data. Notice that five fieldswere extracted and that there are 5041 records. The extra rows that contain [Null] andmust be removed. There are four rows of data and the last “Salesperson” is 1304.22
Alteryx Part 3Mark FriedmanUniversity of MiamiTool 8: Filter Tool – Exclude All Rows That Do Not Contain DataDrag the “Filter Tool”from the Tools Palette to the right of the “Input DataTool” on the Canvas.The two will be connected automatically. The outflowfrom the tool on the left is the inflow to the one on the right.With the “Filter Tool” selected, the “Basic” filter in the Configuration area can bemodified to filter the field “SPID” for those accounts greater than “1’.To apply the latest change, select “Run”.The records that meet the filtered conditions, “SalesPerson 1”, are displayed as T(True). There are fourrecords displayed and the lastone is “SPID” 1304.23
Alteryx Part 3Mark FriedmanUniversity of MiamiReview the streams of data:Stream 1, Sales Report” fileStream 2, Salesperson Information” fileThe “Salesperson #” field in the “Sales Report” file appears many times while the “SPID”field is the primary key of the “Salesperson Information” file. Join the two streams.Tool 9: Join Tool – Combine Data From Two Streams On A Common FieldDrag the “Join Tool”from the Tools Palette to the right of the “Select Tool”from the first data streams, on the Canvas. The two will be connected automatically.The outflow from the tool on the left is the inflow to the one on the right.Connect the output of the “Select Tool” from the second data stream to the R,(Right)inflow of the “Join Tool”.24
Alteryx Part 3Mark FriedmanUniversity of MiamiWith the “Join Tool” selected, in theConfiguration area select “Salesperson #” onthe left and ”SPID” on the right. The two fieldsmust be the same type; in this case “Double”,and the same size, in this case 8.To apply the latest change, select “Run”.There is a possible error because the Join used “Double” fields.25
Alteryx Part 3Mark FriedmanUniversity of MiamiHighlight the Select Tool in the first stream and change the field type of the“Salesperson #” from Double to Integer, Int 16.Highlight the Select Tool in the second stream and change the field type of the “SPID”from Double to Fixed Decimal.Select Run to apply.26
Alteryx Part 3Mark FriedmanUniversity of MiamiIn the result area, select J, Join, and review the output.Verify that nothing was unmatched from L, Left data set. Sales orders with an invalidsalesperson’s number would be unmatched.Look at R, Right data set. If anything is not matched, there would be salespeople thatwere not involved in any of the recorded sales.27
Alteryx Part 3Mark FriedmanUniversity of MiamiThe third stream must be transformed before combining it with the already combinedfirst and second stream of data. The third stream of data must be arranged into a dataset with each commission rate on a separate row.Third stream as extracted and transformed:Third stream arranged into a data set with each commission rate on a separate row:28
Alteryx Part 3Mark FriedmanUniversity of MiamiTool 10: Arrange Tool – Each Record Is Turned Into Multiple RecordsIn the “Search for Tools Box” type “Arrange”.Drag the “Arrange Tool” fromthe Tools Palette to the right ofthe “Filter Tool” from the thirddata streams, on the Canvas.The two will be connectedautomatically. The outflow fromthe tool on the left is the inflow tothe one on the right.With the “Arrange Tool” selected, in the Configuration Area, under “Key Fields”, checkSalesPerson.29
Alteryx Part 3Mark FriedmanUniversity of MiamiSelect column.Select Add.In the “Column Header”type: Commission %.In the “DescriptionHeader” type: Region.In the “Fields” check:East, West, North andSouth.Select “OK”.Select Run to apply.30
Alteryx Part 3Mark FriedmanUniversity of MiamiIn the “Output Fields Description” type, East, West, North SouthSelect Run to apply.Compare to original data.To combine two streams in a one to many relationship there must be one field that isunique for each row of the data. That unique field is referred to as the primary key. Theprimary field will be created by combining the “Salesperson” field with a “.” and the“Region” field. The primary key for the first record will be “1301.East”.31
Alteryx Part 3Mark FriedmanUniversity of MiamiTool 11 Select Tool: Change The Field TypeThe fields “SalesPerson” and “Region” must be combined. “Region” is a string, but“SalesPerson” could be a string or a numeric.Drag the “Select Tool” from the Tools Palette to the output of the “Arrange Tool” onthe third stream. The two will be connected automatically.With the “Select Tool” selected, in the Configuration area note that “Salesperson #” isa numeric field with the type “Double”.“Change the type to Integer, “Int 16” to match the field definition that was used in stream1 and stream 2.32
Alteryx Part 3Mark FriedmanUniversity of MiamiTool 12: Formula Tool - Create A Primary Key FieldDrag a “Formula Tool”from the Tools Palette to the output of the “Select Tool”on the third stream. The two will be connected automatically. The outflow from the toolon the left is the inflow to the one on the right.In the output Configuration area,click on the drop-down arrow of “SelectColumn”.Select “Add Column”.33
Alteryx Part 3Mark FriedmanUniversity of MiamiType “SPID and Region”.Type the following formulatostring([Salesperson]) "." [Region]Select “Run”.34
Alteryx Part 3Mark FriedmanUniversity of Miami
There are four major parts of the Alteryx window. The first is the Canvas, and that’s where the workflow will be created. Second, the Tools Palette is where all the tools are stored. Third, the Configuration area is where the tool settings are modified. Lastly, the Results window shows the outcome after “Run” is selected to apply the changes.