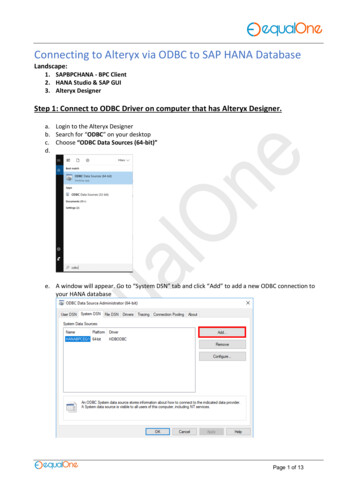
Transcription
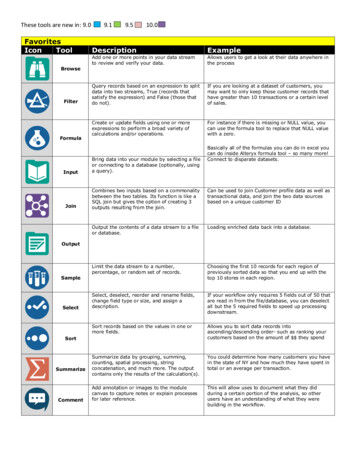
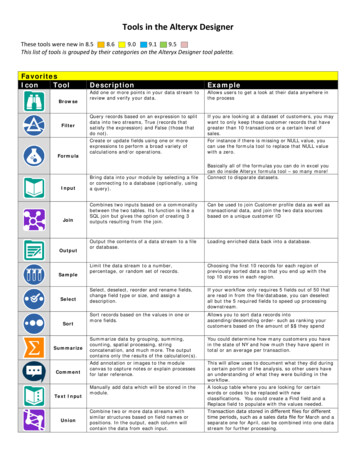
Tools in the Alteryx DesignerThese tools were new in 8.58.69.09.19.5This list of tools is grouped by their categories on the Alteryx Designer tool ptionExampleQuery records based on an expression to splitdata into two streams, True (records thatsatisfy the expression) and False (those thatdo not).If you are looking at a dataset of customers, you maywant to only keep those customer records that havegreater than 10 transactions or a certain level ofsales.Create or update fields using one or moreexpressions to perform a broad variety ofcalculations and/or operations.For instance if there is missing or NULL value, youcan use the formula tool to replace that NULL valuewith a zero.Add one or more points in your data stream toreview and verify your data.Allows users to get a look at their data anywhere inthe processBasically all of the formulas you can do in excel youcan do inside Alteryx formula tool – so many more!Connect to disparate datasets.InputBring data into your module by selecting a fileor connecting to a database (optionally, usinga query).JoinCombines two inputs based on a commonalitybetween the two tables. Its function is like aSQL join but gives the option of creating 3outputs resulting from the join.Can be used to join Customer profile data as well astransactional data, and join the two data sourcesbased on a unique customer IDOutput the contents of a data stream to a fileor database.Loading enriched data back into a database.Limit the data stream to a number,percentage, or random set of records.Choosing the first 10 records for each region ofpreviously sorted data so that you end up with thetop 10 stores in each region.Select, deselect, reorder and rename fields,change field type or size, and assign adescription.If your workflow only requires 5 fields out of 50 thatare read in from the file/database, you can deselectall but the 5 required fields to speed up processingdownstream.Sort records based on the values in one ormore fields.Allows you to sort data records intoascending/descending order- such as ranking yourcustomers based on the amount of they spendSummarize data by grouping, summing,counting, spatial processing, stringconcatenation, and much more. The outputcontains only the results of the calculation(s).You could determine how many customers you havein the state of NY and how much they have spent intotal or an average per transaction.Add annotation or images to the modulecanvas to capture notes or explain processesfor later reference.This will allow uses to document what they did duringa certain portion of the analysis, so other users havean understanding of what they were building in theworkflow.Manually add data which will be stored in themodule.A lookup table where you are looking for certainwords or codes to be replaced with newclassifications. You could create a Find field and aReplace field to populate with the values needed.Combine two or more data streams withsimilar structures based on field names orpositions. In the output, each column willcontain the data from each input.Transaction data stored in different files for differenttime periods, such as a sales data file for March and aseparate one for April, can be combined into one datastream for further ext InputUnion
Tools in the Alteryx DesignerThese tools were new in 8.58.69.09.19.5This list of tools is grouped by their categories on the Alteryx Designer tool palette.Input/OutputIconToolBrowseDate TimeNowDirectoryInputMap InputOutputDescriptionExampleInput the current date and time at moduleruntime, in a format of the user's choosing.(Useful for adding a date-time header to areport.)This is a useful tool to easily add a date time headerfor a reportInput a list of file names and attributes from aspecified directory.Lists all files in a directory- can be used inconjunction with the Dynamic Input tool to bring inthe most recent data file that is availableBring data into your module by selecting a fileor connecting to a database (optionally, usinga query).Connect to disparate datasets.Manually draw or select map objects (points,lines, and polygons) to be stored in themodule.Output results to google maps, and allow interactionwith the results for example. Not really! This tool isonly so you can pick a spatial object, either bydrawing or selecting one, to use in your module(app).Output to data- anywhere we can read from, we canoutput to – no – we have some formats we can readonly. Example- loading enriched data back into adatabaseAdd one or more points in your data stream toreview and verify your data.Output the contents of a data stream to a fileor database.Manually add data which will be stored in themodule.Manually store data or values inside the Alteryxmodule- example- a lookup table where you arevalues of segmentation groups and you want thedescription nameThis tool enables access to an XDF format file(the format used by Revolution R Enterprise'sRevoScaleR system to scale predictiveanalytics to millions of records) for either: (1)using the XDF file as input to a predictiveanalytics tool or (2) reading the file into anAlteryx data stream for further data hygiene orblending activitiesThis tool reads an Alteryx data stream into anXDF format file, the file format used byRevolution R Enterprise's RevoScaleR systemto scale predictive analytics to millions ofrecords. By default, the new XDF files is storedas a temporary file, with the option of writing itto disk as a permanent file, which can beaccessed in Alteryx using the XDF Input toolThis can be used when building and runningpredictive analytics procedures on large amounts ofdata that open source R has difficulty computing (specifically Linear Regression, Logistic Regression,Decision Trees, Random Forests, Scoring, Lift Chart)DescriptionExampleText InputXDF InputXDFOutputPreparationIconToolAuto FieldAllows users to get a look at their data anywhere inthe processAutomatically set the field type for each stringfield to the smallest possible size and type thatwill accommodate the data in each column.This can be used when building and runningpredictive analytics procedures on large amounts ofdata that open source R has difficulty computing (specifically Linear Regression, Logistic Regression,Decision Trees, Random Forests, Scoring, Lift Chart)Trying to identify the best fit field for text basedinputs. Make the data streaming into Alteryx assmall as possible to limit processing time and ensureproper formats for downstream processes.
Tools in the Alteryx DesignerThese tools were new in 8.58.69.09.19.5This list of tools is grouped by their categories on the Alteryx Designer tool palette.FilterDate nningMulti-FieldFormulaMulti-RowFormulaRandom %SampleQuery records based on an expression to splitdata into two streams, True (records thatsatisfy the expression) and False (those thatdo not).The Date Filter macro is designed to allow auser to easily filter data based on a datecriteria using a calendar based interface.Create or update fields using one or moreexpressions to perform a broad variety ofcalculations and/or operations.For instance if there is missing or NULL value, youcan use the formula tool to replace that NULL valuewith a zeroCreate new rows of data. Useful for creating asequence of numbers, transactions, or dates.Creating data specifically time series data, Create365 unique records for each day of year.Update specific values in a numeric data fieldwith another selected value. Useful forreplacing NULL() values.For example, if you have a data set that is missinginformation, such as salary, and displays (NULL)rather than just making it zero, you can use themean or median to fill in the NULL, to improveaccuracy of the results.For instance if you have transactional data, you cangroup them into different buyer personas- ie. Malesbetween 30-35, that spend between 1k per month,etc Group multiple numeric fields into tiles or bins,especially for use in predictive analysis.Create or update multiple fields using a singleexpression to perform a broad variety ofcalculations and/or operations.For instance if there is missing or NULL value onmultiple fields, you can use the formula tool toreplace that NULL value with a zeroCreate or update a single field using anexpression that can reference fields insubsequent and/or prior rows to perform abroad variety of calculations and/or operations.Useful for parsing complex data and creatingrunning totals.Generate a random number or percentage ofrecords passing through the data stream.Creating unique identifiers at a group level- cross rowcomparisons- Sales volume for yr1, yr2, yr3 indifferent rows and want to notice the differencebetween the sales in each of these rowsAssign a unique identifier to each record.This can be used to assign a customer id to a legacytransaction, allowing for more accurate directmarketing/promotional offerings in the futureLimit the data stream to a number,percentage, or random set of records.Allows you to select a subset of data/records for youranalysis- Can be used to focus on a select group ofrelated records or transactions for analysis- such asselecting all items in an online shopping cartSelect, deselect, reorder and rename fields,change field type or size, and assign adescription.Allows you to determine a specific subset of recordsshould or should not be carried down throughout theanalysis- for instance if we are looking at customertransactional data and we want to eliminate alltransactions that are less than 5K)If a user wants to find records that are less than 100 or in a range of 100- 150 it will return recordsin this rangeRecord IDSampleSelectSelectRecordsSortAllows users to exclude values – all fields comethrough! in the stream- for instance if you are lookingat a dataset of customers, you may want to eliminatecertain characteristics of that customer such as raceor sexReturn transaction records by specifying a start andend date.Select specific records and/or ranges of recordsincluding discontinuous ranges. Useful fortroubleshooting and sampling.Sort records based on the values in one ormore fields.If you want to base your analysis based on 35% ofthe data for instance, it will randomly return recordsAllows you to sort data records intoascending/descending order- such as locating yourtop 1000 customers based on the amount of theyspend
Tools in the Alteryx DesignerThese tools were new in 8.58.69.09.19.5This list of tools is grouped by their categories on the Alteryx Designer tool palette.Group data into sets (tiles) based on valueranges in a field.Creating logical groups of your data. User definedbreaks or statistical breaks. Very good for bucketinghigh valued customers vs. low valued customersUniqueSeparate data into two streams, duplicate andunique records, based on the fields of theuser's choosing.Only want to mail to one individual, and based on aunique identifier(customer id)AppendFieldAppend the fields from a source input to everyrecord of a target input. Each record of thetarget input will be duplicated for every recordin the source input.TileJoinIconToolExampleAdding small value to a million records. A small tobig merge- Adding time stamps as well as the nameof the users who last accessed it onto your databaserecords.Search for data in one field from one datastream and replace it with a specified fieldfrom a different stream. Similar to an ExcelVLOOKUP.Think of this like Excel- find and replace. Looking forsomething and then replacing.JoinCombine two data streams based on commonfields (or record position). In the joined output,each row will contain the data from bothinputs.For instance this can be used to join Customer profiledata as well as transactional data, and join the twodata sources based on a unique customer IDJoinMultipleCombine two or more inputs based on commonfields (or record position). In the joined output,each row will contain the data from bothinputs.For instance this can be used to join Customer profiledata as well as transactional data, and join two ormore data sources based on a unique customer IDThe Make Group tool takes data relationshipsand assembles the data into groups based onthose relationships.Used primarily with Fuzzy Matching- ID 1 can match10 different values from source 2 and that becomes agroup.Identify non-identical duplicates in a datastream.Helps determine similarities in your data. Forinstance if you have 2 different data sets withdifferent ID, looking a names and address as a wayto standard and matching them up based on thesetypes of characteristics- and displays all of the id’sthat matchMatching a business listing file to Dun and Bradstreet.FindReplaceMakeGroupFuzzyMatchDun tchingUnionParseIconDescriptionToolMatch your customer or prospect file to theDun & Bradstreet business file. (requires,Alteryx with Data Package and installation ofthe Dun & Bradstreet business location file)Match your customer file to the ExperianConsumer View Household file. (requires,Alteryx with Data Package and installation ofthe Experian ConsumerView Household andindividual file)Combine two or more data streams with similarstructures based on field names or positions.In the output, each column will contain thedata from each input.Matching a customer file to Experian- example toappend segmentation values at a household levelDescriptionExampleCan be used to combine datasets with similarstructures, but with different data. You might havetransaction data stored in different files for differenttime periods, such as a sales data file for March and aseparate one for April. Assuming that they have thesame structure (the same fields), Union will join themtogether into one large file, which you can thenanalyze
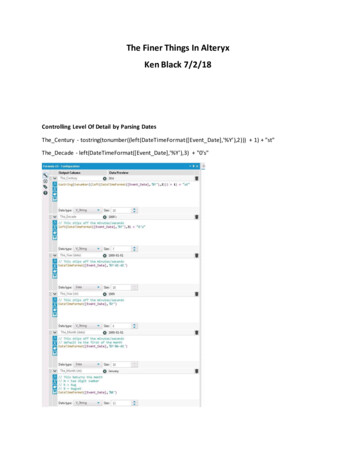
Tools in the Alteryx DesignerThese tools were new in 8.58.69.09.19.5This list of tools is grouped by th
This tool reads an Alteryx data stream into an XDF format file, the file format used by Revolution R Enterprise's RevoScaleR system to scale predictive analytics to millions of records. By default, the new XDF files is stored as a temporary file, with the option of writing it