Transcription
Introduction to OscilloscopesLab ExperimentA collection of lab exercises to introduce you to the basiccontrols of a digital oscilloscope in order to make commonelectronic measurements.Revision 1.0Page 1 of 18
Introduction to OscilloscopesLab ExperimentTable of ContentsLABORATORY EXPERIMENT INTRODUCTION. 3OBJECTIVES . 3EQUIPMENT LIST . 3OVERVIEW OF AN OSCILLOSCOPE. 4INTRODUCTION . 4PERFORMANCE TERMS AND CONSIDERATIONS . 5INITIAL SETUP AND SCREEN EXPLANATION. 6CREATING A STABLE DISPLAY . 6SCREEN EXPLANATION . 7INSTRUMENT CONTROLS . 8VERTICAL CONTROLS . 9INTRODUCTION . 9VERTICAL POSITION/SCALE CONTROLS . 9HORIZONTAL CONTROLS . 10INTRODUCTION . 10HORIZONTAL POSITION/SCALE CONTROLS. 10SETTING THE RECORD LENGTH . 10TRIGGER CONTROLS.11INTRODUCTION . 11TRIGGER LEVEL CONTROL . 11TRIGGER MENU . 12OSCILLOSCOPE MEASUREMENTS. 13INTRODUCTION . 13MANUAL MEASUREMENTS . 14CURSOR MEASUREMENTS . 14AUTOMATED MEASUREMENTS . 15FINAL EXERCISE . 16Revision 1.0Page 2 of 18
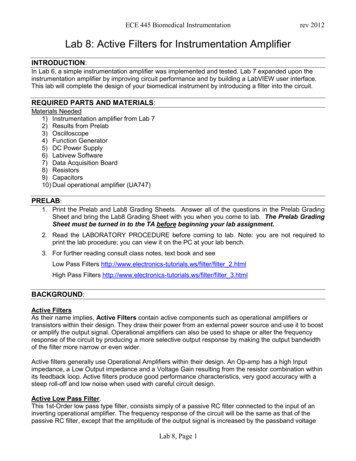
Introduction to OscilloscopesLab ExperimentLaboratory Experiment IntroductionObjectives1. Understand the block diagram and basic controls of a digital oscilloscope.2. Setup an oscilloscope for a stable display of the applied signal.3. Make common electronic measurements with a digital oscilloscope.Equipment List1.2.3.4.One Tektronix MSO2000 or DPO2000 Series digital oscilloscope.One Tektronix P2221 1X/10X passive probe.One Host/Device USB cable.One Tektronix 878-0456-xx demonstration board.Revision 1.0Page 3 of 18
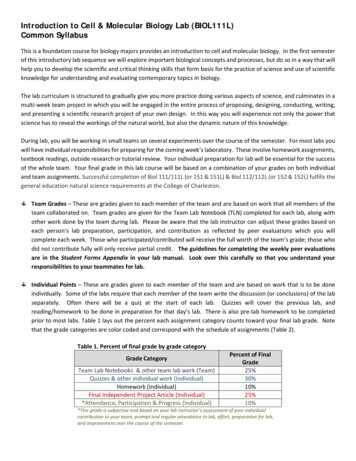
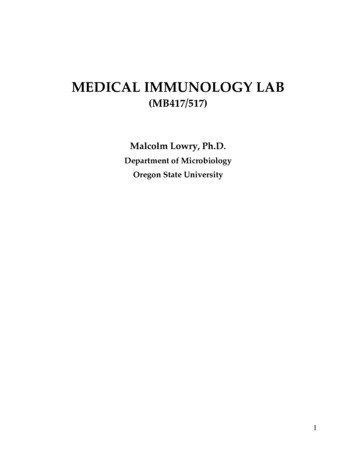
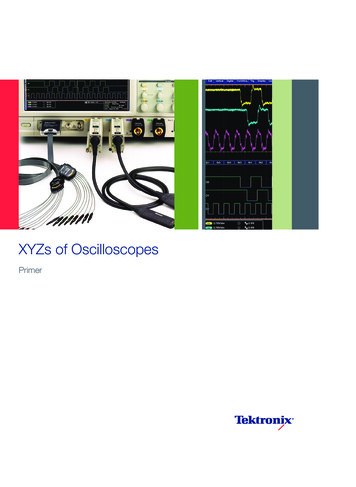
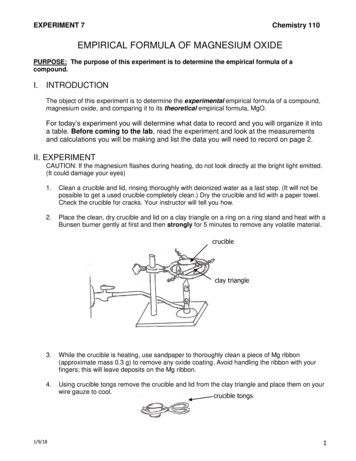
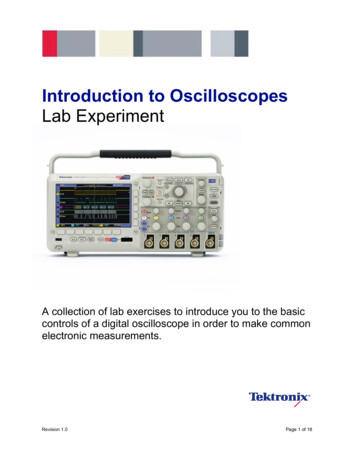
Introduction to OscilloscopesLab ExperimentOverview of an OscilloscopeIntroductionAn oscilloscope is an electronic test instrument that displays electrical signals graphically, usually as avoltage (vertical or Y axis) versus time (horizontal or X axis) as shown in figure 1. The intensity orbrightness of a waveform is sometimes considered the Z axis. There are some applications where othervertical axes such as current may be used, and other horizontal axes such as frequency or anothervoltage may be used.Oscilloscopes are also used to measure electrical signals in response to physical stimuli, such assound, mechanical stress, pressure, light, or heat. For example, a television technician can use anoscilloscope to measure signals from a television circuit board while a medical researcher can use anoscilloscope to measure brain waves.Oscilloscopes are commonly used formeasurement applications such as: observing the wave shape of a signal measuring the amplitude of a signal measuring the frequency of a signal measuring the time between two events observing whether the signal is directcurrent (DC) or alternating current (AC) observing noise on a signalFigure 1: Typical Oscilloscope DisplayAn oscilloscope contains various controls that assist in the analysis of waveforms displayed on agraphical grid called a graticule. The graticule, as shown in figure 1, is divided into divisions along boththe horizontal and vertical axes. These divisions make it easier to determine key parameters about thewaveform. In the case of the MSO/DPO2000 Series oscilloscope, there are 10 divisions horizontallyand 8 divisions vertically.A digital oscilloscope acquires a waveform by conditioning the input signal in the analog verticalamplifier, sampling the analog input signal, converting the samples to a digital representation with ananalog-to-digital converter (ADC or A/D), storing the sampled digital data in its memory, and thenreconstructing the waveform for viewing on the display.Figure 2: Typical Digital Oscilloscope Block DiagramRevision 1.0Page 4 of 18
Introduction to OscilloscopesLab ExperimentPerformance Terms and ConsiderationsThere are many ways to specify digital oscilloscope performance, but the most important are bandwidth,rise time, sample rate, and record length.BandwidthBandwidth is the first specification to consider. Bandwidth is the frequency range of the oscilloscope,usually measured in Megahertz (MHz). It is the frequency at which the amplitude of the displayed sinewave is attenuated to 70.7% of the original signal amplitude.When measuring high-frequency or fast rise-time signals, oscilloscope bandwidth is especially critical.Without adequate bandwidth, an oscilloscope will not be able to display and measure high-frequencychanges. It is generally recommended that the oscilloscope’s bandwidth be at least 5 times the highestfrequency that needs to be measured. This “5-times rule” allows for the display of the 5th harmonic of thesignal and assures that measurement errors due to bandwidth are minimized.oscillosco pe bandwidth 5 th harmonic of signalExample: If the signal of interest is 100 MHz, the oscilloscope would need a bandwidth of 500 MHz.Rise TimeThe edge speed (rise time) of a digital signal can carry more high-frequency content than its repetitionrate might imply. An oscilloscope and probe must have a sufficiently fast rise time to capture the higherfrequency components, and therefore show signal transitions accurately. Rise time is the time taken bya step or a pulse to rise from 10% to 90% of its amplitude level. There is another “5-times rule” thatrecommends that the oscilloscope’s rise time be at least 5 times faster than the rise time of the signalthat needs to be measured.oscillosco pe rise time signal rise time5Example: If the signal of interest has a rise time of 5 μsec, then the oscilloscope rise time should befaster than 1 μsec.Sample RateDigital oscilloscopes sample the input signals at a frequency called the sample rate, measured insamples / second (S/sec). To properly reconstruct the signals, Nyquist sampling requires that thesample rate be at least twice the highest frequency being measured. That’s the theoretical minimum. Inpractice, sampling at least 5 times as fast is generally desirable.sample rate 5 f HighestExample: The correct sample rate for a 450 MHz signal would be 2.25 GS/sec.Record LengthDigital oscilloscopes capture a specific number of samples or data points, known as the record length,for each acquired waveform. The record length, measured in points or samples, divided by the samplerate (in Samples/second) specifies the total time (in seconds) that is acquired.acquired time record lengthsample rateExample: With a record length of 1 Mpoints and a sample rate of 250 MS/sec, the oscilloscope willcapture a signal 4 msec in length.Revision 1.0Page 5 of 18
Introduction to OscilloscopesLab ExperimentExerciseWhat minimum oscilloscope performance is required to properly capture 2 msec of a 1 Vpk-pk , 250 MHzsine wave? Bandwidth: Sample Rate: Record Length:Initial Setup and Screen ExplanationCreating a Stable Display1. The following steps will describe how to automatically create a stable oscilloscope display using a1 kHz, 5 Vpk-pk square wave.a. Power up the MSO/DPO2000 Series oscilloscope by pressing the power button on the lowerleft corner of the instrument.b. Press the front panel Default Setup button to set the oscilloscope to a known starting point.c.Connect a P2221 1X/10X passive probe to the channel 1 input. To connect a BNC connector,push and turn the probe connector until it slides on the connector. Then, turn the locking ringclockwise to lock the connector in place.d. Use the probe slide switch to set the probe attenuation to 10X.e. Attach the probe’s alligator style ground lead to the ground connector on the lower rightcorner of the oscilloscope.f.Attach the probe tip to the PROBE COMP connector just below the ground lead connector. ThePROBE COMP connector provides a 1 kHz square wave that this lab will use to demonstratethe operation of an oscilloscope.g. Press the front panel Autoset button tocause the oscilloscope to automaticallyset the vertical, horizontal and triggersettings for a stable display of thePROBE COMP 1 kHz square wave.Key Points to Remember1. To return the oscilloscope to a known state, press the Default Setup button.2. The Autoset button adjusts the vertical, horizontal and trigger settings such that four or five cyclesof the waveform are displayed with the trigger near the middle of the screen.Revision 1.0Page 6 of 18
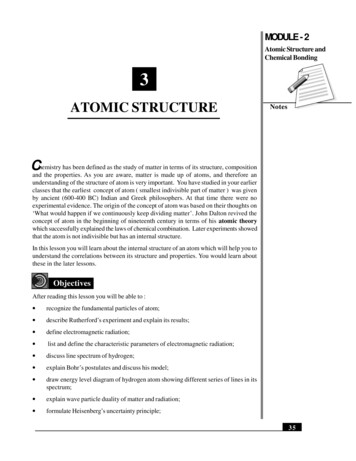
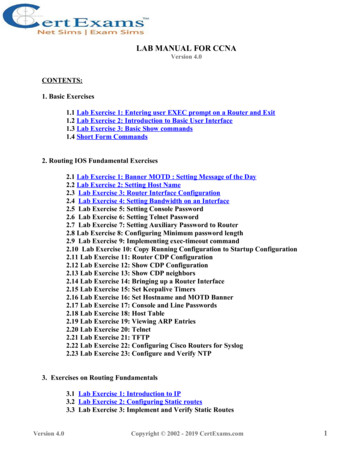
Introduction to OscilloscopesLab ExperimentScreen Explanation1. Following is a review of the oscilloscope’s display.a. The channel 1 vertical axis button is yellow and most of the elements on the screen that relateto the channel 1 signal are yellow in color.b. On the display, the following items are yellow to indicate they are associated with channel 1: waveform waveform ground level indicator (center left of screen) vertical scale readout (bottom left of screen 2.00 V)c. The channel 2, 3, and 4 vertical axis buttons are blue, magenta and green respectively. Thedisplay uses the color coding of these channels just as it does for the yellow of channel 1.d. As can be seen on the oscilloscope screen, the square wave extends up about 2 ½ divisions onthe display graticule from the ground level indicator. Since the vertical scale factor is 2Volts/div, this indicates the signal’s positive peak is at about 5 V.e. One cycle of the waveform is about 2 ½ divisions wide. The time per horizontal division isindicated by the horizontal scale readout which in this case is 400 µsec/div (bottom center ofthe display). At 400 µsec/div, the period of the signal is about 1 msec and the frequency isabout 1 kHz.f.Finally, the trigger frequency readout indicates the channel 1 signal has a frequency of about1 kHz as shown in the bottom right corner of the display.Key Points to Remember1. The input channels are color coded. Onscreen channel information is in that channel’s color,including the waveform, ground indicator, and vertical scale factor (Volts/div).2. The amplitude of the signal can be determined by multiplying the number of vertical divisions thewaveform spans times the vertical scale factor.3. The signal period can be determined by multiplying the number of horizontal divisions times thehorizontal scale factor.4. Signal frequency is calculated by dividing 1 by the signal period.ExerciseBased on the display shown here, answer thefollowing questions:What is the peak-to-peak voltage of the signal?What is the voltage of the signal’s positivepeak? Negative peak?What is the period and frequency of the signal?Revision 1.0Page 7 of 18
Introduction to OscilloscopesLab ExperimentInstrument ControlsThe controls of a typical oscilloscope can be grouped into three major categories: vertical, horizontal,and trigger. These are the three main functions that are used to set up an oscilloscope. The use ofthese controls is described in the following sections of this lab.Horizontal ControlsTriggerControlsVertical ControlsHere are a few hints that will make using the oscilloscope controls easier: Decide if the task is related to oscilloscope’s vertical axis (typically voltage), horizontal axis(typically time), trigger, or some other function. This will make it easier find the correct control ormenu. Pressing a front panel button will usually display a first-level menu at the bottom of the display.The menu items are logically prioritized from left-to-right. If they are selected in that order, thesetup should be straightforward. In most cases, pressing the button underneath a menu item at the bottom of the display resultsin a second-level menu at the side of the display. These menu items are logically prioritized topto-bottom. If a small orange a or b is displayed on the screen, it indicates the front panel Multipurpose aor b controls may be used to change that menu selection. Pressing the Menu Off button turns off one menu level at a time until all menus and readoutsare removed.ExerciseThe oscilloscope’s vertical axis controls are typically used to control which parameter?Revision 1.0Page 8 of 18
Introduction to OscilloscopesLab ExperimentVertical ControlsIntroductionThe vertical controls set or modify the vertical scale, position, and other signal conditioning for each ofthe analog input channels.There is a set of vertical controls for each input channel. These controls are used to scale, position, andmodify that channel’s input signal so it can be viewed appropriately on the oscilloscope display. Inaddition to the dedicated vertical controls for each channel, there are also buttons to access the mathmenu, reference menu and bus menus.Vertical Position/Scale Controls1. The following steps will explore the use of the vertical axis position and scale front panel controls.a. Use the channel 1 vertical Position knob to position the waveform near the bottom of thedisplay and notice the ground level indicator also moves.The vertical position control moves the waveform up and down. It is generally used to align thewaveform with the vertical divisions on the graticule. Position is generally a graphical displayfunction only and does not affect the acquired waveform data.b. Use the channel 1 vertical Scale knob to change the vertical scale from 2 V/div to 1 V/div.The vertical scale (Volts/division) control adjusts the height of the waveform on the display.Generally, the vertical scale control changes the settings of the input amplifier and/or attenuatorand does affect the acquired waveform data. Because the vertical scale controls the amplitudeof the signal going into the ADC, the highest-resolution measurements are achieved when thesignal almost fills the screen vertically without going off screen.Key Points to Remember1. The vertical position knob controls the position of the waveform on the vertical axis.2. The vertical scale knob controls the amount of voltage represented by a vertical division on thegraticule.ExerciseTo make the highest-resolution measurement, what vertical scale should be used to measure thePROBE COMP square wave? Why?Revision 1.0Page 9 of 18
Introduction to OscilloscopesLab ExperimentHorizontal ControlsIntroductionThe horizontal controls are used to scale and position the time axis of the oscilloscope display. There isa dedicated front panel control for setting the horizontal scale (time/division) of the display and anotherfor setting the horizontal position of the displayed signals. The Acquire menu offers additional optionsfor modifying the waveform display, as well as setting the record length.Horizontal Position/Scale Controls1. The following steps will explore the use of the horizontal axis scale front panel control. Thehorizontal scale control (also known as time/division or seconds/division) adjusts the amount of timedisplayed on the screen.a. Press the front panel Autoset button to restore the oscilloscope to a known starting point andthen set the vertical scale to 1 V/div.b. Use the vertical Position knob to center the waveform on the screen.c.Turn the horizontal Scale knob until the horizontal readout indicates 10μs/div (readout is shownin the bottom center of the display.)Since there are 10 divisions horizontally, a scale factor of 10 µsec/div yields a 100 µsec timewindow. This setting shows the actual shape of the rising edge of the square wave.2. The horizontal Position control moves the waveform and its horizontal reference or trigger point(indicated by the orange icon at the top of the display) back and forth on the display. This is used toalign the displayed waveform with the horizontal divisions on the display graticule.a. Turn the horizontal Position knob counter-clockwise to position the waveform’s falling edge atthe center of the display.Key Points to Remember1. The horizontal scale control sets the time window displayed on the oscilloscope screen. Since thereare 10 divisions horizontally, the time window is equal to:time window horizontal scale factor 10 divisions2. The horizontal position knob allows you to align the displayed waveform with the horizontal divisionsof the display graticule or to view a different section of the displayed waveform.ExerciseIf the horizontal scale factor were set to 1 μsec/div, the displayed time window would be:Setting the Record Length1. The following steps will investigate the relationship between the oscilloscope’s horizontal scalefactor, record length and sample rate.a. Set the horizontal scale to 100 μs/div.b. Press the Acquire front panel button. Press the Acquisition Details bottom bezel button.Notice that the sample rate is currently 125 MS/s for a record length of 125 kpoints.c.Press the Record Length bottom bezel button and press the 1.00M points side bezel button.This sets the record length to 1 Mpoints.d. Press the Acquisition Details bottom bezel button again. Notice that the sample rate is now 1GS/s. The 1 msec time window has not changed, meaning the sample rate was increased bythe same ratio as the record length.Revision 1.0Page 10 of 18
Introduction to OscilloscopesLab ExperimentKey Points to Remember1. The sample rate of
Oscilloscopes are also used to measure electrical signals in response to physical stimuli, such as sound, mechanical stress, pressure, light, or heat. For example, a television technician can use an oscilloscope to measure signals from a television circuit board while a medical r