Transcription
XYZs of OscilloscopesPrimer
PrimerTable of ContentsIntroduction. 4Signal.Integrity.5.-.6The Significance of Signal Integrity .5Why is Signal Integrity a Problem? .5Viewing the Analog Origins of Digital Signals .6The.Oscilloscope.7.-.12Understanding Waveforms and WaveformMeasurements .7Types of Waves .8Sine Waves .9Square and Rectangular Waves.9Sawtooth and Triangle Waves.9Step and Pulse Shapes .9Periodic and Non-periodic Signals .9Synchronous and Asynchronous Signals .9Complex Waves .10Waveform Measurements .11Frequency and Period .11Voltage .11Amplitude .11Phase .11Waveform Measurements with Digital Digital Storage Oscilloscopes .13Digital Phosphor Oscilloscopes .15Mixed Domain Oscilloscopes .17Mixed Signal Oscilloscopes .17Digital Sampling ertical System and Controls .20Position and Volts per Division .20Input Coupling .20Bandwidth Limit .20Bandwidth Enhancement .21Horizontal System and Controls .21Acquisition Controls .21Acquisition Modes .21Common horizontal controls include:.21Types of Acquisition Modes .22Starting and Stopping the Acquisition System .22Sampling .23Sampling Controls .23Real-time Sampling Method .23Equivalent-time Sampling Method .25Position and Seconds per Division.27Time Base Selections .27Zoom/Pan .27Search .27XY Mode .27Z Axis .27XYZ Mode with DPO and XYZ Record Display .27Trigger System and Controls .28Trigger Position.30Trigger Level and Slope .30Trigger Modes .31Trigger Coupling .31Trigger Holdoff .31Display System and Controls .32Other Oscilloscope Controls.32Math and Measurement Operations .32Digital Timing and State Acquisitions .32
XYZs of 36Operating.the.Oscilloscope.44.-.45Probes .33Passive Probes .34Active and Differential Probes .35Logic Probes.35Specialty Probes .36Probe Accessories .36Proper Grounding .44Setting the Controls .44Calibrating the Instrument .45Connecting the Probes .45Compensating the Probes dwidth .36Rise Time .37Sample Rate .38Waveform Capture Rate .39Record Length .39Triggering Capabilities .40Effective Bits .40Frequency Response .40Vertical Sensitivity .40Sweep Speed .40Gain Accuracy .40Horizontal Accuracy (Time Base) .40Vertical Resolution (Analog-to-Digital Converter) .40Timing Resolution (MSO) .41Connectivity .41Expandability.41Ease-of-Use age Measurements .47Time and Frequency Measurements .48Pulse Width and Rise Time Measurements .48Phase Shift Measurements.49Other Measurement Techniques .49Written.Exercises.50.-.55Part IA: Vocabulary Exercise .50B: Application Exercise .51Part IIA: Vocabulary Exercise .52B: Application Exercise .53Answer pes3
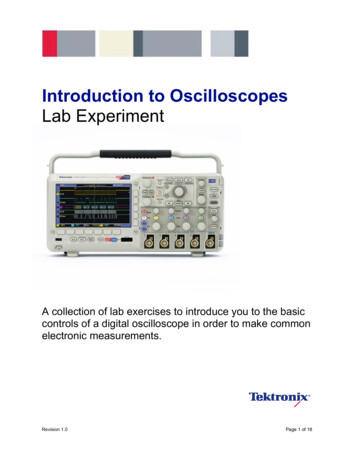
PrimerIntroductionLight SourceNature moves in the form of a sine wave, be it an oceanwave, earthquake, sonic boom, explosion, sound throughair, or the natural frequency of a body in motion. Energy,vibrating particles and other invisible forces pervade ourphysical universe. Even light – part particle, part wave – has afundamental frequency, which can be observed as color.Sensors can convert these forces into electricalsignals that you can observe and study with anoscilloscope. Oscilloscopes enable scientists,engineers, technicians, educators and others to“see” events that change over time.Oscilloscopes are indispensable tools for anyone designing,manufacturing or repairing electronic equipment. In today’sfast-paced world, engineers need the best tools available tosolve their measurement challenges quickly and accurately. Asthe eyes of the engineer, oscilloscopes are the key to meetingtoday’s demanding measurement challenges.The usefulness of an oscilloscope is not limited to the worldof electronics. With the proper sensor, an oscilloscope canmeasure all kinds of phenomena. A sensor is a device thatcreates an electrical signal in response to physical stimuli,such as sound, mechanical stress, pressure, light, or heat. Amicrophone is a sensor that converts sound into an electricalsignal. Figure 1 shows an example of scientific data that canbe gathered by an oscilloscope.Oscilloscopes are used by everyone from physicists to repairtechnicians. An automotive engineer uses an oscilloscope tocorrelate analog data from sensors with serial data from theengine control unit. A medical researcher uses an oscillscopeto measure brain waves. The possibilities are endless.The concepts presented in this primer will provide you with agood starting point in understanding oscilloscope basics andoperation.4www.tektronix.com/oscilloscopesPhoto CellFigure.1.An example of scientific data gathered by an oscilloscope.The glossary in the back of this primer will give you definitionsof unfamiliar terms. The vocabulary and multiple-choice writtenexercises on oscilloscope theory and controls make thisprimer a useful classroom aid. No mathematical or electronicsknowledge is necessary.After reading this primer, you will be able to:Describe how oscilloscopes workDescribe the differences between various oscilloscopesDescribe electrical waveform typesUnderstand basic oscilloscope controlsTake simple measurementsThe manual provided with your oscilloscope will give youmore specific information about how to use the oscilloscopein your work. Some oscilloscope manufacturers also providea multitude of application notes to help you optimize theoscilloscope for your application-specific measurements.Should you need additional assistance, or have any commentsor questions about the material in this primer, simply contactyour Tektronix representative, or visit www.tektronix.com.
XYZs of OscilloscopesSignal IntegrityThe Significance of Signal IntegrityThe key to any good oscilloscope system is its ability toaccurately reconstruct a waveform – referred to as signalintegrity. An oscilloscope is analogous to a camera thatcaptures signal images that we can then observe andinterpret. Two key issues lie at the heart of signal integrity.When you take a picture, is it an accurate picture of whatactually happened?Is the picture clear or fuzzy?How many of those accurate pictures can you take persecond?Taken together, the different systems and performancecapabilities of an oscilloscope contribute to its ability to deliverthe highest signal integrity possible. Probes also affect thesignal integrity of a measurement system.Signal integrity impacts many electronic design disciplines. Butuntil a few years ago, it wasn’t much of a problem for digitaldesigners. They could rely on their logic designs to act like theBoolean circuits they were. Noisy, indeterminate signals weresomething that occurred in high-speed designs – somethingfor RF designers to worry about. Digital systems switchedslowly and signals stabilized predictably.Processor clock rates have since multiplied by orders ofmagnitude. Computer applications such as 3D graphics,video and server I/O demand vast bandwidth. Much of today’stelecommunications equipment is digitally based, and similarlyrequires massive bandwidth. So too does digital high-definitionTV. The current crop of microprocessor devices handles dataat rates up to 2, 3 and even 5 GS/s (gigasamples per second),while some DDR3 memory devices use clocks in excess of2 GHz as well as data signals with 35 ps rise times.Importantly, speed increases have trickled down to thecommon IC devices used in automobiles, consumerelectronics, and machine controllers, to name just a fewapplications.A processor running at a 20 MHz clock rate may well havesignals with rise times similar to those of an 800 MHzprocessor. Designers have crossed a performance thresholdthat means, in effect, almost every design is a high-speeddesign.Without some precautionary measures, high-speed problemscan creep into otherwise conventional digital designs. If acircuit is experiencing intermittent failures, or if it encounterserrors at voltage and temperature extremes, chances are thereare some hidden signal integrity problems. These can affecttime-to-market, product reliability, EMI compliance, and more.These high-speed problems can also impact the integrity ofa serial data stream in a system, requiring some method ofcorrelating specific patterns in the data with the observedcharacteristics of high-speed waveforms.Why is Signal Integrity a Problem?Let’s look at some of the specific causes of signal degradationin today’s digital designs. Why are these problems so muchmore prevalent today than in years past?The answer is speed. In the “slow old days,” maintainingacceptable digital signal integrity meant paying attentionto details like clock distribution, signal path design, noisemargins, loading effects, transmission line effects, bustermination, decoupling and power distribution. All of theserules still apply, but Bus cycle times are up to a thousand times faster than theywere 20 years ago! Transactions that once took microsecondsare now measured in nanoseconds. To achieve thisimprovement, edge speeds too have accelerated: they are upto 100 times faster than those of two decades ago.This is all well and good; however, certain physical realitieshave kept circuit board technology from keeping up the pace.The propagation time of inter-chip buses has remained almostunchanged over the decades. Geometries have shrunk,certainly, but there is still a need to provide circuit board realestate for IC devices, connectors, passive components, and ofcourse, the bus traces themselves. This real estate adds up todistance, and distance means time – the enemy of speed.www.tektronix.com/oscilloscopes5
PrimerIt’s important to remember that the edge speed – rise time – ofa digital signal can carry much higher frequency componentsthan its repetition rate might imply. For this reason, somedesigners deliberately seek IC devices with relatively “slow”rise times.The lumped circuit model has always been the basis of mostcalculations used to predict signal behavior in a circuit. Butwhen edge speeds are more than four to six times faster thanthe signal path delay, the simple lumped model no longerapplies.Circuit board traces just six inches long become transmissionlines when driven with signals exhibiting edge rates below fourto six nanoseconds, irrespective of the cycle rate. In effect,new signal paths are created. These intangible connectionsaren’t on the schematics, but nevertheless provide a meansfor signals to influence one another in unpredictable ways.Sometimes even the errors introduced by theprobe/instrument combination can providea significant contribution to the signal beingmeasured. However, by applying the “squareroot of the sum of the squares” formula to themeasured value, it is possible to determinewhether the device under test is approachinga rise/fall time failure. In addition, recentoscilloscope tools use special filtering techniquesto de-embed the measurement system’s effectson the signal, displaying edge times and othersignal characteristics.6www.tektronix.com/oscilloscopesAt the same time, the intended signal paths don’t work theway they are supposed to. Ground planes and power planes,like the signal traces described above, become inductive andact like transmission lines; power supply decoupling is far lesseffective. EMI goes up as faster edge speeds produce shorterwavelengths relative to the bus length. Crosstalk increases.In addition, fast edge speeds require generally higher currentsto produce them. Higher currents tend to cause groundbounce, especially on wide buses in which many signalsswitch at once. Moreover, higher current increases the amountof radiated magnetic energy and with it, crosstalk.Viewing the Analog Origins of Digital SignalsWhat do all these characteristics have in common? They areclassic analog phenomena. To solve signal integrity problems,digital designers need to step into the analog domain. And totake that step, they need tools that can show them how digitaland analog signals interact.Digital errors often have their roots in analog signal integrityproblems. To track down the cause of the digital fault,it’s often necessary to turn to an oscilloscope, which candisplay waveform details, edges and noise; can detect anddisplay transients; and can help you precisely measuretiming relationships such as setup and hold times. Modernoscilloscopes can help to simplify the troubleshooting processby triggering on specific patterns in parallel or serial datastreams and displaying the analog signal that corresponds intime with a specified event.Understanding each of the systems within your oscilloscopeand how to apply them will contribute to the effectiveapplication of the oscilloscope to tackle your specificmeasurement challenge.
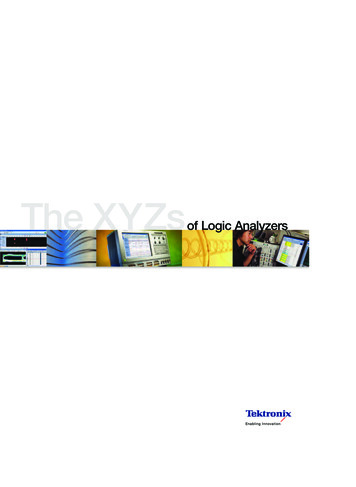
XYZs of OscilloscopesX (time)Y (voltage)Y (voltage)Z (intensity)X (time)Z (intensity)Figure.2.X, Y, and Z components of a displayed waveform.The OscilloscopeWhat is an oscilloscope and how does it work? This sectionanswers these fundamental questions.The oscilloscope is basically a graph-displaying device – itdraws a graph of an electrical signal. In most applications, thegraph shows how signals change over time: the vertical (Y)axis represents voltage and the horizontal (X) axis representstime. The intensity or brightness of the display is sometimescalled the Z axis, as shown in Figure 2. In DPO oscilloscopes,the Z axis can be represented by color grading of the display,as seen in Figure 3.This simple graph can tell you many things about a signal,such as:The time and voltage values of a signalThe frequency of an oscillating signalThe “moving parts” of a circuit represented by the signalFigure.3.Two offset clock patterns with Z axis intensity grading.Understanding Waveforms and WaveformMeasurementsThe generic term for a pattern that repeats over time is awave – sound waves, brain waves, ocean waves, and voltagewaves are all repetitive patterns. An oscilloscope measuresvoltage waves. Remember as mentioned earlier, that physicalphenomena such as vibrations or temperature or electricalphenomena such as current or power can be converted to avoltage by a sensor. One cycle of a wave is the portion of thewave that repeats. A waveform is a graphic representation ofa wave. A voltage waveform shows time on the horizontal axisand voltage on the vertical axis.The frequency with which a particular portion of the signal isoccurring relative to other portionsWhether or not a malfunctioning component is distortingthe signalHow much of a signal is direct current (DC) or alternatingcurrent (AC)How much of the signal is noise and whether the noise ischanging with timewww.tektronix.com/oscilloscopes7
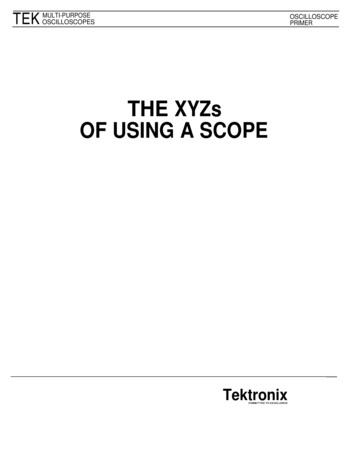
PrimerSine WaveDamped Sine WaveSquare WaveRectangular WaveSawtooth WaveTriangle WaveStepPulseComplexFigure.4.Common waveforms.Figure.5.Sources of common waveforms.Waveform shapes reveal a great deal about a signal. Any timeyou see a change in the height of the waveform, you knowthe voltage has changed. Any time there is a flat horizontalline,
XYZs of Oscilloscopes Signal Integrity The Significance of Signal Integrity The key to any good oscilloscope system is its ability to accurately reconstruct a waveform – referred to as signal integrity. An oscilloscope is analogous to a camera