Transcription
Sustainable Finance InitiativeNotCopyorCite.Precourt Institute for EnergyA PRIL 2021Scope 3 Emissions: Measurement and ManagementDraft–DoWorking PaperGireesh Shrimali, PhDPrecourt Energy ScholarSustainable Finance InitiativeStanford UniversityScope 3 Emissions: Measurement and Management1
Table of ContentsI. Introduction.32. 1st-Best Methods for Calculating Scope 3 Emissions.62.1 Addressing double counting in presence of reliable data.62.2 Fair attribution and efficient management of supply chain emissions.8NotCopyorCite.3. Practical Methods of Calculating and Managing Scope 3 Emissions. 103.1 Reliability of Scope 3 emissions.103.2 Managing uncertainty in calculating Scope 3 emissions.113.3 Managing uncertainty in managing Scope 3 emissions.134. Path Forward.155. References. 166. Appendices.216.1 A brief history of Scope 3 emissions protocols.21Draft–Do6.2 A recursive method for calculating Scope 3 emissions.23Scope 3 Emissions: Measurement and Management2
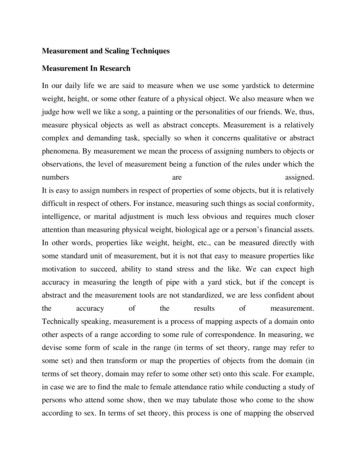
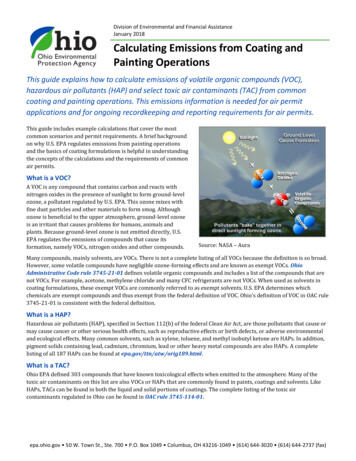
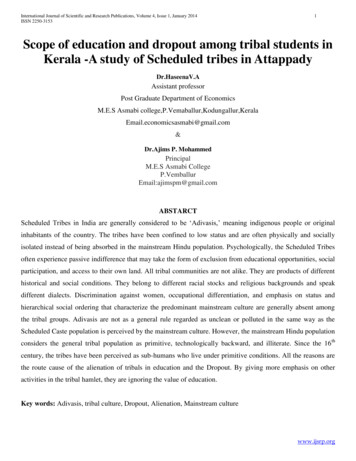
1IntroductionNotCopyorCite.Given that climate change is one of the biggest risks facing the real economy as well as the financial industry,there is an urgent need to measure and manage this risk (TCFD, 2017). For example, this risk may come from newregulation of a company’s high emission products and shifts in end-product market demand driven by climateconcerns. One way to measure this risk is the carbon (or carbon dioxide/CO2) exposure of products and theircorresponding supply chains (Economist, 2020).1This risk can be internalized by these supply chains in presence of a universal carbon tax (Metcalf and Weisbach,2009). However, such a universal tax, or even an equivalent cap-and-trade program, appears unlikely due topolitical economy related barriers (Cullenward and Victor, 2020). Nevertheless, even in the absence of such a tax,it is of tremendous value to measure and manage this carbon exposure, given that it provides a measure of thetransition risk facing companies in these supply chains (Baker, 2020).2Furthermore, many companies are under increasing pressure from their shareholders and stakeholders to committo reducing their carbon footprints in a significant manner over time. Failing to do so may raise reputationalconcerns, with adverse implications for financial performance (GS, 2019). Recognizing these drivers, since the Parisagreement, more than 1200 companies have committed to climate action through the We Mean Business Platformand over 800 companies have committed to setting science-based targets (BSR, 2020). Recent examples of financialinstitutions setting net-zero target are Barclays,3 HSBC,4 and J P Morgan Chase.5Draft–DoThe carbon exposure of a business entity – e.g., a corporate or a financial institution – is typically measured in threedifferent ways (WRI, 2017). Scope 1 emissions are the entity’s emissions due to its own activities, e.g., coal powerplant emissions for the corresponding power producer. Scope 2 emissions are the emissions from the electricityprocured by the business entity, e.g., the coal power plant emissions for the corresponding buyer of electricity.Scope 3 emissions are the emissions of the remainder of the supply chain (minus electricity, i.e., Scope 2), of bothupstream and downstream activities (Figure 1). Thus, in a way, Scope 2 emissions are a special kind of Scope 3emissions, but they are counted separately due to historical reasons.1 For financial institutions, other ways include the following (Economist, 2020): one, gauging greenness to see whether portfolios are alignedwith the Paris agreement (e.g., by the 2 Degrees Investing Initiative); and two, assigning temperature scores to portfolios (Raynaud, 2020).2 It is important to note that the carbon risk is not the only measure of climate risk (Busch, 2018; PCAF, 2015), given that such risks may includetechnology, markets, and policy risks as well. However, it is a useful proxy.3 See ate-change/highlights/4 See tegy/becoming-a-net-zero-bank5 See yScope 3 Emissions: Measurement and Management3
NotCopyorCite.Figure 1: Scope 1 and Scope 3 (both upstream and downstream) emissions in a simplified settingTo get an accurate sense of a business entity’s carbon risk, it is then pertinent that all three emissions are accuratelycalculated. Accurate measurement of these emissions would allow business entities to track progress towards theirstated climate targets and transition pathways (SBTi, 2020; TPI, 2020). Companies have so far focused on measuringand reducing their Scope 1 and Scope 2 emissions, and they have been quite successful in doing do (BSR, 2020).However, the greatest emission reduction opportunities lie in the Scope 3 emissions going forward, given that onaverage the Scope 3 emissions are 5.5 times the amount of combined Scope 1 and Scope 2 emissions (BSR, 2020).For example, for Lego and Walmart, Scope 3 emissions constitute 75% and 90%, respectively, of total emissions(Huang et al, 2020).6 In fact, it has now been established that more than 50% of the world’s carbon emissions are ineight supply chains (WEF, 2021).7Draft–DoTherefore, while the historical focus has been on Scope 1 and Scope 2 emissions, now the focus is starting to shiftto Scope 3 emissions, not only for assessing the carbon risk of the supply chain but also to hold business entitiesresponsible for the whole supply chain. This also ensures that the carbon emissions of a business entity are notsimply pushed to other parts of the supply chain (Chen et al, 2019; Granot et al, 2014).8While the process of calculating Scope 1 and Scope 2 emissions is well established (Busch, 2018); the same cannotbe said of Scope 3 emissions, despite multiple ongoing efforts by coalitions (GHP, 2020; PCAF, 2020; UNFCCC, 2015;SE, 2018) and industry actors (API, 2016; BHP, 2019), 9 as well as commercial data providers (Busch et al, 2018).Among these, GHP (2020) and PCAF (2020) are particularly instructive, given that the former is the overall industrystandard, and the latter is the frontrunner standard for financial institutions, and we examine them more closely inour discussion paper.6 As other examples, Larsen et al (2012) shows that upstream Scope 3 emissions are up to 95% of Norwegian municipalities’ total emissionfootprints; and CDP (2016) finds that most of the supply chain emissions are in bought or sold product categories, as defined by GHP (2020).7 WEF (2021) further argues that most of these emissions can be eliminated using cheap carbon abatement measures (e.g., energy efficiencyand renewable energy) costing about 10/ton, with eventual impact to customers being less than 5%.8 For instance, according to Porter (2013), about a fifth of China’s emissions are for products consumed outside its borders, and althoughEurope emitted only 3.6 billion metric tons of CO2 in 2011, 4.8 billion tons of CO2 were created to make the products Europeans consumedin that year. This is also evident from the global carbon import flows in WEF (2021). As another example (Chen et al, 2019), self-reported datafrom Wesfarmers in Australia shows a negative correlation between Scope 1 (or 2) emissions and Scope 3 emissions, indicating that Scope 3emissions typically go up due to leakage as companies reduce their Scope 1 (or 2) emissions.9 GHP (2020) is by the Greenhouse Gas Protocol, a partnership between the World Resource institute (WRI) and World Business Council forSustainable Development (WBSCD). GHP (2020) is the de-facto standard, referenced by other frameworks: PCAF (2020) is by the Partnershipfor Climate Aligned Finance, a coalition of financial institutions; IFI (2015) is for international financial institutions; SE (2018) is for academicinstitutions; API (2016) is for the petroleum industry; and BHP (2019) is for the Broken Hill Proprietary Company (BHP). A brief history of theseefforts pertinent to the financial industry is provided in the Appendix (Section 6.1).Scope 3 Emissions: Measurement and Management4
For example, as of March 2020, only 18% of the constituents of MSCI ACWI IMI reported Scope 3 emissions (Baker,2020), with considerable variability across sectors. As another example, there is increasing evidence that many ofthe worst polluters – both private (e.g., Exxon) and public (e.g., NIOC/Iran) – either under-report or do not reportat all (Fick ling and He, 2020). Furthermore, the Scope 3 emissions data from commercial data providers tendsto be high inconsistent, with correlations as low as 1%, which calls for not only increased transparency but alsostandardization (Busch et al, 2018).10NotCopyorCite.This may be due to various barriers, such as lack of transparency of supply chain, lack of direct connections withvarious tiers of suppliers, reduced leverage to influence action, and complex accounting principles (BSR, 2020).Furthermore, the industry standard (i.e., GHP, 2020) provides so much scope for discretion and ambiguity that theultimate reporting, if it is there at all, can be inconsistent and misleading (Fickling and He, 2020). In this discussionpaper, therefore, we focus on Scope 3 emissions, in both upstream and downstream parts of a business entity’ssupply chain.As mentioned above, while there are many ongoing efforts by coalitions, and there are many organizationsproviding Scope 3 emissions data;11 the focus of this discussion paper is on (a) identifying key issues – i.e., doublecounting as well as unreliable data – that still need to be resolved in order for Scope 3 emissions to become reliablesources of supply chain carbon risk, and (b) providing some initial thoughts on how these issues can be addressed,including existing approaches (Sections 2.1 and 3.2). In this process, we also recognize that the eventual goal maybe to reduce carbon footprints of supply chains and, therefore, examine practical ways of doing so as well (Sections2.2 and 3.3).Draft–DoIn this paper, we focus on the key issues of measurement and management of Scope 3 emission. In this discussionpaper on Scope 3 emissions, the focus is not on developing a comprehensive framework. A lot of well-fundedorganizations and consortia are already working on such frameworks (see Section 6.1for a brief history of suchframeworks for the financial sector). The idea here is to highlight some of the key issues facing such frameworks andsuggest potential solutions.The rest of the paper is organized as follows. In presence of reliable data, Section 2 examines how double countingcan be appropriately addressed, whether for Scope 3 or for supply chain emissions. Section 3 then discussesmethods and issues around measurement and management of uncertain and unreliable Scope 3 emissions.Section 4 concludes with ideas for future work.10 The low consistency of Scope 3 emissions can be attributed to (a) different data sources as well as (b) estimation methods. This is nodifferent from other methods to track climate alignment – for example, analyzing 12 methods that assign temperature scores to portfolios,Raynaud (2020) finds scores ranging from 1.5C to 4C.11 For example, the greenhouse gas protocol identifies more than 50 databases (see https://ghgprotocol.org/life-cycle-databases) forcollecting data for product life cycle and corporate value chain – i.e., Scope 3 – emission inventories. Furthermore, Busch (2018) identifies ninecommercial data providers, with eight providing Scope 3 emissions, including the following: Bloomberg, Carbon Data Market, CDP, Inrate, ISSESG, MSCI, Sustainalytics, Thomson Reuters, and Trucost.Scope 3 Emissions: Measurement and Management5
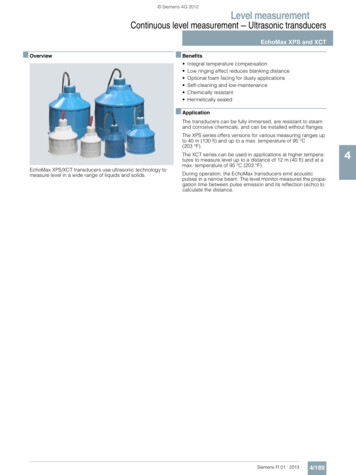
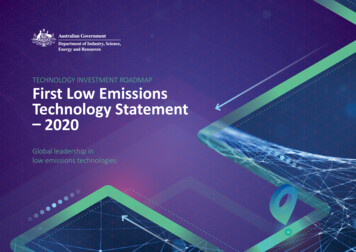
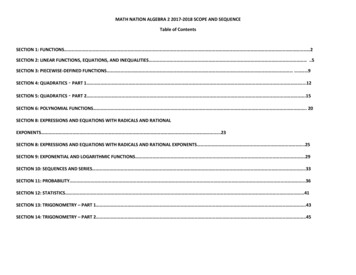
21st-Best Methods for Calculating Scope 3 EmissionsIn this section, we provide a glimpse into an ideal method based on reliable data for measuring Scope 3 emissions,by examining the following questions: How to define boundaries and allocate emissions, using appropriate controlmethod? What is the role & feasibility of compulsory measurement? How to take care of double counting? Etc.2.1NotCopyorCite.One of the major issues with measuring Scope 3 emissions is the reliability (or accuracy) of data, includingthe mismatch in data quality in different parts of the supply chain (Busch et al, 2018). While we discuss how toaddress the issue of reliability, assuming that the data quality is not an issue, we first set some basic principles forcalculating Scope 3 emissions. The data quality – on emissions as well as emission factors – can be made 100%reliable in an ideal world, whether it is either mandated by regulation (i.e., is compulsory), or is market driven viaeither demand pull or supply push. This would essentially mean that the bottom-up process-based methods can beapplied universally, enabling reliable calculation of emissions and emission factors (GHP, 2020).Addressing double counting in presence of reliable data–DoIn this context, assuming 100% reliable data, the next biggest issue is the so-called double counting (BHP, 2019;PCAF, 2020). Supply chains are interconnected networks, and care needs to be taken to ensure that emissions arenot counted multiple times in the Scope 3 emissions of a business entity (Lenzen, 2008).12 While double countingmay not ultimately be an issue if the ultimate goal is to drive the overall supply chain emissions to zero,13 it is likelyto be an issue in the interim, given that there is typically a need to compare different business entities and theirprogress towards stated climate targets.DraftDouble counting can be of two kind: one that is inherent in calculating the Scope 3 emissions of different actorswithin a product’s supply chain; and another that occurs due to entanglement of supply chains of differentproducts. An example of the former (i.e., within supply chain double counting) is that the Scope 1 emission ofan upstream entity is part of the Scope 3 emissions of multiple downstream entities at different levels (Figure2), whereas an example of the latter (i.e., across supply chains double counting) is if the Scope 1 emission of anupstream entity is being assigned 100% to multiple immediate downstream entities that split up the use of theproduct from the upstream entity.12 For example, PCAF (2020) identifies the following types of double counting with respect to financial institutions: between financialinstitutions, in co-financing the same entity or activity, between transactions within the same financial institution, across different assetclasses, and within the same asset class.13 Imagine that the Scope 3 emissions for a business entity are a sum of multiple emission numbers (all positive) from the supply chain. Now, ifthe sum goes to zero, all the constituent numbers also need to go to zero; and, double counting is unlikely to matter.Scope 3 Emissions: Measurement and Management6
NotCopyorCite.Figure 2: Within supply chain double counting [Source: GHP (2020)]In this discussion paper, our assumption is that the former (i.e., within supply chain double counting) is organic incalculating Scope 3 emissions and should be allowed to accurately represent supply chain carbon exposure (i.e.,risk) for all entities in the supply chain. We, therefore, focus on eliminating double counting for the latter (i.e., acrosssupply chains double counting), and our coverage of double counting in the remainder of this paper is focusedon eliminating across supply chains double counting, especially given that it has not received much attention inliterature (GHP, 2020; Baker, 2020; PCAF, 2020).14 However, we also cover the much covered issue of fair attribution –of attributing aggregate supply chain emissions to different actors, and avoiding the former as well – in Section 2.2.Draft–DoAcross supply chain double counting – our focus for the remainder of this paper – can be avoided by appropriateallocation of the upstream and downstream emissions to various downstream and upstream entities, respectively.These – i.e., upstream, and downstream emissions – can also be defined as embedded and latent emissions,respectively; given that upstream carbon emissions are already embedded in a product that is sold from a sellerto a buyer; whereas downstream emissions are latent in a product, to be emitted later (or downstream) in thesupply chain.In the Appendix (see Section 6.2), starting with Scope 1 emissions (and corresponding emission intensities), weprovide a simple recursive method of how Scope 3 emissions of the members in a supply chain can be calculatedon a per product basis, with straightforward extensions to multiple products. We note that, while elements of thismethod exist in GHP (2020), our paper is the first to provide this recursive method explicitly.In this context, we note that PCAF (2020) uses a similar method, while using the ratios of financed capital toenterprise values as the proportional fractions,15 to calculate the Scope 3 emissions of a financial institution.While the use of enterprise value itself has come under criticism, given that it can change due to market dynamics(Economist, 2020), this is a welcome start, and one potential fix could be to use the more stable book values of debtas well as equity as opposed to dynamically changing market values.14 It is pertinent to mention the approach used in Baker (2020), where they use a portfolio wide adjustment by a factor of 5. However, thismultiplier is likely to change as more firms report accurate data. Another pertinent mention is the recommendation for real estate (GRESB,2017; ICF, 2017), which allows across supply chain double counting in some cases, in-line with our original thinking about the long-term focuson elimination of supply chain emissions.15 Enterprise value is defined as the sum of market value of equity and book value of debt. The reasons for using enterprise values include thefollowing: first, to align with the EU TEG; and second, to avoid negative values.Scope 3 Emissions: Measurement and Management7
2.2Fair attribution and efficient management of supply chain emissionsA set of related issues are of fair attribution of total supply chain emissions to various actors in the supply chain,while avoiding double counting of any kind (i.e., both within and across supply chain), and ensuring 1st-bestreduction of emissions (Lenzen, 2008). Here 1st best reduction of emissions is typically from a societal point of viewand optimizes a social welfare function based on a given carbon price.NotCopyorCite.The key question in fair attribution is as follows: Given total supply chain emissions, what is the fair responsibility ofeach actor? The basic idea behind this fair attribution is to start with the total supply chain emissions – i.e., the sumof all Scope 1 emissions in the supply chain – and to at
eight supply chains (WEF, 2021).7 Therefore, while the historical focus has been on Scope 1 and Scope 2 emissions, now the focus is starting to shift to Scope 3 emissions, not only for assessing the carbon risk of the supply chain but also to hold business entities