Transcription
College ReadinessLINKING STUDYA Study of the Alignment of the RIT Scales of NWEA’s MAP Assessments with the College Readiness Benchmarks ofEXPLORE , PLAN , and ACT December 2011(updated January 17, 2012)COPYRIGHT 2011 NORTHWEST EVALUATION ASSOCIATIONAll rights reserved. No part of this document may be reproduced or utilized inany form or by any means, electronic or mechanical, including photocopying,recording, or by any information storage and retrieval system, without writtenpermission from NWEA.MAP is a registered trademark of Northwest Evaluation Association. The ACT is a registered trademark of ACT, Inc., in the U.S.A. and other countries.EXPLORE and PLAN are registered trademarks of ACT, Inc.Disclaimer: This report is the product of research conducted by the NorthwestEvaluation Association. Neither the report nor its findings are sponsored orendorsed by ACT, Inc.Updated on January 17, 2012
A STUDY OF THE ALIGNMENT OF THE RIT SCALES OF NWEA’S MAP ASSESSMENTS WITH THE COLLEGE READINESS BENCHMARKS OFEXPLORE , PLAN , AND ACT DECEMBER 2011Recently, NWEA completed a study to examine the predictive relationship between the RIT scales ofNWEA’s MAP assessments in reading, language usage, and mathematics to the college readinessbenchmarks of the EXPLORE, PLAN, and ACT achievement tests in reading, English, and mathematics.The EXPLORE, PLAN, and ACT also offer tests in science achievement, but these tests were not includedin the current study. The objective of this study was to identify cut scores on the MAP reading, languageusage, and general mathematics tests that correspond to the published college readiness benchmarkson the EXPLORE, PLAN, and ACT assessments (ACT, 2010). A secondary objective was to create a seriesof probability tables that estimate the likelihood of meeting the designated college readinessbenchmark, given an observed MAP score.To conduct the study, we linked together individual EXPLORE, PLAN, and ACT scale scores and NWEAMAP assessment RIT scores for a sample of students who had completed both exams in the same (or acomparable) subject. EXPLORE, PLAN, and ACT scores were provided by NWEA partnering schooldistricts and individually linked to those students’ MAP assessment RIT scores from the same (or theprior) testing season. In all, the sample contained over 108,000 matched pairs of scores from 26,000students from 140 schools in three states. All valid matched data (i.e., data with valid scores and linkingIDs) from the resulting sample were included in the analyses; no attempt was made to rebalance thesample in order to simulate a state- or nationally-representative population.Visual examinations of scatter plots of the data revealed curvilinear relationships between the MAPscale scores and the EXPLORE, PLAN and ACT scale scores. Consequently, a series of curvilinear(quadratic) regression models were fitted to the data, using MAP RIT scores as the single predictor ofperformance on each of the college readiness tests. MAP assessments in reading and language usagewere both fit to predictive models of performance on college readiness tests of English and Reading.MAP mathematics was used to predict mathematics college readiness. In all, fifteen predictive modelswere fitted. See the Methodology Appendix for a more detailed description of the methods used.Table Sets 1 and 2 show the estimated cut scores, or minimum equivalent RIT scores corresponding tothe college readiness benchmarks on EXPLORE, PLAN, or ACT when taken in the same (spring) or prior(fall) testing seasons. Also shown are the NWEA normative percentile ranks1 associated with these MAP1Percentile ranks are based on NWEA’s 2011 norming study.Updated on January 17, 2012
cut scores. These tables can be used to identify students who might benefit from additional assistance,or who may be at risk of failing to meet these benchmarks. The percentile ranks also provide anindicator of the difficulty of these benchmarks, relative to a nationally representative norming sample.In general, the MAP cut scores associated with the college readiness benchmarks in English range fromthe 40th to 60th percentiles on the MAP reading and language usage tests, while the college readinessbenchmarks in reading and mathematics are higher, ranging primarily from the 70th to 80th percentileson the MAP assessments reading and mathematics tests, respectively.The tables in Table Set 3 show the estimated probability of a student meeting the designated collegereadiness benchmark, based on that student’s RIT score taken in the same testing season. These tablesprovide empirical information about the likelihood of meeting or exceeding the designated collegereadiness benchmark, given an observed MAP RIT score.The tables in Table Set 4 show the correlation coefficients and the goodness-of-fit statistics for theregression models used to predict MAP and the corresponding college readiness tests. These statisticsshow the degree to which MAP scores accurately predicted the PLAN, EXPLORE, and ACT scale scores ofthe study sample. The reported models show a moderately high correlation between MAP RIT scoresand the scores on the college readiness benchmark tests, with correlations ranging from .66 to .87, butprimarily in the range of .75-.80. In general, values at or near 1.0 suggest a perfect predictiverelationship, whereas values near 0.0 indicate no predictive relationship. Goodness-of-fit statisticsindicate that substantial variation within the observed college readiness benchmark scores can bepredicted by MAP RIT scores, with values ranging from 44-76% of observed variance.The tables in Table Set 5 show the accuracy of the estimated MAP cut scores in predicting whetherstudents met or exceeded the corresponding college readiness benchmark for the study sample. Ingeneral, the estimated MAP cut scores accurately predicted whether or not students would meet theEXPLORE, PLAN, and ACT benchmarks with 75-90% accuracy. Among incorrect predictions, falsenegatives (students who were incorrectly predicted NOT to meet the college readiness benchmark)outnumbered false positives (students predicted to meet readiness benchmarks but who failed to doso).The estimated MAP cut scores in this report provide a basis for making useful predictions aboutstudents’ likely college readiness status, as measured by EXPLORE, PLAN, and ACT, when MAP is takenwithin the same (or nearly the same) testing season. However, MAP is not designed to measureidentical content as the ACT assessments. MAP assessments are aligned to each state’s curriculumstandards rather than the curriculum standards of the ACT. Thus while the tests measure much contentthat would be similar, they do not share a common design. Knowledge of a student’s MAP scorepermits fairly accurate predictions about a student’s probable college readiness status, as measured byEXPLORE, PLAN, or ACT.Updated on January 17, 2012
TABLE SET 1 – MINIMUM ESTIMATED SAME-SEASON (SPRING) RIT CUT SCORESCORRESPONDING TO COLLEGE READINESS BENCHMARKS 2MAP Reading RIT Score as Predictor – Same SeasonGrade81011Cut Scores and Normative Percentile Ranks on MAP Corresponding to College Readiness rk CutNormativeCollegeBenchmark lishACT Reading 2123777ACT English1823268MAP Language Usage RIT Score as Predictor – Same SeasonGrade81011Cut Scores and Normative Percentile Ranks on MAP Corresponding to College Readiness rk CutNormative CollegeBenchmark 1943ReadingEnglishPLAN Reading 1723273PLAN English1522556ACT Reading2123476ACT English1822862MAP Mathematics RIT Score as Predictor – Same SeasonGrade81011Cut Scores and Normative Percentile Ranks on MAP Corresponding to College Readiness BenchmarksMathematics College Readiness TestMAP CutMAP NormativeBenchmarkScorePercentile RankEXPLORE Math1724572PLAN Math1925177ACT Math22258832The MAP cut scores shown in these tables are the minimum estimated scores. Meeting the minimum MAP cutscore corresponds to a 50% probability of achieving that benchmark. Use the probabilities in Table Set 3 todetermine the appropriate ‘target’ scores for a desired level of certainty.Updated on January 17, 2012
TABLE SET 2 – MINIMUM ESTIMATED PRIOR-SEASON (FALL) RIT CUT SCORESCORRESPONDING TO COLLEGE READINESS BENCHMARKS 3MAP Reading RIT Score as Predictor – Prior SeasonGrade81011Cut Scores and Normative Percentile Ranks on MAP Corresponding to College Readiness BenchmarksReadingMAPMAPEnglishMAP Cut MAPCollegeBenchmarkCutNormative CollegeBenchmark ScoreNormativeReadinessScore Percentile XPLORE1321744ReadingEnglishPLAN Reading 1723273PLAN1522658EnglishACT Reading2123677ACT1823168EnglishMAP Language Usage RIT Score as Predictor – Prior SeasonGrade81011Cut Scores and Normative Percentile Ranks on MAP Corresponding to College Readiness rk CutNormative CollegeBenchmark CutNormativeReadinessScore Percentile 2672EXPLORE1321643ReadingEnglishPLAN Reading 1723073PLAN English1522456ACT Reading2123376ACT English1822762MAP Mathematics RIT Score as Predictor – Prior SeasonGrade81011Cut Scores and Normative Percentile Ranks on MAP Corresponding to College Readiness BenchmarksMathematics College Readiness TestBenchmarkMAP Cut ScoreMAP NormativePercentile RankEXPLORE Math1724072PLAN Math1924877ACT Math22255833The MAP cut scores shown in these tables are the minimum estimated scores. Meeting the minimum MAP cutscore corresponds to a 50% probability of achieving that benchmark. Use the probabilities in Table Set 3 todetermine the appropriate ‘target’ scores for a desired level of certainty.Updated on January 17, 2012
TABLE SET 3 –PROBABILITY OF MEETING OR EXCEEDING COLLEGE READINESS BENCHMARKIN SAME SEASON (SPRING), BY STUDENT GRADE AND RIT SCORE RANGEMAP Reading RIT Score as PredictorReading BenchmarkEnglish BenchmarkMAP ReadingEXPLOREPLANACTEXPLOREPLANACTRIT Range8th Grade10th Grade11th Grade8th Grade10th Grade11th %100%100%100%100%*Note: This table shows the proportion of students in the study sample who, based on a MAP reading score takenduring the same (season), met the associated college readiness benchmark. Example: an eighth grade studentscoring 220 on a MAP reading test taken during the same season would have a 27% chance of meeting theEXPLORE college readiness benchmark in reading, and about a 61% chance of meeting the EXPLORE collegereadiness benchmark in English.Updated on January 17, 2012
MAP Language Usage RIT Score as PredictorReading BenchmarkEnglish BenchmarkMAP Language UsageEXPLOREPLANACTEXPLOREPLANACTRIT Range8th Grade10th Grade11th Grade8th Grade10th Grade11th 0%100%100%100%100%*Note:This table shows the proportion of students in the study sample who, based on a MAP language usage score takenduring the same (season), met the associated college readiness benchmark. Example: an eighth grade studentscoring 220 on a MAP language usage test taken during the same season would have a 27% chance of meeting theEXPLORE college readiness benchmark in reading, and about a 64% chance of meeting the EXPLORE collegereadiness benchmark in English.Updated on January 17, 2012
MAP Mathematics RIT Score as PredictorMathematics BenchmarkMAP Mathematics EXPLOREPLANACTRIT Range8th Grade 10th Grade 11th 0%295100%100%100%300100%100%100%*Note:This table shows the proportion of students in the study sample who, based on a MAP mathematics score takenduring the same (season), met the associated college readiness benchmark. Example: an eighth grade studentscoring 240 on a MAP mathematics test taken during the same season would have a 53% chance of meeting theEXPLORE college readiness benchmark in mathematics.Updated on January 17, 2012
TABLE SET 4 – CORRELATIONS BETWEEN MAP AND COLLEGE READINESS TEST SCORES ANDREGRESSION MODEL GOODNESS OF FIT STATISTICS 4MAP Reading Test as PredictorGradeCollege Readiness TestCorrelations81011EXPLORE ReadingPLAN ReadingACT Reading0.7430.6860.779Goodnessof Fit55.2%47.0%60.7%College Readiness TestCorrelationsEXPLORE EnglishPLAN EnglishACT English.785.731.800Goodnessof Fit61.6%53.4%64.1%MAP Language Usage Test as PredictorGradeCollege Readiness TestCorrelations81011EXPLORE ReadingPLAN ReadingACT Reading.714.662.764Goodnessof Fit51.0%43.8%58.4%College Readiness TestCorrelationsEXPLORE EnglishPLAN EnglishACT English.804.745.837Goodnessof Fit64.6%55.5%70.0%MAP Mathematics Test as PredictorGrade81011College Readiness TestEXPLORE MathematicsPLAN MathematicsACT Mathematics4Correlations.825.802.870Goodness of Fit68.0%64.3%75.7%These correlations are comparable to Pearson’s r values, except that they denote the extent to which the twoscales are related by a quadratic function. Correlations range from 0 to 1, where 0 indicates no correlationbetween college readiness test scores and MAP scores, while 1 indicates a completely correlational relationshipbetween scores on the two tests. Goodness of fit statistics indicate the percentage of observed varianceaccounted for by the quadratic regression model, with 100% indicating that college readiness test scores can bepredicted with full reliability, whereas 0% indicates no predictability between the two assessments.Updated on January 17, 2012
TABLE 5 – PERCENTAGE OF STUDENTS WHOSE PASS STATUS WAS ACCURATELY PREDICTEDBY THEIR MAP PERFORMANCE USING REPORTED CUT SCORES 5MAP Reading Test as ingPLANReadingACTReadingPercentage of Sample whose College Readiness Status was Accurately Predicted by MAP ScoreSample Percentage Percentage Percentage CollegeSample Percentage PercentageSizeCorrectlyof Falseof FalseReadiness SizeCorrectlyof ACTReadingPercentage of Sample whose College Readiness Status was Accurately Predicted by MAP ScoreSample Percentage Percentage Percentage CollegeSample Percentage PercentageSizeCorrectlyof Falseof FalseReadiness SizeCorrectlyof ishPercentageof FalseNegatives10%16%13%MAP Language Usage as PredictorGrade81011Percentageof FalseNegatives9%17%14%MAP Mathematics as PredictorPercentage of Sample whose College Readiness Status was Accurately Predicted by MAP ScoreSamplePercentage CorrectlyPercentage of FalsePercentage of FalseSizePredictedPositivesNegativesGradeCollege N Mathematics951686%4%9%11ACT Mathematics294891%1%7%5Correct predictions refer to the percentage of students in the study sample whose MAP scores accuratelyindicated their college readiness status on the college readiness test. False positives indicate the percentage ofstudents predicted to be college ready, but who failed to meet the college readiness benchmark. False negativesindicate the percentage incorrectly predicted to fail to meet the college readiness benchmark, but who did.Updated on January 17, 2012
REFERENCESACT. 2010. Issues in College Readiness: What are ACT's College Readiness Benchmarks (IC 050805090).Retrieved from ACT website: marks.pdfNorthwest Evaluation Association. 2011. RIT Scale Norms. Portland, OR: Northwest EvaluationAssociation.Updated on January 17, 2012
APPENDIX 1: METHODOLOGYThis linking study examines the concurrent relationship between EXPLORE/PLAN/ACT and MAPassessments with the goal of publishing benchmarks on the RIT scale that are predictive of the ACT’scollege readiness benchmarks (ACT, 2010).Appendix Table 1 describes the three ACT assessments with their respective college readiness targets bycontent area.Appendix Table 1 – ACT College Readiness Cut PointsEXPLOREPLANACTGrade 8Grade 9Grade 10Grade 11English13141518Math17181922Reading15161721Study SampleNWEA solicited all known partner districts that administer both the EXPLORE/PLAN/ACT and MAPassessments to participate in this study. While not every eligible partner participated, the final studysample was large enough (unique total student n 29,417) to proceed with the analysis. Appendix Table2 contains the distinct sample count.Appendix Table 2 – Sample CountsTestGradeUniqueUnique DistrictUnique SchoolUnique re8355111822Plan10375413915Updated on January 17, 2012
Each district’s EXPLORE/PLAN/ACT test records were matched to their corresponding MAP data via arobust matching algorithm housed in NWEA’s Growth Research Database. The bulk of the study usedmatched students who took both assessments in same term. In the cases where students took theNWEA MAP test in different terms, we employed the following prioritized matching process.Priority 1 – MAP given in SAME term as EXPLORE/PLAN/ACTPriority 2 - MAP test given one term BEFORE EXPLORE/PLAN/ACTPriority 3 - MAP test given two terms BEFORE EXPLORE/PLAN/ACTPriority 4 - MAP test given one term AFTER EXPLORE/PLAN/ACTPriority 5 - Map test given two terms AFTER EXPLORE/PLAN/ACTIn order to ensure comparable RIT scores, we took the MAP percentile associated with the RIT score andsubstituted the RIT score associated with that percentile in the term the EXPLORE/PLAN/ACT wasadministered. For example, a winter test score under Priority 2 with a percentile of 75 would besubstituted for the corresponding spring RIT score associated with the 75th percentile. Appendix Table 3contains the distribution of unique students by the EXPLORE/PLAN/ACT test, MAP Grade and prioritizedmatching scheme.Appendix Table 3 – Prioritized Matching Count (Unique Students) by ACT Test and MAP GradeP1 - ExactPriority MatchingP2 - 1 Term P3 - 2 Terms P4 - 1 TermPriorPriorAfterTotalACT11EXPLORE/PLAN/ACTTest and REAnalysisThe goal of the analysis is to find the statistical model that best describes the scale relationship betweenEXPLORE/PLAN/ACT and the NWEA MAP assessments. We tested multiple models including OrdinaryLeast Squares Regression (Linear and Quadratic) and Hierarchical Linear Model (HLM). The best modelwas determined by correlation (r) and overall model fit.Akaike Information Criterion (AIC) is the measure of model fit we used. Generally speaking, the AICexamines the tradeoffs between model accuracy and complexity whereby the model with the lowest AICvalue is said to be the most parsimoniousUpdated on January 17, 2012
Separate linear (1a) and quadratic (1b) regression routines were run for each relationship model. (1a)where X RIT ଶ (1b)where X RITBased on the correlations and AIC fit statistics, the quadratic regression best described the shape of thescale relationship (see Appendix Table 4).Updated on January 17, 2012
TestAppendix Table 4 – Initial Model CorrelationsLinear RegressionQuadratic RegressionModelrAICrAICACTLanguage Usage to English0.7124000.772237ACTLanguage Usage to Reading0.6424500.702330ACTMath to Math0.7365490.815686ACTReading to English0.6984570.757948ACTReading to Reading0.6585130.728013PLANLanguage Usage to English0.65122640.6811813PLANLanguage Usage to Reading0.55136740.5913306PLANMath to Math0.71218740.7420855PLANReading to English0.63241020.6723299PLANReading to Reading0.57263430.6225418EXPLORELanguage Usage to English0.70251330.7523440EXPLORELanguage Usage to Reading0.59247280.6623204EXPLOREMath to Math0.76248780.7724615EXPLOREReading to English0.69296850.7328068EXPLOREReading to Reading0.62283240.6926121The next step in the analytic process was to determine whether any between-school variation existed inour scale relationships by running a simple unconstrained HLM model (2): (2) is the ACT/PLAN/EXPLORE score for student i in school j; is the grand mean (students within schools) variance in intercept between schools Updated on January 17, 2012within school variance
Appendix Table 4 contains the Intraclass Correlation Coefficient (ICC) for each test and model. The ICCmeasures the proportion of variance in the dependent variable that is accounted for by ourgrouping structure.Updated on January 17, 2012
Appendix Table 5– Intraclass Correlation Coefficients (ICC) by Test and Modelt00σ2TestModelICCACTLanguage Usage to English9.65030.1660.242ACTLanguage Usage to Reading6.49029.0350.183ACTMath to Math2.45816.3480.131ACTReading to English6.66929.7630.183ACTReading to Reading4.61028.5640.139PlanLanguage Usage to English5.47817.6510.237PlanLanguage Usage to Reading6.17519.4960.241PlanMath to Math5.38816.3030.248PlanReading to English4.73416.9440.218PlanReading to Reading4.99218.8780.209ExploreLanguage Usage to English0.97916.7930.055ExploreLanguage Usage to Reading0.64912.8780.048ExploreMath to Math0.82514.6190.053ExploreReading to English0.98016.4340.056ExploreReading to Reading0.78712.8150.058The ICCs offer a somewhat conflicting picture on the appropriateness of using a multilevel model in thecase of this study. For instance, the EXPLORE assessments have the least amount of between-groupvariance (less than six percent) and the nearly the most number grouping levels (between 29 and 51individual schools depending on the model). While no well-established ICC thresholds exist per se, itwould appear the EXPLORE would not be a good candidate when compared to the ACT and PLAN ICCs.One explanation for the observed differences could be related to the specific analytic sample used.While we could have employed two separate methods (Quadratic for EXPLORE, HLM for ACT and PLAN),Updated on January 17, 2012
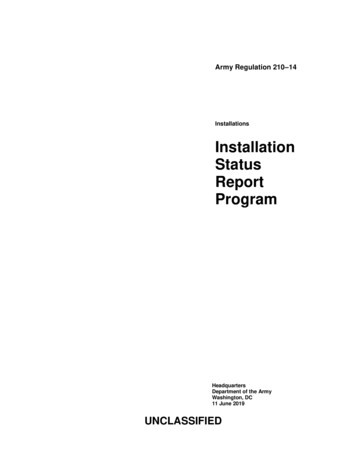
we felt the quadratic model offered transparency and consistency while maintaining good model fitcharacteristics.Figures 1 through 3 illustrate the final fitted model for EXPLORE/PLAN/ACT Math to NWEA MAP Math.Each figure contains notes referencing specific sample or estimation characteristics. Please notestandardized residuals greater than 2 or less than -2 were removed from the final model to eliminatepotential sources of statistical noise. We should also note the MAP assessment measures studentperformance relative to state content standards rather than discrete college readiness standards. Thisdifference in content alignment could possibility degrade the published regression coefficients betweenMAP and EXPLORE/PLAN/ACT.Figure 1 - ACT Math to NWEA MathThe ACT Math scatter plot and residuals exhibit pronounced curvilinear shapes. The sample also becomes sparse toward the topend of the distribution, making those estimates less reliable.Updated on January 17, 2012
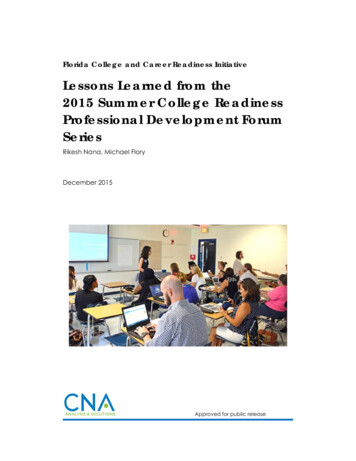
Figure 2 - PLAN Math to NWEA MathThe PLAN Math scatter plot and residuals display the same curvilinear pattern as the ACT but appears to have more variancealong the fit line. Like the ACT, the sample also becomes sparse toward the top end of the distribution, making those estimatesless reliable.Updated on January 17, 2012
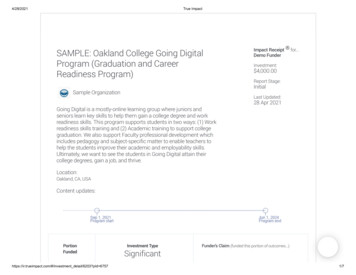
Figure 3 - EXPLORE Math to NWEA MathThe EXPLORE Math scatter plot and residuals have a slight curvilinear profile especially when compared to the ACT and PLANassessments. The EXPLORE assessment has a pronounced ceiling effect in reference to the NWEA MAP assessment, meaning theNWEA assessment has more “stretch” than EXPLORE at the eighth grade level.Updated on January 17, 2012
The objective of this study was to identify cut scores on the MAP reading, language usage, and general mathematics tests that correspond to the published college readiness benchmarks . 8 EXPLORE Math 17 245 72 10 PLAN Math 19 251 77 11 ACT Math 22 258 83 2 The MAP cut scores shown in these tables are the minimum estimated scores. Meeting the .