Transcription
Emissions Inventory for theArctic Air Quality Modeling Study2015 International Emission Inventory ConferencePresented byPaula Fields SimmsEastern Research GroupApril 15, 20151
Acknowledgements Bureau of Ocean Energy Science Review GroupManagement, Alaska OCSR– Dr. David Allen, UT– Dr. Heather Crowley– Virginia Raps– Dr. Brian Lamb, WSU– Tom Moore, WESTAR ERG Co-Authors––––– Alaska ResourcesRichard BillingsRegi OommenMike PringDarcy WilsonMarty Wolf––––– ERG Technical Team ERG ModelingSubcontractors– ENVIRON, UAF2ADECVillage CorporationsConocoPhillips, BPMarine Exchange of AlaskaBarrow and WainwrightPublic Works
Arctic Air Quality Modeling StudyTask 2Meteorological DatasetsTask 3Emissions InventoryTask 4Near-field ModelingTask 5Far-field ModelingTask 6Emission Exemption Threshold AnalysisOverall Objective: Assess potential air quality impacts from oiland gas exploration, development and production on theAlaska OCS and in near-shore state waters.3
Presentation Overview:Emissions Inventory for the Arctic AQ Study Inventory Scope Emission Sources and Methods– Baseline Inventory Results Projections Inventory Methods– Projections Inventory Results Next Steps4
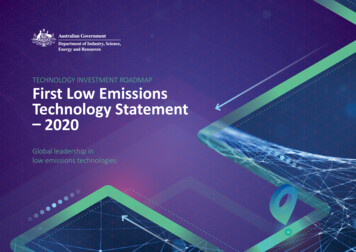
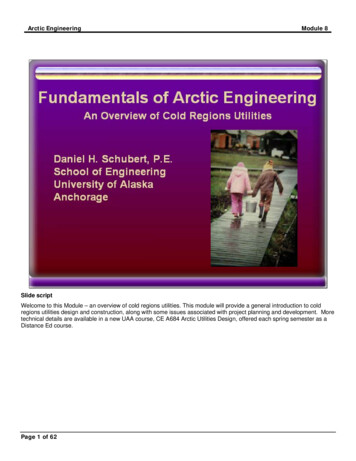
Arctic AQ Modeling Study Domain5
Emissions Inventory Scope Pollutants - CAPs, HAPs, GHGs, H2S, NH3 Domain - North Slope Borough and BOEM PlanningAreas Sources - Anthropogenic sources within the domain Annual Emissions– Baseline, generally 2011 or 2012– Projections, based on “full build out” scenario Spatial Resolution - Geographic coordinates orsurrogates6
Offshore SourcesEmission Sources Seismic survey operations Exploratory drilling Commercial marine andresearch vessels AircraftMethods & Data GHG, Regulated Emissions,and Energy use (GREET)model emission factors HAP speciation factors Derived vessel activity in kWhrs from Internet sources,Marine Exchange of Alaska FAA’s Emissions & DispersionModeling System (EDMS)7
OnshoreOil & GasEmission Sources Seismic surveys Exploratory drilling, wellcompletions Prudhoe Bay, other NorthSlope fields8Methods & Data G & G permits Drilling rig permits 2011 NEI ADEC permit data GHGRP subparts W and C forReporting Year 2012 EPA’s Nonpoint Oil and GasEmissions Estimation Tool
AirportsEmission Sources 16 designated airports Fixed wind, helicopters forcommercial and generalaviation Auxiliary Power Units (APUs) Ground Support Equipment(GSE)Methods & Data EDMS Landing and Take-off (LTO)cycle data from localsources FAA/EPA LTO data in placeof enplanement data fromlocal sources9
Trans-AlaskaPipelineSystem (TAPS)Emission SourcesPump stationsFugitivesPigging operationsPipelinereplacement, repair (On-road and aerialsurveillance) Methods & Data10 Pump stations: U.S. NEI Fugitives: Nationalproduction-basedemission factors, scaledmiles of pipeline Pigging: Methane-toMarkets guidance
Onshore Sources CombustionEmission Sources Power plants Fuel combustion Waste burning, WWT Gasoline refuelingMethods & Data 2011 NEI WebFIRE emissionfactors Fuel, waste, WWeffluent quantities:Local sources, NSBPublic Works11
Onshore Sources On-Road, NonroadEmission Sources On-road: Dalton Highway,TAPS patrols, in Prudhoe Bayoil fields Wintertime idling Nonroad: snowmobiles,ATVs, recreational marine,construction equipment Unpaved road dust12Methods & Data Emission factors fromMOVES2014, 2011 NEI(ADEC) inputs VMT for Barrow, scaled “Project Scale” modeused for idling EFs NONROAD2008a Dust: AP-42 equation,Dalton Highway siltcontent
Baseline Emissions VOCCOPM10PM2.51,81638 106249362745,734 1,235 2,886 14,002 35,644 4,77147,550 1,273 2,992 14,251 35,679 4,798SectorCO2CH4 N2OCO2eHAP H2SOffshore 139,98317 141,933181Onshore 13.6x10⁶ 8,79229 13.8x10⁶ 3904Total13.7x106 8,79336 13.9x10⁶ 408513
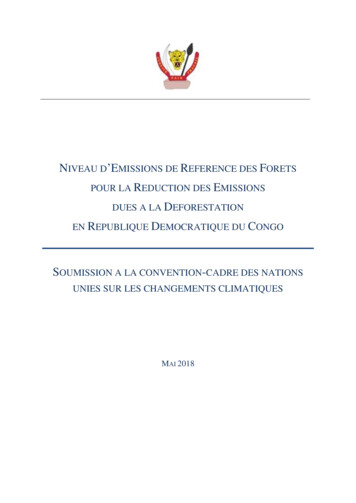
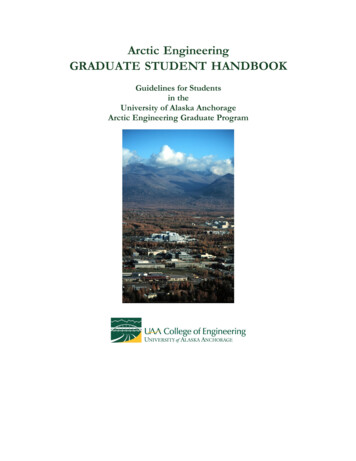
Results – Baseline Emissions InventoryNOx (tons/yr)503.2531.1471.8PM10 (tons/yr)767.01,216.698.9108.41,142.144,134.9Oil and Gas - OnshoreOil and Gas - OffshoreOther FacilitiesResearch VesselsElectricity Generating FacilitiesAll Other34,255.8Unpaved RoadsOil and Gas - Onshore14Waste Incineration, Combustion, and LandfillsAll Other
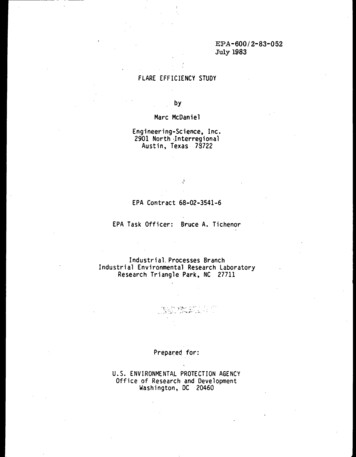
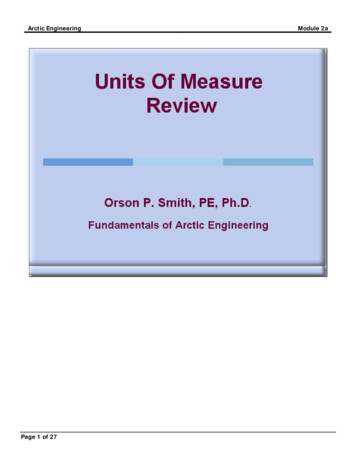
Emissions Inventory ProjectionsBOEM Full Build-Out Scenario (Potential Production)ActivityBeaufort SeaChukchi SeaProduction: Gas167 BCF/yr115 BCF/yrProduction: Oil, Condensate132 MMbbl/yr 204 MMbbl/yrNo. of Platform Wells215 Wells260 WellsNo. of Subsea Wells34 Wells90 WellsProjectedOffshoreDevelopmentAreas15
Projected Emission Changes ExpectedUnder Full Build-Out Scenario Offshore Sources Onshore Sources– Seismic surveys– Exploratory drilling– Pipelaying and supportvessels– Platform construction,operation– Spills– New oil and gasproduction facilities– New pipelineconstruction andoperation– Liberty Islandconstruction and drilling– New exploration base,air support base, searchand rescue base– Increased TAPSthroughput, air traffic– ULSD in all sources16
Emissions Inventory Projections,tons/year 36 1,330 771 3,01317,068 341 894 7,40831,504 1,671 1,665 10,421SectorCO2CH4N2OOffshore 2.8 106 125,994 424Onshore 18.4 106 26,60177Total21.2 106 152,595 50117PM10PM2.5348 294953 8791,300 1,173CO2e6.1 10619.0 10625.1 106
Next Steps in the Arctic AQModeling Study Develop spatial surrogates Develop temporal profiles Estimate biogenic and geogenic sourceemissions Conduct AQ modeling Assess emission exemption thresholds18
THANK YOU!Paula.Fields@erg.com916-635-659319
Emissions Inventory. Task 5 . Far-field Modeling. Task 4 . Near-field Modeling. Task 6 . Emission Exemption Threshold Analysis. Overall Objective: Assess potential air quality impacts from oil and gas exploration, development and produ