Transcription
Koyama et al. BMC Nephrology (2015) 16:165DOI 10.1186/s12882-015-0130-5RESEARCH ARTICLEOpen AccessOrally active prostacyclin analogue beraprostsodium in patients with chronic kidney disease:a randomized, double-blind, placebo-controlled,phase II dose finding trialAkio Koyama1*, Toshiro Fujita2, Fumitake Gejyo3, Hideki Origasa4, Masanao Isono5, Hajimu Kurumatani5,Kiyonobu Okada5, Hiroyuki Kanoh6, Takashi Kiriyama6 and Shunsuke Yamada6AbstractBackground: Evidence increasingly points to the importance of chronic hypoxia in the tubulointerstitium as a finalcommon pathway to end-stage renal disease (ESRD). Beraprost sodium (BPS) is an orally active prostacyclin (PGI2)analogue demonstrating prevention of the progression of chronic kidney disease (CKD) in various animal models bymaintaining renal blood flow and attenuating renal ischemic condition.Methods: This multicenter, randomized, double-blind, placebo-controlled, phase II trial was designed to determinethe recommended dose of the sustained-release form of BPS (TRK-100STP 120 μg/day or 240 μg/day) in Japanesepatients with CKD. TRK-100STP was administered to a total of 112 patients. The primary efficacy endpoint was thedifference in the slope of the regression line of reciprocal of serum creatinine (1/SCr) over time, obtained by theleast-squares method.Results: Regarding the primary endpoint, statistical superiority of TRK-100STP 240 μg over placebo was notconfirmed and so a recommended dose was not determined. Compared to placebo, however, the slope ofregression line of 1/SCr, elevation of SCr and serum cystatin C during the treatment period revealed greaterimprovement at 120 μg, at both doses, and at 240 μg, respectively. In terms of safety, both TRK-100STP treatmentgroups were well tolerated.Conclusions: Although the study failed to meet the primary endpoint, results indicate that TRK-100STP maypotentially prevent the decline in renal function of CKD patients independent of blood pressure or urinaryprotein levels.Trial registration: NCT02480751. June 21, 2015.Keywords: Beraprost sodium, Prostacyclin analogue, CKD, TRK-100STP, Phase II trialBackgroundAn increasing number of patients with end-stage renal disease (ESRD) require dialysis or transplantation. Althoughdiabetic nephropathy is a major reason for eventual ESRD,primary glomerular diseases and nephrosclerosis still comprise significant proportions of chronic kidney disease(CKD) patients, especially in Asian countries [1–4].* Correspondence: koyama.akio.dy@alumni.tsukuba.ac.jp1University of Tsukuba, 1-1-1 Tennodai, Tsukuba, Ibaraki 305-8577, JapanFull list of author information is available at the end of the articleAngiotensin-converting enzyme inhibitors (ACEIs) andangiotensin-II receptor blockers (ARBs) are often administered to both diabetic and non-diabetic nephropathy patients, and are established as recommended treatmentagents for non-diabetic nephropathy patients with albumin excretion [5]. However, it is evident that these agentsare insufficient for the prevention of progressive renaldisease. In addition, the use of combination therapy ofrenin-angiotensin system (RAS) inhibitors such as ACEIand ARB has demonstrated in some recent clinical trialsto be not effective [6–9]. These findings suggest an urgent 2015 Koyama et al. Open Access This article is distributed under the terms of the Creative Commons Attribution 4.0International License (http://creativecommons.org/licenses/by/4.0/), which permits unrestricted use, distribution, andreproduction in any medium, provided you give appropriate credit to the original author(s) and the source, provide a link tothe Creative Commons license, and indicate if changes were made. The Creative Commons Public Domain Dedication o/1.0/) applies to the data made available in this article, unless otherwise stated.
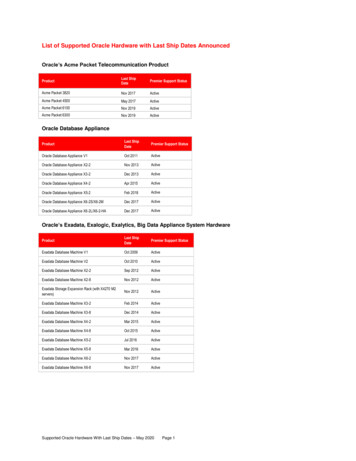
Koyama et al. BMC Nephrology (2015) 16:165clinical need for a new treatment option able to significantly delay the progression of CKD.Prostacyclin (PGI2) is primarily synthesized in endothelialcells and one of the important functions is to protect kidneys from ischemic damage in pathophysiological conditions [10], as evidenced, for example, by the developmentof renal impairment in prostacyclin synthase knockoutmice [11]. Attempts have been made to use PGI2 or its analogues in patients with kidney disease; the PGI2 analogueiloprost was successfully used for patients with contrastmedia-induced nephropathy [12].Beraprost sodium (BPS) is an orally active PGI2analogue [13] and TRK-100STP is its sustained-releaseform [14]; both were generated and developed by TorayIndustries, Inc. In Asian countries, the immediaterelease form of BPS has been widely used in the treatment of patients with chronic arterial occlusion and pulmonary arterial hypertension [15].Recent evidence increasingly points to the importanceof chronic hypoxia especially in the tubulointerstitiumas a final common pathway to the progression of CKD[16–20]. BPS prevents the progression of CKD in various animal models [21–24] by maintaining renal microvasculature and blood flow [25, 26]. In addition, it isreported that BPS is effective in Acute Kidney Injurysuch as contrast nephropathy and cisplatin nephropathy [27, 28]. These effects of BPS are thought to bebased on multiple mechanisms of actions: direct protective effect on vascular endothelial cells [29]; inhibition of the production of inflammatory cytokines frommonocyte/macrophages [23]; vasodilative [30] and antiplatelet effects [31]. The effects of BPS have also beenassessed in two studies in patients with glomerulonephritis[32, 33]. Although these studies were open-label and didFig. 1 Summary of study designPage 2 of 15not have control group, the results of one study suggestedthat BPS mitigates the progression rate of renal dysfunction [32, 33] by increasing renal blood flow withoutglomerular hyperfiltration.The efficacy of BPS on diabetic nephropathy has alsobeen reported in several clinical [34] and non-clinicalstudies [35–37]; however, several methodological limitation are evident with regards to the involvement of bothdiabetic and non-diabetic CKD patients in a single protocol. Given the evident unmet need for non-diabetic nephropathy treatment in Asia and considering that muchof the non-clinical data on BPS has been generated innon-diabetic CKD, the priority and focus of the presentstudy was on non-diabetic CKD, given that renal disordersare not modified by diabetes. This is the first randomized,placebo-controlled, double-blind, comparative trial to investigate the recommended dose at which TRK-100STPsuppresses the progression of CKD in patients with primary glomerular disease or nephrosclerosis.MethodsThis multicenter, randomized, double-blind placebocontrolled, phase II trial was designed to determine therecommended dose of TRK-100STP (i.e., either 120 μg/dayor 240 μg/day) for suppressing progression in Japanesepatients with primary glomerular disease or nephrosclerosis. The study was approved by each participating center’slocal Research Ethics Committee. Only patients withwritten informed consent were included (Please refer tothe list of participating centers at the end of the paper).Study designA summary of the study method is presented in Fig. 1.After the run-in period, when placebo tablets were orally
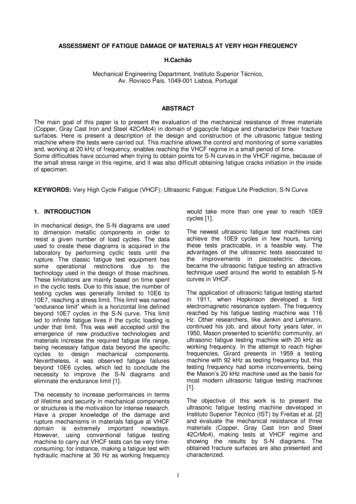
Koyama et al. BMC Nephrology (2015) 16:165Fig. 2 Inclusion and exclusion cliteriaPage 3 of 15
Koyama et al. BMC Nephrology (2015) 16:165administered twice daily for 22 weeks in a single-blindedmanner, patients who met all of the inclusion criteria andnone of the exclusion criteria (detailed in Fig. 2) wererandomized into one of the three treatment groups (TRK100STP 120 μg, 240 μg or placebo group) using computerrandom number generator to select random permutedblocks. Central randomization was performed by externalstatistician for the 28-week treatment period in a doubleblinded manner. Enrollment to the trial was restricted topatients whose renal function had progressively declinedduring the 22-week run-in period (R0 R20) to obtainadequate treatment response data during the 28-weektreatment period (W0 W28).Reciprocal of serum creatinine (1/SCr) versus time slopeshows the speed of renal function decline so that thisparameter is used to estimate how long it will take to startdialysis and to evaluate therapeutic effects [38]. This parameter is used for example to show the status of nephropathy in the RENAAL trial [39].Therefore, in order to limit the participants to thosewith progressive diseases, only patients whose reciprocal of serum creatinine (1/SCr) versus time slopewas 0.005 dL/mg over 4 weeks during the run-inperiod were randomized. This value was based on thepatients’ background in a trial of orally administeredspherical carbon adsorbent AST-120 [40]. The primaryendpoint was also 1/SCr versus time slope and the differences between the treatment- and the observation-periodvalues were evaluated.The study drug in the treatment period was orallyadministered twice daily, after meals, for 28 weeks in adouble-blinded manner. The first 2 weeks of the treatment period were designated as the dose-titrationperiod with respect to safety analyses. The initial dosefor the TRK-100STP groups was 120 μg/day. For the240 μg group, the dose was increased to 240 μg/dayafter the 2-week dose-titration period. One follow-upPage 4 of 15assessment was performed between 7 to 35 days aftercompletion or discontinuation of study drug during thetreatment period.The two doses of TRK-100STP (120 μg/day and240 μg/day) were selected for this trial on the basis thata 30 μg single dose was considered unable to achievethe effective plasma concentration, whilst a 180 μgsingle dose previously resulted in a higher incidence ofheadache and other adverse drug reactions (ADRs) in acompleted phase I clinical study of TRK-100STP. Basedon these observations, TRK-100STP at 60 to 120 μgb.i.d. (i.e., 120 to 240 μg/day) were selected for investigation in the present trial.Study endpointsThe primary efficacy endpoint was the difference betweenthe run-in and treatment periods in the slope of the regression line of 1/SCr versus time, which was calculatedby the least-squares method. All SCr data collected inthe run-in period (R0 R20) and the treatment period(W4 W28) were used for the plot in order to excludethe possible effect of the titration period (W0 W2).Secondary endpoints were as follows: 1) The differencebetween the run-in period (R0 R20) and treatmentperiod (W0 W28) in 1/SCr versus time slope; 2) changesin creatinine clearance (CCr, Cockcroft-Gault equation);3) changes in CCr (urinalysis with 24-hour pooled urine);4) changes in urinary protein excretion; 5) ratio of SCr;and 6) changes in serum cystatin C. Safety endpoints wereas follows: 1) adverse events (AEs); 2) clinical laboratorytests; 3) vital signs and body weight; and 4) 12-lead electrocardiogram (ECG).Prohibited and restricted concomitant medicationsProhibited concomitant medicationsUse of the following medications were prohibited duringthe study period: spherical carbon adsorbent; prostaglandinTable 1 Study measurementsExamination by investigatorObjective symptoms (patient interview)Physical examinationBody weight, blood pressure, pulse rate, 12-lead ECGHematological examinationWBC, RBC, Hb, Ht, PLT,Differential count of leukocytes (basophil, eosinophil, neutrophil, lymphocyte, monocyte)Bleeding and coagulation testBlood biochemistryPT, APTTTP, Alb, T-BIL, AST(GOT), ALT(GPT), ALP, LDH, γ-GTP,TCh, TG, UA, BUN, serum creatinine (SCr), Na, K, Cl, Ca, P, HbA1c, cystatin C,High-sensitive CRPUremia toxins test in plasmaGuanidino succinateUrinalysis (occasional urine)pH, qualitative protein, glucose, and urobilinogen, occult blood reaction urinary sediment (RBC, WBC, casts),β2 microglobulin (adjusted by creatinine), pregnancy test (hCG)Urinalysis (24-hour pooled urine)Urinary protein excretion, CCr, urea nitrogen, electrolytes (Na, Cl), urine output, creatinine
Koyama et al. BMC Nephrology (2015) 16:165Fig. 3 (See legend on next page.)Page 5 of 15
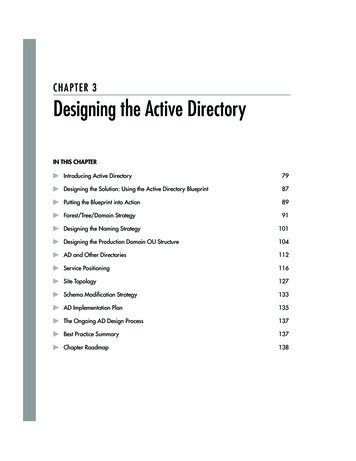
Koyama et al. BMC Nephrology (2015) 16:165Page 6 of 15(See figure on previous page.)Fig. 3 Patient dispositiona. aCONSORT 2010 flow diagram was provided as Additional file 1. * The number of the patients who were excludedduring the Run-in period (n 279) was calculated by adding the number of the patients who dropped out during the Run-in period (n 278)and the patient who was excluded before the initiation of the study treatment (n 1). ** Ten patients whose SCr values measured less thanthree points after Week 4 of the Treatment period were excluded from 112 patients randomized. As a results, 102 patients (32 patients in the 120μg group, 36 patients in the 240 μg group and 34 patients in the placebo group) were included in the full analysis set (FAS). *** If there weremultiple reasons for discontinuation, the main reason was used for calculationanalogues, other than eye drops and those in ointmentform; antiplatelet agents, with the exception of aspirinproducts; anticoagulant and thrombolytic agents, exceptfor temporary use such as for examinations; fluorinatedpyrimidine antifungal agents; and iodinated radiocontrastagents.Restricted concomitant medicationsDosage of ACEIs and ARBs were stipulated to be fixedduring the study period. However, in necessary situations, such as increased serum potassium levels that didnot improve with alternative options, a reduction inACEI or ARB doses was allowed. Taking nonsteroidalanti-inflammatory drugs (NSAIDs) continuously for morethan one week was prohibited.over 4 weeks). Based on this value, we hypothesizedthat the TRK-100STP 120 μg group would show efficacy similar to the AST-120 group, and that the TRK100STP 240 μg group would show 1.5 times betterefficacy than the AST-120 group. According to thesepredictions, we set contrast coefficients [ 1, 0, 1] forthe placebo, the TRK-100STP 120 μg, and the 240 μggroups. The number of patients required per group wasestimated to be 71 (with a two-sided 5 % significancelevel and 80 % statistical power). On this basis, the target number of patients needed to recruit was set at 430patients, taking into account the possibility that the patient withdrawal rate in the run-in period might be highbecause of the long run-in period.Sample size estimationStatistical analysisThe sample size estimation was based on a previousstudy, a Phase III clinical trial of AST-120 (indicatedfor the treatment of chronic renal failure (CRF) inJapan), conducted in a total of 237 patients (119 patients treated with the active drug and 118 received placebo) for 24 weeks [40]. The study showed that thedifference in the slope of regression line of 1/SCr versus time of AST-120 and the placebo groups before andafter treatment with the test drug was 0.00352 (dL/mg(a) Primary endpointUsing all SCr data collected during the run-in period(R0 R20) and treatment period (W4 W28), reciprocal SCr values plotted against time were analyzed. Theslopes of the regression line were calculated by applyingthe least-squares equation. The difference in the slopesbetween the run-in period (R0 R20) and treatmentperiod (W4 W28) was evaluated as the primary endpoint. In order to determine the recommended dose,Table 2 Baseline characteristics of patients in the full analysis set (FAS)ParameterTreatment groupPlaceboSex120 μg240 μg(n 34)(n 32)(n 36)Male18 (52.9 %)17 (53.1 %)24 (66.7 %)Female16 (47.1 %)15 (46.9 %)12 (33.3 %)AgeMean SD (years)59.9 10.056.5 14.757.8 13.9Primary diseasePrimary glomerular disease28 (82.4 %)27 (84.4 %)25 (69.4 %)Nephrosclerosis6 (17.6 %)5 (15.6 %)11 (30.6 %)Mean SD (dL/mg over 4 weeks) 0.01210 0.00497 0.01535 0.00808 0.01198 0.007881/SCr time slope during the run-in periodSCraMean SD (mg/dL)2.377 0.6652.251 0.6182.564 0.705Urinary protein excretionaMean SD (mg/day)2103.7 1523.02037.5 1763.41753.9 1396.2Systolic blood pressureaMean SD (mmHg)122.7 16.1129.0 13.3129.4 15.6Diastolic blood pressureaMean SD (mmHg)72.5 11.073.4 10.375.1 10.6Concomitant medicationACEI ( )13 (38.2 %)9 (28.1 %)12 (33.3 %)ACEI/ARB positiveARB ( )25 (73.5 %)26 (81.3 %)25 (69.4 %)aAs of R20
Koyama et al. BMC Nephrology (2015) 16:165Page 7 of 15Fig. 4 Change in SCr during study period (SCr values of each group at R20 [Week 20 of the run-in period] were set as 100 %)the primary endpoint was analyzed by the followingprocedures: Step 1: Analysis of covariance (ANCOVA) with theslopes calculated from the results obtained duringthe run-in period as a covariate after assigningcontrast coefficients [ 1, 0, 1]. Step 2: ANCOVA with the slopes obtained fromthe results collected during the run-in period as acovariate after assigning contrast coefficient [ 1, 1, 0],only when a statistical significance was detected inStep 1.(b) Secondary endpointsAnalytical methods for secondary endpoints are described in each result.(c) Post hoc analysisRatio of SCr (the final evaluation point/W0)In analyzing the ratio of SCr for the secondary endpoint,the SCr values measured at R20 were chosen as baselineas other parameters such as CCr, urinary protein andcystatin C were measured only at R20. Regarding SCr,however, as the value at W0 measured just before thetreatment period was available, the ratio of SCr (the finalevaluation point/W0) was assessed by ANCOVA with theSCr (R20) as covariate.Change in serum cystatin C in the treatment period(final evaluation point - R20)As the ratio of SCr was analyzed only for the treatmentperiod, changes in cystatin C were re-evaluated based onlyon data from the treatment period.Changes in cystatin C were calculated using valuestaken at R20 as the baseline (the final evaluation point –R20). ANCOVA was performed with the SCr (R20) as thecovariate. As the values at W0 were not available, thevalues at R20, the examination point of the study closestto W0, were used as baseline.Ratio of eGFR (the final evaluation point/W0)Ratio of eGFR (the final evaluation point/W0) wasassessed by ANCOVA with the SCr (R20) as covariate.In order to calculate the eGFR for Japanese patients,the following equation was used;GFR(male) 194*Scr-1.094*age-0.287, and GFR(female) GFR(male)*0.739 [41].Study measurementsThe parameters that were measured and analyzed arelisted in Table 1.Table 3 Summary statistics of primary endpoint (the difference in the 1/SCr versus time slope between run-in period [R0 R20] andtreatment period [W4 W28])Treatment groupNo. of patients1/SCr versus time slope (dL/mg over 4 weeks)Run-in period (R0 R20)Placebo34Difference in the 1/SCr versustime slope (dL/mg over 4 weeks)Treatment period (W4 W28)MeanSDMeanSDMeanSD 0.01210.00497 0.00740.009350.00470.01087120 μg32 0.01540.00808 0.00400.013450.01130.01011240 μg36 0.01200.00788 0.00450.007500.00750.00953
Koyama et al. BMC Nephrology (2015) 16:165Page 8 of 15Fig. 5 Primary endpoint: Least square mean of the change in the 1/SCr time slopefailure progressed at a slower rate during the run-inperiod, represented by a 1/SCr versus time slope of 0.005 dL/mg over 4 weeks.Trial registrationNCT02480751. June 21, 2015.ResultsPatient dispositionThe trial began on October 24, 2005 (the date the firstconsent was obtained) and was completed on May 20,2008 (the last follow-up date of the final patient).A summary of the patient disposition is described inFig. 3. Written informed consents were obtained from atotal of 431 patients, 11 of whom did not meet the criteriaon pre-registration and a total of 420 patients were preregistered. Of these 420 patients, 29 dropped out beforethe start of the run-in period and a further 278 patientswere withdrawn during the run-in period or at the registration. A total of 113 patients were therefore registered,of which one patient, who mistakenly took the run-inperiod medication and did not take the study drug for thetreatment period after the registration, was excluded fromthe study. As a result, the study drugs were administeredto a final total of 112 patients (35 patients in the placebogroup, 36 patients in the 120 μg group and 41 patients inthe 240 μg group) in a double-blind manner. Most of 238patients who did not meet the inclusion/exclusion criteriabefore registration were excluded because their renalAnalysis setsTen patients whose SCr values measured less than threepoints after Week 4 of the treatment period were excludedfrom 112 patients randomized. As a result, 102 patients(34 patients in the placebo group, 32 patients in the120 μg group and 36 patients in the 240 μg group) wereincluded in the full analysis set (FAS). From FAS, fourpatients were excluded whose SCr values measured afterWeek 4 of the treatment period were less than 5 points.The remaining patients constituted the per protocol set(PPS). PPS therefore consisted of 98 patients (34 patientsin the placebo group, 29 patients in the 120 μg group and35 patients in the 240 μg group). The safety analysis setconsisted of 112 patients (35 patients in the placebogroup, 36 patients in the 120 μg group and 41 patients inthe 240 μg group), who received the study drug for thetreatment period.Demographic and other baseline characteristics of patients in the FAS are presented in Table 2. Baseline characteristics of patients were not significantly differentTable 4 Difference in the 1/SCr versus time slope between run-in period (R0 R20), and Treatment period (W4 W28) analyzed bythe ANCOVA model: comparison of the TRK-100STP groups versus placeboTreatment groupNo. of patientsLeast square mean of the change inthe 1/SCr slopeDifference in the least square mean(versus placebo)aContrast testPoint estimate95 % CIPoint estimate95 % CI( 1,0,1)Placebo340.00516[0.00187, 0.00845]――120 μg320.01026[0.00682, 0.01369]0.00510[0.00031, 0.00989]240 μg360.00798[0.00478, 0.01118]0.00282[ 0.00175, 0.00740](120 μg group or 240 μg group) – (placebo group)1/Scr versus time slope during the run-in period as the covariatea(P value)0.2234
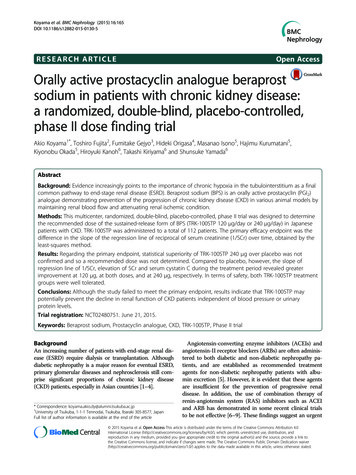
Koyama et al. BMC Nephrology (2015) 16:165Page 9 of 15Table 5 Ratio of SCr [the final evaluation pointa/W0 (week 0 ofthe treatment period)] analyzed by the ANCOVA modelTreatmentgroupNumberofpatientsLeast square mean Difference in theP-value*of the ratio of SCr least square mean(versus 690.032 ––120 μg321.0690.033 0.1000.045 0.0309–240 μg361.0640.031 0.1050.044 0.0204aAt Week 28 of the treatment period or when treatment was discontinued*ANCOVA with baseline (SCr(R20)) as covariateamong the treatment groups. It is noteworthy that 69 % to81 % of patients were taking ARB in each group.Changes in SCrFigure 4 illustrates the changes in SCr through the studyperiods when SCr values of each group at R20 were setat 100 %. The SCr values in all three groups increasedduring the run-in and treatment periods, and increasesin SCr values in the treatment period tends to be suppressed in the two TRK-100STP groups.EfficacyAs the primary analysis set is also the FAS, the data andthe results of evaluation are described based on the FAS,whilst the efficacy analysis was performed in both theFAS and PPS.(a) Primary endpointThe difference in the 1/SCr versus time slope betweenthe run-in period (R0 R20) and the treatment period(W4 W28)As shown in Table 3 and Fig. 5, compared with therun-in period, a slight improvement in the 1/SCr versustime slope was observed during the treatment period inall treatment groups; this tendency was clearly observedin patients of the TRK-100STP 120 μg group.Table 4 shows the result of ANCOVA with the 1/SCrversus time slope during the run-in period as the covariate. No statistically significant difference was observedbetween the 240 μg group and the placebo group whenthe ANCOVA was performed with the contrast coefficients of [ 1, 0, 1] for [the placebo group, the 120 μggroup, and the 240 μg group] (P 0.2234).(b) Secondary endpointsThe difference in the 1/SCr versus time slope betweenthe run-in period (R0 R20) and the treatment period(W0 W28)The least square mean of the difference in the 1/SCrversus time slope [95 % CI] was 0.00590 dL/mg over 4weeks [0.00308, 0.00873] in the placebo group, 0.01065 dL/mg over 4 weeks [0.00769, 0.01360] in the TRK-100STP120 μg group and 0.00801 dL/mg over 4 weeks [0.00525,0.01076] in the 240 μg group. Moreover, ANCOVA wasperformed on the same model as the primary endpoint withthe contrast coefficients of [ 1, 0, 1], [ 1, 1, 0], [ 1, 1, 2],and [ 2, 1, 1] for the placebo group, the 120 μg group,and the 240 μg group, respectively. The results ofANCOVA with contrast coefficients of [ 1, 0, 1], [ 1, 1, 0],[ 1, 1, 2] and [ 2, 1, 1] were P 0.2912, P 0.0244,P 0.8764 and P 0.0534, respectively. Thus the 120 μgFig. 6 Mean SD of ratio of SCr (final evaluation point/W0 [week 0 of the treatment period]): As shown in Table 5, both the 120 μg and the240 μg groups showed an inhibition of the increase in SCr ratios as compared with the placebo group (P 0.0309, 0.0204, respectively), assessedby ANCOVA with the SCr (R20) as covariate
Koyama et al. BMC Nephrology (2015) 16:165Page 10 of 15Table 6 Changes in serum cystatin C [the final evaluationpointa-R20 (week 20 of the Run-in period)] comparison ofTRK-100STP groups versus placebo analyzed by the ANCOVAmodelTreatmentgroupNumber Least square meanofof the differencepatientsb in serum cystatin C(mg/L)PointestimateSEDifference in theleast square mean(versus 0.065 ――120 μg310.0970.066 0.1570.092 0.0928―240 μg350.0520.063 0.2010.090 0.0285aAt Week 28 of the treatment period or when treatment was discontinuedbDifferent from FAS because some patients lacked value of cystatin Cgroup showed a significant amelioration compared with theplacebo group (contrast coefficients: [ 1, 1, 0]: P 0.0244).Changes in CCrThe difference in the change of CCr in urinalysis with24-hour pooled urine sample (the change in the treatmentperiod [the final evaluation point – R20]) was 1.08 9.35 mL/min in the placebo group (mean SD), 6.16 11.22 mL/min in the TRK-100STP 120 μg group and3.94 7.80 mL/min in the 240 μg group. Both TRK100STP groups therefore showed a tendency of inhibiting the decline in CCr as compared with the placebogroup (P 0.0551, P 0.1800: t-test). When CCr was calculated with the Cockcroft-Gault equation, the change inthe treatment period (the final evaluation point – R20)was 2.03 5.98 mL/min in the placebo group (mean SD), 3.93 5.30 mL/min in the TRK-100STP 120 μg groupand 3.77 5.06 mL/min in the 240 μg group. Both TRK-100STP groups therefore showed a tendency of inhibitingthe decline in CCr as compared with the placebo group(P 0.1771, P 0.1917: t-test).Changes in urinary protein excretionThe change in urinary protein excretion (the finalevaluation point – R20) was 121.59 715.60 mg/day inthe placebo group, 241.68 849.23 mg/day in the TRK100STP 120 μg group and 280.38 817.97 mg/day in240 μg group. It was shown that the observed change inthe urinary protein excretion in the 120 μg and 240 μggroups (versus the placebo group) was small relative tothe standard deviation, and both TRK-100STP groupsshowed no significant difference compared to the placebogroup (P 0.5457, P 0.4056: t-test).Ratio of SCrThe ratio of SCr (the final evaluation point/R20) was1.14 0.27 in the placebo group, 1.06 0.20 in the TRK100STP 120 μg group and 1.06 0.13 in the 240 μggroup. Although both TRK-100STP groups did not showany significant inhibition, they showed a tendency ofinhibiting the increase in SCr as compared with theplacebo group (P 0.1379, P 0.0942: t-test).Changes in serum cystatin CThe difference in the change in serum cystatin C (thechange in the treatment period [the final evaluationpoint – R20] – the change in the Run-in period [R20 –R0]) was 0.155 0.448 mg/L in the placebo group,0.006 0.377 mg/L in the TRK-100STP 120 μg group,and 0.023 0.645 mg/L in the 240 μg group. BothTRK-100STP groups therefore showed a tendency ofinhibiting the increase in serum cystatin C as comparedversus the placebo group (P 0.1588, P 0.1973: t-test).Fig. 7 Mean SD of changes in serum cystatin C (final evaluation point – R20): As shown in Table 6, the 120 μg group showed a tendency andthe 240 μg group showed significant inhibition of the increase in change in serum cystatin C as compared with the placebo group (P 0.0928,0.0285, respectively), assessed by ANCOVA with the SCr (R20) as covariate
Koyama et al. BMC Nephrology (2015) 16:165Page 11 of 15Table 7 Change in eGFR [the final evaluation pointa/W0 (week0 of the treatment period)] analyzed by the ANCOVA modelTreatmentgroupNumberofpatientsLeast square meanof the difference inserum cystatin C(mg/L)Difference in theleast square mean(versus EPlacebo340.8770.025 ―――120 μg320.9520.026 0.0750.036 0.0365240 μg360.9420.024 0.0650.035 0.0628aAt Week 28 of the treatment period or when treatment was discontinued(c) Post hoc analysisRatio of SCr (final evaluation point/W0)As shown in Table 5 and Fig. 6, both the 120 μg andthe 240 μg groups showed a significant inhibition of theincrease in SCr ratios as compared with the placebogroup.Change in serum cystatin C in treatment period (finalevaluation point – R20)As shown in Table 6 and Fig. 7, the 120 μg groupshowed a tendency and the 240 μg groups showed significant inhibition of the increase in change in serum cystatinC as compared with the placebo group.Ratio of eGFRAs shown in Table 7, the 240 μg group showed a tendencyand the 120 μg groups showed significant inhibition of thedecrease in eGFR ratios as compared with the placebogroup.Safety and tolerabilityThe safety analysis was conducted based on any AEs reported during the study period. The incidence of AEs aresummarized in Table 8. Two death were observed in thisstudy; they oc
placebo-controlled, double-blind, comparative trial to in-vestigate the recommended dose at which TRK-100STP suppresses the progression of CKD in patients with pri-mary glomerular disease or nephrosclerosis. Methods This multicenter, randomized, double-blind placebo-controlled, phase II trial was designed to determine the