Transcription
Baseline Emissions Inventory and Future Year Projectionsfor the Arctic Air Quality Modeling StudyPaula Fields Simms and Marty WolfEastern Research Group, Inc.8950 Cal Center Drive, Suite 325, Sacramento, CA 95826paula.fields@erg.comMike Pring, Richard Billings, Regi Oommen, and Darcy WilsonEastern Research Group, Inc.1600 Perimeter Park Drive, Suite 200, Morrisville, NC 27560Dr. Heather Crowley and Virginia RapsU.S. Department of the InteriorBureau of Ocean Energy Management, Alaska OCS Region3801 Centerpoint Drive, Suite 500Anchorage, AK 99503heather.crowley@boem.govABSTRACTThe Bureau of Ocean Energy Management (BOEM) is assessing air quality impacts fromoffshore oil and gas exploration, development and production on the Alaska Outer Continental Shelf(OCS), as well as those in near-shore state waters, and related onshore activities. For this assessment,BOEM is sponsoring the Arctic Air Quality Impact Assessment Modeling Study, including developing abottom-up emissions inventory of impacting sources located on the North Slope of Alaska, evaluatingdetailed meteorological data sets, and conducting far- and near-field photochemical and atmosphericdispersion modeling.This paper provides details on the development of the baseline and projected emissionsinventories for use in air quality modeling. Emissions of criteria air pollutants, greenhouse gases, andhazardous air pollutants from offshore and onshore oil/gas production, stationary sources located inNorth Slope communities, onroad motor vehicles, nonroad equipment, marine vessels and airports wereestimated. Emissions that could reasonably be expected to occur in the future were also estimated, basedon potential future levels of increased oil and gas production activities to be conducted on the NorthSlope. Results were vetted through BOEM and a Science Review Group to ensure emissions wereestimated according to the established protocol. Results showed that the majority of criteria airpollutants and greenhouse gases are emitted by onshore oil and gas production sources in both thebaseline and projected emissions inventories.GIS data sets, including spatial surrogates, as well as temporal profiles are currently beingdeveloped to allocate emissions spatially and temporally for use in the air quality photochemical andatmospheric dispersion models.INTRODUCTIONThe Department of the Interior, Bureau of Ocean Energy Management (BOEM), Alaska OuterContinental Shelf Regional Office (AOCSR) in Anchorage, Alaska, is responsible for management ofoil and gas exploration, development, and production activities on the Alaska Outer Continental Shelf(OCS) under the OCS Lands Act and for assessing the potential environmental impacts from theseactivities as required by the National Environmental Policy Act (NEPA). In addition, AOCSR is1
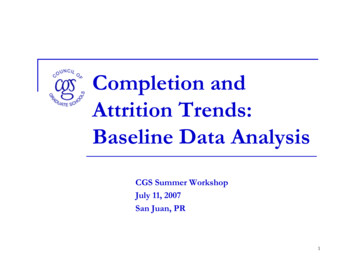
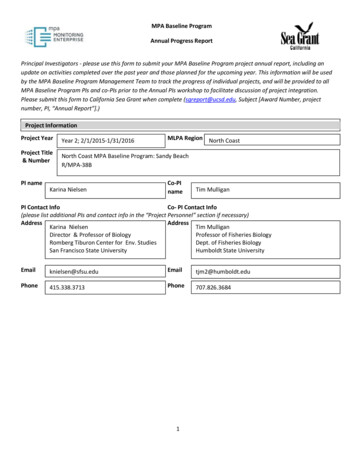
responsible for regulating air emission sources from activities related to offshore oil and gas exploration,development and production within the Chukchi Sea and Beaufort Sea OCS Planning Areas adjacent tothe North Slope Borough (NSB) of Alaska.To assist BOEM with assessing potential air quality impacts from oil and gas exploration,development, and production on the Alaska OCS as well as in near-shore state waters (within 3 nauticalmiles of the coast), and related onshore activities, BOEM is sponsoring the Arctic Air Quality ImpactAssessment Modeling Study (Arctic AQ Modeling Study). The study will inform two importantprocesses: National Environmental Policy Act (NEPA) Environmental Impact Air QualityAssessments. To date, much of the emissions and meteorological data developed for the Arcticregion are project specific. The Arctic AQ Modeling Study will provide a comprehensive airquality analysis with a comprehensive emissions inventory, consistent meteorological dataset,and air dispersion analysis to support environmental impact assessments under NEPA. Emission Exemption Threshold Evaluation. The Arctic AQ Modeling Study will evaluatecurrent methods for estimating thresholds used to assess the potential adverse effects thatoffshore oil and gas activities might have on onshore air quality, and recommend improvements,if necessary.In addition, the Arctic AQ Modeling Study will provide improved and consolidated information aboutthe emission sources in the study area, disseminate that information to the public, and inform severalenvironmental justice initiatives.One of the first steps in the Arctic AQ Modeling Study, and in support of subsequent air qualitymodeling analyses, was to develop a comprehensive air emissions inventory that accurately estimatesemissions within the study area that encompasses the North Slope region and adjacent waters of theBeaufort Sea and Chukchi Sea Planning Areas (see Figure 1). This emissions inventory is the basis forthe information presented in this paper.1The scope of the emissions inventory was defined as follows: Baseline – the year for which the most recent, credible, reliable information was available. Tothe greatest extent possible, 2012 data were used, but these were sometimes augmented with datafrom other years (including 2011 and 2013). Future scenario – future year sources and activities that are reasonably foreseeable andexpected to continue for an extended period of time. Projected (future year) emissions wereestimated for use in evaluating impacts anticipated from potential future oil and gas exploration,development, and production activities on the Arctic OCS. ERG projected future emissionsbased on information and guidance provided by BOEM for a year in the future when projectedoffshore operations are “fully built out” (BOEM, 2014a). ERG estimated annual emissions (i.e.,baseline and future emissions), and developed temporal profiles for use in air quality modeling. Pollutants – the air pollutants that contribute to air quality, health and visibility concerns,including: criteria air pollutants (CAPs) and precursors; hazardous air pollutants (HAPs, asdefined by the Clean Air Act, Title III); greenhouse gases (GHGs, including carbon dioxide[CO2], methane [CH4]), nitrous oxide [N2O], sulfur hexafluoride [SF6], hydrofluorocarbons[HFCs], and perfluorocarbons [PFCs]); hydrogen sulfide (H2S); and ammonia (NH3).2
Figure 1. Regional Map Depicting OCS Planning Areas, including location of Arctic Air QualityModeling Study (Currently leased areas are indicated in green.) Data Source: Reference 2 Sources – the sources operating within the inventory domain, including stationary sourceslocated in North Slope communities and oil fields, onroad motor vehicles, nonroad equipment,marine vessels and other offshore (oil- and gas-related) sources (i.e., both OCS and near shore instate waters), the Trans Alaska Pipeline System (TAPS) and airports. Also, emissions from othersources were estimated based on their potential influence on air quality concentrations, includingdust from paved and unpaved portions of the Dalton Highway and other roads located incommunities and the oil fields. Table 1 lists the source groups and categories included in theArctic AQ Modeling Study emissions inventory and the associated air pollutants. Note thatemissions from biogenic sources (e.g., NOx from soils; geogenic sources such as oil seeps andwildfires) will be estimated in a future stage in this study. Domain – the geographic area in which the emission sources reside. For the Arctic AQModeling Study emissions inventory, the domain encompasses the Arctic OCS, including theChukchi and Beaufort Seas, near shore state waters (within 3 nautical miles of the coast), and theNSB.3
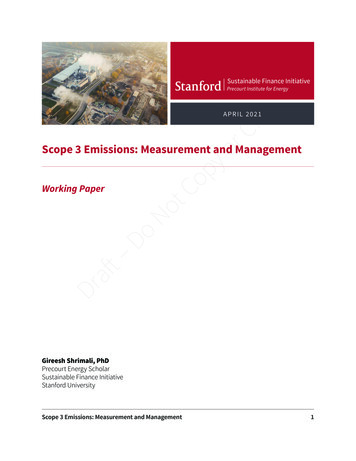
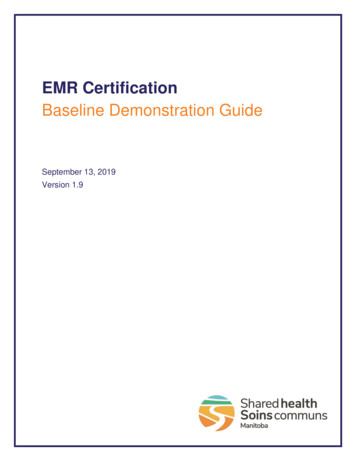
Table 1. Sources included in the BOEM Arctic AQ Modeling Study Emissions Inventory.Group and CategorySeismic survey and supply vesselsSeismic support helicoptersOn-ice seismic survey equipmentExploratory drilling – drill ships, jackupsOffshore Oil Exploratory drilling – fleet support vesselsPlatform construction and support vessels& GasActivitiesIsland construction and support vesselsProduction platform operationPlatform support – supply and support vesselsPlatform support – helicoptersPipelaying and support vesselsCommercial marine vesselsOffshore OtherResearch vesselsSeismic survey equipmentOnshore Oil & Drilling/explorationWell padsGasFieldsProcessing plants, gathering centers, etc.Support (injection, seawater treatment)Aircraft and helicoptersAirportsGround support equipmentPump stations (1-4)On-road patrol vehiclesTransAlaska Aerial surveillance aircraftTAPS fugitivesPipelineSystemNatural gas supply line fugitivesPigging operationsPipeline replacement, repairPower ialfuel combustionOn-road motor vehiclesNonroad mobile sourcesOnshore NonRoad dustOil & GasWaste burningActivitiesWastewater treatmentFuel dispensingPower ialfuel combustionOCS pipeline spillsSpillsPlatform spills4CAPs HAPs GHGs H2 SNH3
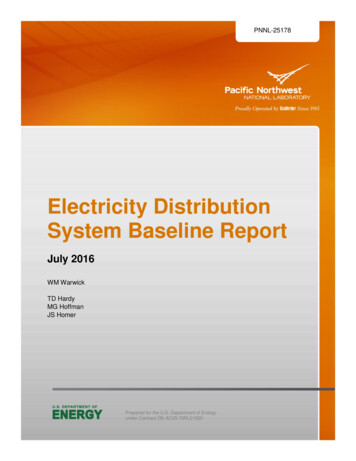
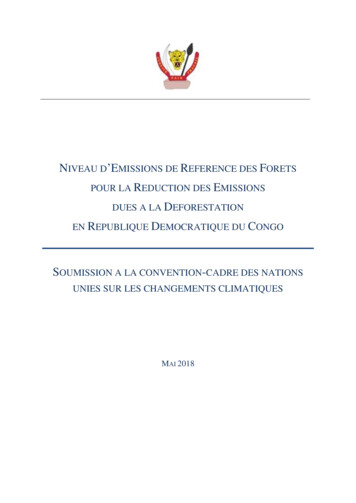
METHOD – BASELINE EMISSIONS INVENTORYThe baseline emissions inventory represents air emissions from the sources operating in theArctic OCS, including the Chukchi and Beaufort Seas, near shore state waters (within 3 nautical miles ofthe coast), and the NSB, over the course of a year. The baseline emissions inventory generally wasdeveloped using data from 2012, however because it was necessary to use data from other years in orderto compile a comprehensive inventory, the initial annual inventory is also referred to as the “baseline”emissions inventory.Offshore SourcesOffshore activities during 2012 included oil and gas seismic surveys, exploratory drilling, andsupport helicopters visiting survey vessels and exploratory drilling rigs to deliver supplies and transferpersonnel. Also, commercial marine and research vessels operated in the Beaufort and Chukchi Seasduring this time, although these were not directly related to oil and gas exploration. The method used toestimate vessel emissions was to apply activity data to appropriate Greenhouse gases, RegulatedEmissions, and Energy use in Transportation (GREET) model marine vessel emission factors3 and HAPspeciation profiles.4 For estimating helicopter and aircraft landing and takeoff (LTO) emissions, ERGused the Federal Aviation Administration’s (FAA’s) Emissions and Dispersion Modeling Systems(EDMS).5 The activity data used to estimate emissions is described in detail below.Seismic Survey OperationsSeismic surveys are used in the Arctic to evaluate the possible locations of oil-bearing strata(seismic survey), assess geologic risk to constructed structures (geohazard surveys), and provide seabeddata for platform design and construction (geotechnical surveys). Only seismic survey vessels areincluded in the baseline emissions inventory, while all three types are included in the projectedinventory. Most types of survey vessels are equipped with an air gun that generates a sound wave thatreflects off the seabed and is picked up by an array of acoustic receivers (hydrophones) that are pulledbehind the vessel (Figure 2).6 Results from the seismic soundings are mapped to identify densityanomalies in the geologic strata that could suggest the existence of oil and possible sites for exploratorydrilling.Figure 2. Typical seismic survey.Online image from PG&E: How the 3D High-Energy Survey Works. Used by Permission.5
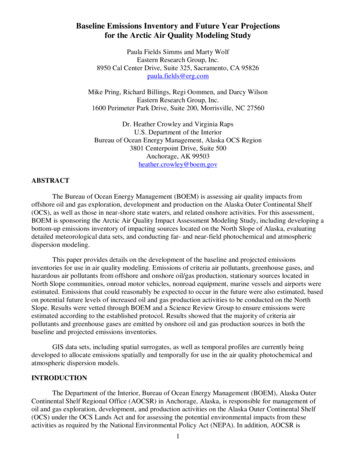
The survey vessel emissions inventory includes estimates for associated support vessels. Supportvessels are ice breakers and scout vessels. Ice breakers travel ahead of the seismic survey vessel to breakup ice along the route. Scout vessels are smaller vessels, and travel ahead of the seismic survey vessel towarn of ice coverage or location of sea life, mainly whales.Survey vessel activity was defined in terms of kilowatt hours (kW-hrs) derived from vesselpower ratings, hours of operation, and appropriate load factors. Internet searches were implemented toidentify seismic surveys conducted in the Arctic in 2012. Through these searches, one seismic surveyproject implemented in both the Chukchi and Beaufort Seas was identified, the ION GeophysicalSeismic Survey.7 The seismic survey occurred during a 76-day period in 2012 and focused on specifiedareas in the Beaufort Sea and a small part of the Chukchi Sea. Emissions were estimated by applyingemission factors and HAP speciation profiles to activity data and load factors.Exploratory DrillingExploratory drilling in 2012 was implemented in both seas using two teams equipped withdrilling rigs, support vessels, ice breakers, oil spill response vessels, and helicopter support for a periodof 53 days in the Chukchi Sea and 29 days in the Beaufort Sea. Drilling rigs typically include multipleemissions sources such as mud pumps, generators, draw works, compressors, and propulsion engines.The emissions inventory includes estimates for all emissions sources that typically operate on a drillingrig off the coast of the North Slope, based on data provided by BOEM and the exploratory drilling planssubmitted to BOEM by Shell Gulf of Mexico Inc.8,9 Based on the Exploration Plan submitted to BOEMby Shell9 and a report submitted to DOI by Shell,10 ERG compiled vessel and support fleet information,including engine characteristics (kW power rating) and estimated hours of operation for operations inthe Beaufort and Chukchi Seas. Emissions were estimated by applying emission factors and HAPspeciation profiles to activity data and load factors. As noted above, drilling operations also includehelicopters for personnel and equipment transfers and airplanes for wildlife monitoring. Emissions wereassociated with the LTOs at the airport (in the onshore emission estimates), LTOs at the drilling vessels,and the cruise portion between the airports and drilling vessels. Emissions were calculated using theFAA’s EDMS.5In 2012, there were no offshore production platforms, no platform or pipeline constructionactivities, and no geohazard or geotechnical surveys.Commercial Marine VesselsThe emission inventory included non-oil/gas related offshore sources in addition to seismicsurvey operations and exploratory drilling. Cargo and supplies that are too heavy to be shipped to theNorth Slope communities by aircraft are transported via commercial marine vessels (CMV). Theseshipments occur during the open water period when navigation is possible (generally July throughOctober). Because ports in the North Slope are relatively shallow, the CMV fleet comprises shallowdraft vessels or tugs and barges. The CMV activity data were defined in terms of kW-hrs and derivedfrom the vessel power rating, hours of operation, and appropriate load factors. Automatic IdentificationSystem (AIS) data for July through October 2012 were obtained from the Marine Exchange of Alaska(MEA) for 7 North Slope ports for 29 vessels.11 Vessel power ratings were obtained for most vesselsfrom IHS Register of Ships.12 Emissions were estimated based on GREET Category 2 Tier III marinevessel emission factors.3 CMV emissions were spatially allocated to the closest shipping lanes noted inFigure 3, associated with the AIS location data.6
Figure 3. U.S. Army Corps of Engineers shipping lanes and development sites (C1, C2, B1, B2, B3, andB4) off the North Slope.Data Source: Reference 13Research VesselsSeveral organizations, such as the Arctic Council, U.S. Geological Survey (USGS), and theNational Oceanic and Atmospheric Administration (NOAA), operate research vessels off the NorthSlope coast to implement oceanographic research and monitor changes in fish and mammal populations.These vessels are equipped with Category 2 or 3 propulsion engines and Category 1 auxiliary engines.The research vessel activity data were defined in terms of kW-hrs derived from the vessel power rating,hours of operation, and appropriate load factors.14 Internet searches were conducted to identify researchprojects active in 2012. The United States Coast Guard (USCG) provided the most comprehensive list ofprojects that occurred in the Beaufort and Chukchi Seas in 2012.15 The USCG data included vesselnames, start and end dates, and location of each project. Emissions were estimated by applying dieselmarine emission factors and HAP speciation profiles to activity data for 2012.Onshore SourcesIn addition to offshore sources, the emissions inventory includes estimates for onshore emissionsources within the North Slope region and adjacent waters of the Beaufort Sea and Chukchi SeaPlanning Areas. These sources include the North Slope oil and gas fields, as well as onshore sourceslocated in eight nearby villages and elsewhere on the North Slope (e.g., airports, the TransAlaskaPipeline System, non-oil and gas related stationary and mobile sources).7
Seismic Survey EquipmentEmission sources within the onshore oil and gas fields on the North Slope include devices andactivities associated with both oil and gas exploration and production. Prior to conducting exploratorydrilling, oil and gas companies will typically conduct geological and geophysical (G&G) explorations.These companies will use seismic survey equipment if these exploratory activities occur on sea ice or onland. Information regarding land-based G&G permits could not be obtained from the Alaska Departmentof Oil & Gas, so it is not clear whether any land-based G&G work was conducted in 2012. Given thisuncertainty, ERG assumed that one G&G project occurred in 2012 that was similar in scope and size tothe most recent active G&G permit, which included both ice- and land-based activities.16 The permitassumed operation of 12 vibroseis vehicles (i.e., “thumper trucks”), in addition to various other supportequipment (e.g., long-haul fuel tractors, remote fuelers, water makers, incinerators, resupply andsurvival sleighs, tractors, loaders). A total of 477,000 gallons of ultra-low sulfur diesel (ULSD) fuel(4,500 gallons for 106 days) was assumed to be used. As in the BOEM G&G permit, emissions wereestimated by combining the ULSD quantity of 477,000 gallons with EPA WebFIRE emission factors.17Exploratory DrillingEmissions from onshore oil and gas exploratory drilling are generated when fuel used in thedrilling rig engines, heaters, and boilers used on the drill rig is combusted and from fluid flowbackduring well completion. Emissions from fuel combustion from onshore oil and gas exploratory drillingrigs are generated as diesel fuel is burned in drilling rig engines, heaters, and boilers. The AlaskaDepartment of Environmental Conservation (ADEC) covers drilling rig activities in their permittingprogram, and air emissions data for the North Slope drilling rig fleet are available through air permitapplications and permits. There are two primary permits that cover the North Slope drilling fleet:ConocoPhillips’ Kuparuk Transportable Drilling Rigs permit and BPXA’s Transportable Drilling Rigspermit. These permits list specific rigs and drilling companies permitted to operate on the North Slope,and in many cases, the same rigs are listed in both permits. In addition to data available in air permitsand permit applications, GHG emissions from drilling rigs are reported under 40 CFR Part 98, subpartW of EPA’s Greenhouse Gas Reporting Program (GHGRP). Four GHGRP facilities produce nearly 99%of crude oil from the North Slope: Badami Development Facility; BP Alaska, 890 – Arctic Slope Basin;ConocoPhillips Alaska, Inc. – KRU-ALP Fields; and Nikaitchuq Development. Therefore, the GHGRPemissions from drilling rig engines, heaters, and boilers from these four facilities are consideredcomplete estimates of emissions of GHG pollutants.To estimate emissions of CAPs and HAPs, the ConocoPhillips Title V renewal application forthe Kuparuk Transportable Drilling Rigs permit was reviewed. This permit application containspotential emissions estimates for CO2, CH4, N2O, CAPs, and HAPs, allowing for a direct comparison to
Baseline Emissions Inventory and Future Year Projections for the Arctic Air Quality Modeling Study Paula Fields Simms and Marty Wolf Eastern Research Group, Inc. 8950 Cal Center Drive, Suite 325, Sacramento, CA 95826 paula.fields@erg.com Mike Pring, Richard Billings, R