Transcription
r------ .-----EPA-600/2-83-052July 1983FLARE EFFICIENCY STUDYbyMarc McDanielInc.2901 North JnterregionalAustin, Texas 78722Engineering Science,EPA Contract 68-02-3541-6EPA Task Officer:Bruce A. TichenorIndustr i a1. Processes BranchIndustrial Environmental Research LaboratoryResearch Triangle Park, NC 27711,.' .'";"1 . ,." I'-"J.4' 7.- . .- -Prepared for:U.S. ENVIRONMENTAL PROTECTION AGENCYOffice of Research and DevelopmentWashington, DC 20460
ABSTRACTA full-scale experimental study was performed to determine the efficiencies of flare burners as devices for the disposal of hydrocarbon emissionsfrom refinery and petrochemical processes. The primary objectives of the studywere to determine the combustion efficiency and hydrocarbon destructionefficiency for both air- and steam-assisted flares under a wide range ofoperating conditions. Test results indicate that flaring is generally anefficient hydrocarbon disposal method for the conditions as evaluated. Thestudy provides a data base for defining the air quality impact of flaring. operations.The test methodology utilized during the study employed a speciallyconstructed 27-foot sample probe suspended by a crane over the flare flame. Thesample extracted by the probe was analyzed by continuous emission monitors todetermine concentrations of carbon dioxide (CD2). carbon monoxide (CD). totalhydrocarbons (THC). sulfur dioxide (SD2). oxides of nitrogen (ND x). and oxygen(D2)· In addition. the probe tip temperature. ambient air temperature. and windspeed and direction were measured. Integrated samples of the relief gas werecollected for hydrocarbon species analysis by gas chromatograph. Particulatematter samples were also collected during the smoking flare tests.The rigorous test program included flare testing under thirty-four different operating conditions during a three-week period in June 1982. Testvariables included Btu content of the relief gas (propylene diluted withnitrogen). relief gas flow rates. steam flow rates. and air flow rates. Whenflares were operated under conditions representative of good industrial operating practices. the combustion efficiencies at the sampling probe weredetermined to be greater than 98 percent. Combustion efficiencies were observedto decline under conditions of excessive steam (steam quenching) and high exitvelocities of low Btu gases.ii
CONTENTSAb s t rac tIIIIIIFigures.Tab 1es41 . IIIIIIIII.IIIIIIIII .III. . III IIIIII lit- III. . . III. iivivi;Abbreviations and Symbols viiiSection 1Introduction. . . . . . . . . . . . .Section 2Conclusions.Technical Sununary .2. .2Conclusions and ObservationsSection 3Testing Methodology.5 Experiment Design and Flare Operation . 6. 6Sampling and Analysis. . . . . . . . . . .8Types of Flare Burners Tested. 8Flare Test Procedures. . 13Background Measurements . 14Continuous Emission Analyzers15Hydrocarbon Species Analysis15Temperature Measurements . . . . . .18Particulate AnalysesSection 41. . . .18Moisture Determinations.18Meteorological Measurements . .19Audio and Video Recordings . . .19Data Collection and Calculations. .Continuous Analyzers' Data Acquisitioniii. .2020
PageHydrocarbon Species Data21CalculationsSection 5.·.·········.····· ··········.Documentation.Review of Flare Test Results.Steam-Assisted Flare TestsHigh Btu Content Relief Gases22252527··.Low Flow Rate, High Btu Relief Gases28Low Btu Content Relief Gases.29Purge Rate Relief Gas Flows31Air-Assisted Flare Tests········High Btu Content Relief Gases····Low Btu Content Relief Gases····· 31·3133Purge Rate Relief Gas Flows 34Sensitivity of Combustion Efficiency toProbe Height . .34Effect of Steam-to-Relief Gas Ratio onCombustion Efficiency .34Flare NO x EmissionsHydrocarbon AnalysesSection 621 III Ijt* 37 39Particulate Material Analyses.43Dilution Ratio and Destruction EfficiencyDeterminations . . 43Moisture Determinations 48Other Flare Test Analyses.48Quality Assurance and Quality Control Activities.Multipoint Calibrations.Zero and Span Checks.·.Instrument Response Times and Through-ProbeCalibration Checks . iv50505053
PageBackground Measurements . . Combus ionEfficiency Error Analysis5656AppendicesA.Graphical Review of Selected Tests59B.Statistical Summaries 78C.Calculation of Destruction Efficiency (DE) D.Soot Composition . . v 125. . 129
FIGURESNumber.1Flare efficiency test systems2Flare flow control system 3Flow control and nitrogen cylinder manifolds.104Flare sampling and analysis system .115Flare emission sampling probe .6Sensitivity of combustion efficiency toprobe height (Test 28) . . . . . . . 357Sensitivity of combustion efficiency toprobe height (Test 57) 84 III III III12III36.Effect of steam-to-relief gas ratios on flarecombustion efficiency (High Btu content reliefgases)93. III III . Example gas chromatogram hydrocarbon analysis(Test 50) . . .vi38 44
TABLESNumberPage1Flare efficiency test results . . 2Flare emission analyzers and instrumentation3Gas chromatograph operating conditions4Steam-assisted flare summary.5Air-assisted flare summary6Flare NO x results . . .7Hydrocarbon analysis summarySteam-assisted flare tests . . . . . . . . . 418Hydrocarbon analysis summaryAir-assisted flare tests.9Particulate analysis4· 16· 17. . . . " 26 32. . " " " 40 42 4510Smoking flare combustion efficiencies.4611Flare efficiency testMoisture content of samples (EPA Test Method 4) . . . 4912Multipoint calibration checks.13Zero/span check summary .· 5214Instrument response times . 5415Sampling system leak checks. 5516Error estimates· 51 57v; i
LIST OF ABBREVIATIONS AND SYMBOLSABBREV lATIONSAGLBtuBtu/hrBtu/minBtu/SCFFEPft/minHP10in 2lbs/hrl/gmg/l00PPMpsiapsigSCFMAbove ground levelBritish thermal unitBritish thermal unit per hourBritish thermal unit per minuteBritish thermal unit per standard cubic footfluro elastic polymerfeet per minutehorsepowerinside diametersquare inchpounds per hour1iters per gram-- milligrams per literoutside diameterparts per million by volumepounds per square inch absolutepounds per square inch gauge pressurestandard cubic feet per minute @ 14.7 psia nd 70 F.SYMBOLSCOC02N2NO x02SFSS02THecarbon monoxidecarbon dioxidenitrogennitrogen oxides-- oxygensulfur hexafluoridesulfur dioxidetotal hydrocarbonviii,;;
SECTION 1INTRODUCTIONThis document is a report on an experimental study to determine theefficiencies of flare burners as devices for the control of continuoushydrocarbon emissions. The primary objectives of this study were to determinethe combustion efficiency and hydrocarbon destruction efficiency for both airand steam-assisted flares over a wide range of operating conditions that mightbe encountered in continuous low flow industrial appl ications. The studyexcluded abnormal flaring conditions which might represent large hydrocarbonreleases during process upsets, start-ups and shutdowns.Both government and industry environmental officials are concerned withthe effects of flaring hydrocarbons on the air quality. However, since flaresdo not lend themselves to conventional emission testing techniques, fewattempts have been made to characterize flare emissions.Flare emissionmeasurement problems include: the effects of high temperatures and radiant heaton test equipment, the meandering and irregular nature of flare flames due toexternal winds and intrinsic turbulence, the undefined dilution of flareemission plume with ambient air, and the lack of suitable sampling locations dueto flare and/or flame heights, especially during process upsets when safetyproblems would predominate.Previous flare efficiency studies did not encompass the range of variablesencountered in the industrial setting. Limited test conditions of flare types,relief gas types, Btu content, relief gas flow rate, and steam-to-relief gasratios were explored.This study was intended to add to the availableliterature on the subject by testing the flaring of an olefin (propylene) inboth air- and steam-assisted flares with test variables of relief gas flow rate,relief gas Btu content, and steam-to-relief gas ratio.Separate elements of this flare efficiency study were sponsored by the U.S.Environmental Protection Agency (EPA) and the Chemical Manufacturers Association (CMA). Other project participants included John link Company who providedflares, test facility and flare operation, and Optimetrics, Inc. who operatedthe EPA S Remote Optical Sens i n9 of Emi ssions (ROSE) system. Engineeri n9Science, Inc. (ES) operated the extractive flare sampling and analysis systemsand prepared this report.I1
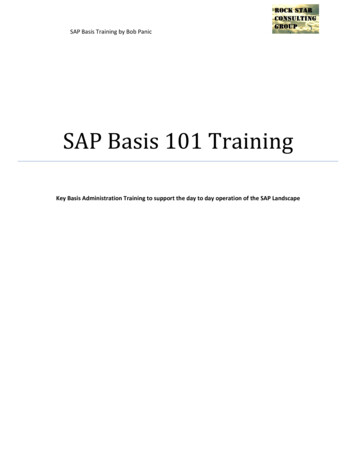
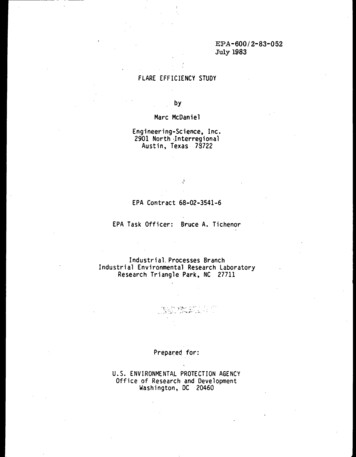
SECTION 2CONCLUSIONSTECHNICAL SUMMARYFigure 1 is an overview of the equipment used to operate and test theflares. The test methodology utlized during the study employed a speciallyconstructed 27-foot sample probe suspended by a crane over the flare flame. Thesample extracted by the probe was analyzed by continuous emission monitors todetermine concentrations of carbon dioxide (C02), carbon monoxide (CO), totalhydrocarbons (THC), sulfur dioxide (S02), oxides of nitrogen (NO x) and oxygen(02)' In addition, the probe tip temperature, ambient air temperature and windspeed and direction were measured. Integrated samples of the flare plume werecollected for hydrocarbon species analysis by gas chromatograph. Particulate att . JJ.les .wer . coll,ectedd r:ing the smoking flare tests. Sulfur use--wasattempted as a tracer material in an effort to determine the dilution of therelief gas between the flare burner and the sampling probe location. However,the implementation of this unproven sulfur balance method for determiningdilution ratios was unsuccessful.The term "combustion efficiency" was used during this study as the primarymeasure of the fl ares' performance.Conceptually, thi s term defines thepercentage of flare emissions that are completely oxidized to C02- Mathematically the combustion efficiency is defined as:% CE C02X 100C02 CO THC SootWhere:C02 parts per million by volume of carbon dioxideCO parts per million by volume of carbon monoxideTHC parts per million by volume of total hydrocarbon as methaneSoot parts per million by volume of soot as carbon*.Table 1 sunmarizes the results of the flare efficiency tests. The rigoroustest program included flare testing under thirty-four different operatingconditions during a three-week period in June 1982. Test variables included Btucontent of the relief gas (propylene diluted with nitrogen), relief gas flowrates, steam flow rates and air flow rates. ' Five of the thirty-four tests weredivided into thirteen subtests for purposes of data analysis because the flareoperation did not represent steady-state conditions. The Btu content of therelief gas was varied from 2,183 to 192 Btu/SCF for the steam-assisted flare,and from 2,183 to 83 Btu/SCF for the air-assisted flare. The relief gas flow* In most cases, the "soot" term was zero.2
.00t];----, NATURALNATURAL GAS (PiJGAS NITROGENFLOW.ROTOMETERNITROGEN NITROGEN VIDE ERl \\",---lt\w o.,I'"-".". II"., .'-.ENGINEERLNG SCIENCE ANALVSIS TRAILERSPIIIME TEOROLOGICALPISTATIONSTEAMMEASURING STATIONFigure 1.Flare efficiency test systems.('-NATURALGASt,I, EPA ROSESYSTEMSTEAM BOILER
TABLE 1.TestNumberRelief GasHeatingFlowValue(SCFM)(Btu/SCF)STEAM-ASSISTED FLARE 4520.556530.356FLARE EFFICIENCY TEST RESULTSSteam-to·Re liefGas fie 7.5lZ3CCIllIJlentsIncipient smok iny flarC!Smking flareSllIok i"9 flareIncipient oklng flareSa.pling probe in· flare flameSteam-quenched flameSteam-quenched flaresmokeNo SllIOkeIncipient smoking flareSlIIoking flareNoAIR-ASSISTED FLARE 1581681462821532898329422aAir Flow. Hi.Low. 99.9499.1761.9454.1364.0399.7494.1899.3798.249fs. 9498.82Smking flare; no aira sisldnceDetached flame observedDetached flame; no air assistanceDetached flame; with air assistanceFlame slightly detached-- ----Not accounting for carbon present as soot (seeT 'e10).4
rates ranged from 703 SCFM to 0.35 SCFM (purge flow rate) for the steam-assistedflare, and from 639 SCFM to 0.54 SCFM (purge flow rate) for the air-assistedflare.CONCLUSIONS AND OBSERVATIONS When flares are operated under conditions which are representative ofindustrial practices, the combustion efficiencies in the flare plume aregreater than 98%. Steam- and air-ass i sted fl ares are generally an effic ient means ofhydrocarbon disposal over the range of operating conditions evaluated. \ Varying flow rates of relief gas have no effect on steam-assisted flare(\combustion efficiencies below an exit velocity of 62.5 ft/sec. (l.1 ·'1 w:.h. A )-,'.-t p\- ""1o··,-.L' :: '''- :'''1·''--/.I'''"i)- -'''''--iY'''--:!,,.;\- ,O- ,r t"",J tr·",-- . i.·h'"l ) -\I(4/ H'-'.nJ . 7. Varying Btu content of relief gases have no observed effect on steamassisted flare combustion efficiencies for relief gases above 300 Btu/SCF.A slight decline in combustion efficiency was noted for relief gases below300 Btu/SCF. Flaring low Btu content gases at high exit velocities may result in lowercombustion efficiencies for air-assisted flares. Smoking flares achieve high gaseous hydrocarbon destruction efficiencies. In many cases, where high combustion efficiencies were observed, thecarbon monoxi de and hydrocarbon concentrations observed in the fl are plumewere approximately equal to those found in ambient air. Concentrations of NO x emissions in the flare plume,were observed to range from 0.5 to 8.16 ppm. The combustion efficiency data were insensitive to sampling probe heightwithin the normal operating heights of the probe. Further development of a technique to use sulfur or another material as atracer material to determine the flare dilution ratios is required. Steam-assisted flares burning relief gases with less than 450 Btu/SCFlower heating value did not smoke, even with zero steam assistance. The meandering of the flame's position relative to the sampling probe withvarying wind conditions affected the continuous measurements but had noapparent effect on the combustion efficiency values. Higher concentrations of THC and CO were not observed during the purgerate flare tests.5II\.
SECTION 3-TESTING METHODOLOGYEXPERIMENT DESIGN AND FLARE OPERATIONThe flare tests were designed to determine the combustion efficiency andhydrocarbon destruction efficiency of flares under a variety of operatingconditions. The tests were devised to investigate routine industrial flaringoperations. Conditions representative of emergency flaring operations were notinvestigated. The primary flare operating variables were: Flow rate of relief gas;Heating value of relief gases; andSteam-to-relief gas ratio (steam flare only).The preliminary test plan called for twenty-seven tests, with each test havinga different combination of flare operating variables. The operating variableswere defined as follows:Relief Gas FlowHigh - 25 foot flame length.Intermediate - 1/6 of high flow.low - 1/20 of high flow.,.-.:;,- .-. . .' ",The maximum practical flame length hat could be tested was approximately 25feet due to height limitations of the crane boom holding the sampling probe.This was the limiting factor for setting the maximum relief gas flow rate.Heating ValueHigh - Heating value of the undiluted relief gas (zero nitrogen flow)(2,200 Btu/ft 3 ).Intermediate - Twice the low heating value condition (300-600Btu/ft J ).Low - lowest heating value that will maintain combustion (highnitrogen flow) (less than 200 Btu/ft 3).Steam FlowHigh - Steam-to-relief gas mass ratio of 1.0.Intermediate - Steam-to-relief gas mass ratio of 0.5.Low - Steam flow at incipient smoking.Zero6
The preliminary test plan called for determination of the vertical profileof the plume by sampling at least four different heights above the flame. Asdiscussed on page 34, this was not done due to the insensitivity of combustionefficiency to probe height. Following the vertical profile measurements, theflare's efficiency was' to be determined at the vertical point where thecombustion reactions are complete but prior to further dilution with ambientair.A technical pretest meeting was held on May 6, 1982 at the John link Companyflare demonstration facility in Tulsa, Oklahoma to allow the project participants to finalize the test plans. During this meeting, six (6) smoking flaretest designs were adopted in addition to the 27 tests previously mentioned, fora total of 33 planned tests. Other items discussed during this meetingincluded: the division of responsibilities, lines of communication, qualityassuran e procedures, safety considerations, schedules and testing sequence.During the early stages of the test program, the participants learned moreabout the characteristics of flares, and it became apparent that several of theplanned tests were not practical and/or did not represent the intended flareoperating conditions. Therefore, sixteen of the thirty-three pl annesL tests(numbered 1 through 33) .were cancelled and a substitute grgup of tests{numbered 50 through 67) were formulated in the field and executed in theirplace. The most common reason for abandoning tests was that many of the plannedincipient smoking tests and smoking steam-assisted flare tests would not smoke,even with zero steam flow.During each test the flows of the flare feed gases were monitored andmaintained as close as practical to the target levels. For several tests it wasnot possible, due to physical constraints, to maintain all the flow rates- atconstant level. This was particularly true for those tests that called for highnitrogen flow. As the pressure in the NZ cylinder banks declined during a test,the nitrogen flow would tend to decrease, resulting in higher relief gas heatingvalues.Sulfur was selected as a tracer material to allow estimation of thedilution of the relief gas from the flare burner tip to the sampling probe.Sulfur was chosen primarily because of the availability of monitoring instrumentation to measure part-per-billion levels of sulfur using flame photometry.Helium was considered as a tracer material. However, this material isdifficult to quantify at levels less than several tens of parts per million andthus, would require large quantities of gas. Additionally, helium cannot bedetected on a continuous basis as can 502' Sulfurhexaf1uoride (SF6) was alsoconsidered as a tracer material. However, SF6 is not stable at the elevatedtemperatures found in a flare flame.The sulfur in the relief gas originated from three primary sources: 1)naturally occurring reduced sulfur in the crude propylene, Z) sulfur dded tothe propylene in the form of butyl mercaptan (approximately 1 gallon butylmercaptan/6,800 gallons crude propylene), and 3) sulfur dioxide gas added to therel ief gas stream. All three sources and forms of sulfur are presumablyoxidized to SOZ as the relief gas is burned. The flare emissions were thenanalyzed for total sulfur as S02 using flame photometry.7
Crude pr
Engineering Science, Inc. 2901 North Jnterregional Austin, Texas 78722 . Audio and Video Recordings . . . 19 . British thermal unit British thermal unit per hour British thermal unit per minute British t