Transcription
2018 EMPLOYEEBENEFITST H E EVO LUT IO N O F B E NE F ITS
2018 EMPLOYEE BENEFITSThe Evolution of BenefitsA RESEARCH REPORT BYTHE SOCIETY FOR HUMANRESOURCE MANAGEMENTMedia ContactThe Society for Human Resource Management(SHRM) is the world’s largest HR professional society,representing 285,000 members in more than 165countries. For nearly seven decades, the Societyhas been the leading provider of resources servingthe needs of HR professionals and advancing thepractice of human resource management. SHRMhas more than 575 affiliated chapters within theUnited States and subsidiary offices in China, Indiaand United Arab Emirates. Visit us at shrm.org.Kate Kennedy 1.703.535.6260kate.kennedy@shrm.orgVanessa Hill 1.703.535.6072vanessa.hill@shrm.orgSundra Hominik 1.703.535.6273sundra.hominik@shrm.orgOnlineSHRM Online: shrm.orgSHRM Research & Surveys: shrm.org/researchSHRM Research on Twitter: @SHRM ResearchSHRM Research on LinkedIn: LinkedIn.comSHRM Research on SHRM Connect:community.shrm.org18-0623USASHRM HeadquartersAlexandria, VA 22314 1.800.283.7476SHRM@shrm.orgChinaGateway PlazaChaoyang DistrictBeijing, 100027 86.10.59231033SHRMChina@shrm.orgIndiaGurgaon, Sector 26Haryana 122002 91.12.44200243SHRMIndia@shrm.orgUnited Arab EmiratesDubai Knowledge VillageDubai, UAE 971.050.104.6330SHRM.MEA@shrm.org
CONTENTS1The Strategic Use of Benefits3The Evolution of Benefits Offerings4Health Care Benefits9Wellness Benefits10Paid Leave Benefits12Retirement Savings and Planning Benefits13Work-Life and Convenience Benefits14Financial and Career Benefits16Professional and Career Development Benefits17Travel and Relocation Benefits18Conclusion19Respondent Demographics20Methodology21Appendix: Benefits by Year21 Health, Leave and Retirement Benefits21 Table 3: Health-Related Benefits22 Table 4: Coverage for Specific Health Services or Procedures23 Table 5: Wellness Benefits24Table 6: Leave Benefits25 Table 7: Retirement Savings and Planning Benefits26 Work-Life and Convenience Benefits26 Table 8: Flexible Working Benefits27 Table 9: Family-Friendly Benefits28 Table 10: Employee Programs and Services29 Financial and Career Benefits29 Table 11: Compensation Benefits30 Table 12: Financial Benefits31 Table 13: Professional and Career Development Benefits32 Travel and Relocation Benefits32 Table 14: Business Travel Benefits33 Table 15: Housing and Relocation Benefits34Endnotes
WITH EMPLOYEE BENEFITS MAKING UPAPPROXIMATELY ONE-THIRD OF TOTAL COMPENSATION COSTS,1ORGANIZATIONS MUST ENGAGE IN STRATEGIC BENEFITS PLANNINGTO MAXIMIZE THEIR RETURN ON INVESTMENT.
AS THE ECONOMY CONTINUES TO IMPROVE AND THE JOB MARKET EVOLVES FROM ANEMPLOYER- TO A CANDIDATE-DRIVEN MARKET, IT IS ESSENTIAL THAT ORGANIZATIONSLEVERAGE THEIR BENEFITS TO RECRUIT AND RETAIN TOP TALENT.In February and March 2018, the Society for Human Resource Management (SHRM) conducted its annual survey of U.S.employers to gather information on the types of benefits employers offer their employees. The survey instrument listed morethan 300 benefits and asked human resource (HR) professionals whether their organizations formally offered each or had plansto do so in the next 12 months.In addition to the overall U.S. benefits prevalence rates in this report, customized reports are available through SHRM’sBenchmarking Service to provide organizations with benefits data for their specific industry, staff size and other organizationaldemographics. To learn more, please visit shrm.org/benchmarks.THE STRATEGIC USE OF BENEFITSHR departments and organizations as a whole invest significantresources into designing benefits packages that can beused both to recruit new employees and to retain the talentthey already have. In a SHRM survey on job satisfaction andengagement, the vast majority (92%) of employees indicatedthat benefits are important to their overall job satisfaction.2Results also showed a relationship between benefits andretention, with 29% of employees citing their overall benefitspackage as a top reason to look for a position outside of theircurrent organization in the next 12 months; 32% of employeeswho were unlikely to look for an external position cited theiroverall benefits package as a top reason as well. This findingillustrates what HR professionals already know—benefitsare powerful and can either cost or save an organization asubstantial amount of money associated with turnover.Between 2015 and 2017, the unemployment rate declined byapproximately 20%3 and, in the last year, 14 states set recordlows for unemployment, with Hawaii reporting the lowestunemployment rate across the country in March 2018.4 Thiseconomic turn translates to a more difficult environment fororganizations to recruit and retain talent. With employee benefitsmaking up approximately one-third (32%) of total compensationcosts,5 organizations must engage in strategic benefits planningto maximize their return on investment.A 2017 SHRM survey on the strategic use of benefits found thatorganizations that take a strategic approach to their benefitsprogram, leveraging benefits to recruit and retain employees,are nearly twice as likely to have more satisfied employeesand to report better business performance compared withorganizations that are not strategic with benefits.6THE IMPACT OF STRATEGIC BENEFITSOrganizations that use benefits as a strategictool for recruiting and retaining talent reportedbetter overall company performance andabove-average effectiveness in recruitmentand retention compared with organizationsthat did not. Company performance: 58% vs. 34% Effectiveness in recruitment: 19% vs. 8% Effectiveness in retention: 28% vs. 11%Source: Society for Human Resource Management. (2017). 2017 StrategicBenefits Survey—Strategize with Benefits. Retrieved from www.shrm.org.THE EVOLUTION OF BENEFITS 1
THE STRATEGIC USE OF BENEFITS (CONTINUED)Second to compensation planning, designing a strategic benefitsplan is the most important step organizations can take to staycompetitive. Once a strategic benefits program is in place, thenext step is to ensure effective communication of benefits to bothcurrent and potential future employees.METHODS TO COMMUNICATE THE VALUE OFEMPLOYEE BENEFITS Provide employees with a benefitsstatementa that highlights the dollar valueof each of their benefits. Show employees how their benefitscompare with competitors in the sameregion using benchmarking tools, such asSHRM’s Benchmarking Service.b Share progress of expanding employeebenefits over time with employees.Source: SHRM 2017 Strategic Benefits Survey—Communicate Effectively.Retrieved from .xlsbshrm.org/benchmarks2 2018 EMPLOYEE BENEFITSOrganizations may start by assessing which communicationsmethods may be most effective, considering such factors as staffsize, access to technology and whether employees work onsiteor offsite. Next, organizations need to design a communicationsstrategy, including a project plan comprising a timeline andfrequency for various communications, appropriate audience(s),communication method, etc. Some organizations may find ithelpful to tie their benefits messaging to the values and cultureof the organization. For example, an organization that valuessocial responsibility may highlight paid time off for volunteer work.Developing a theme or message about the purpose and valueof benefits offerings (e.g., logos, slogans) can also help engageemployees in learning more about the benefits available to them.Lastly, providing employees with a total rewards statement will showthem how much the company is truly investing in them.
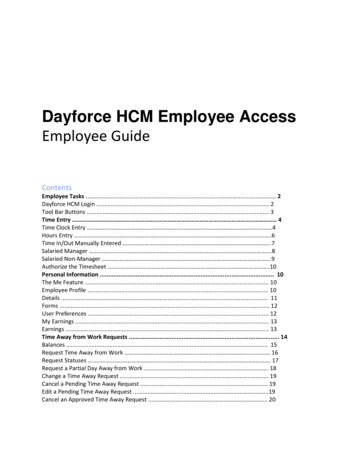
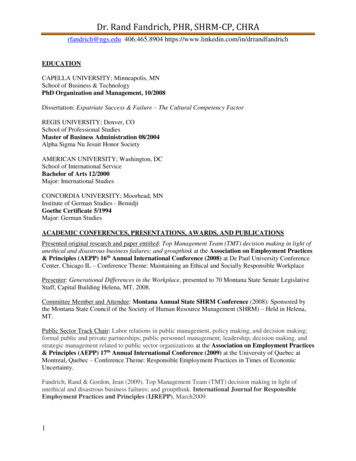
THE EVOLUTION OF BENEFITS OFFERINGSOverall, more than one-third of organizations (34%) increasedbenefits offerings in the last 12 months. Perhaps in part due to areaction to the improving economic climate, the prevalence ofover 60 benefits assessed increased between 2017 and 2018compared with just 20 between 2016 and 2017 (see AppendixTables). Organizations that increased benefits offerings weremost likely to increase health-related (51%), wellness (44%), andemployee programs and services (39%) benefits; 32% increasedprofessional and career development benefits, and about onequarter increased leave, family-friendly and flexible workingbenefits (all 28%). The top reasons cited for increasing benefitswere to retain employees (72%), to attract new talent (58%) andto respond to employee feedback (54%) (see Figure 1).Just 5% of organizations decreased their overall benefitsofferings in the last 12 months with large organizationsc beingat least twice as likely to have decreased benefits thansmall organizationsd (9%-12% vs. 3%-4%). The majority (75%)of organizations that decreased benefits did so to managecosts, and about one-quarter (28%) made changes to helpwith the financial stability of the organization. Organizationsthat decreased their benefits offerings were most likely tohave decreased health-related benefits (59%); about onequarter decreased professional and career development (27%),employee programs and services (25%), leave (23%), andwellness (22%) benefits.c2,500 or more employeesdLess than 500 employeesFIGURE 1MORE THAN TWO-THIRDS (72%) OF ORGANIZATIONS INCREASED THEIR BENEFITS OFFERINGS TO RETAIN EMPLOYEES INTHE LAST 12 MONTHSDECREASEDINCREASED75%72%Manage cost of benefitsRetain employees28%58%Help with financial stability of organizationAttract new talent12%Downsizing54%Employee feedback26%9%Acquisition5%Employee feedbackManage cost of benefits6%AcquisitionNote: Decreased n 142. Increased n 1,012. Percentages do not total 100% due to multiple response options.Source: 2018 Employee Benefits (SHRM)THE EVOLUTION OF BENEFITS 3
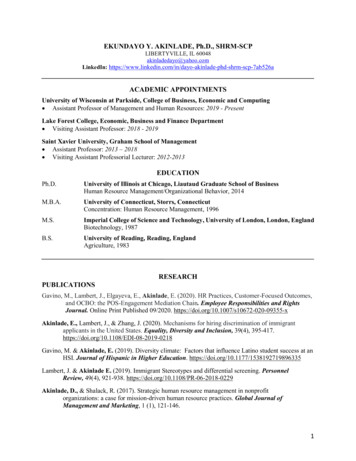
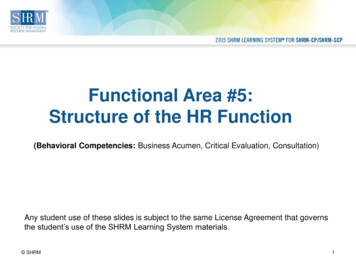
HEALTH CARE BENEFITSU.S. health care spending grew to 3.3 trillion in 2016, a 4.3%increase from 2015. In context, this amount translates to 10,348per person.8 Given the exponential growth of health care costs,organizations are faced with balancing costs and employeesatisfaction with health care coverage. Almost all organizations(98%) offered at least one of nine types of health care plans in2018, and over two-thirds (69%) of employers offered multipletypes (e.g., a preferred provider organization, or PPO, and a healthmaintenance organization, or HMO). Although this finding may notseem surprising given that organizations with 50 or more full-timeequivalents (FTEs) are required to provide health insurance tofull-time employees under the Patient Protection and AffordableCare Act (PPACA),e 95% of organizations with fewer than 50 FTEsprovided a health care plan to employees as well.PPO plans continue to be the most popular (84%), followed byconsumer-directed health care plans (CDHPs) (40%), HMO plans(35%), high-deductible health care plans not linked to a healthsavings account (HSA) or a health reimbursement arrangement(HRA) (29%), and point of service (POS) plans (17%); less than 10% oforganizations offered other types of health care plans (see Table3 in the Appendix). In a 2016 SHRM survey of HR professionals,28% indicated that offering CDHPs was the most successfulactivity in terms of helping their organization control the costs ofhealth care.9 However, the prevalence of CDHPs has been volatileover the past five years, falling by 11 percentage points between2015 and 2017 and then increasing 17 percentage points (to 40%)between 2017 and 2018. POS plans decreased by five percentageeEmployees who work 30 or more hours per week are considered full time.FIGURE 2PREVALENCE OF CONSUMER-DIRECTED HEALTH CARE PLANS VOLATILE OVER LAST FIVE YEARS5-Year ChangePreferred provider 84%organization (PPO)Health maintenanceorganization (HMO) 33%30%Consumer-directed healthcare plans oint of service (POS) 22%High-deductible health plan(HDHP) that is not linked toan HSA or an HRAIndemnity plan(fee-for-service) 12%Exclusive provider 7%organization (EPO)Full replacement consumerdirected health care plan (CDHP)BMini-med health *4%3%2%2%2%2%2015201620172018Note: : n 490-506 (2014); 445-459 (2015); 3,092-3,166 (2016); 2,758-2,837 (2017); 3,048-3,188 (2018). An asterisk (*) indicates a statistically significant increase or decrease between 2017 and 2018.AGenerally includes three major components: an HRA or HSA, an underlying medical plan (typically a PPO), and access to educational tools and information to help members navigate the plan.BCDHP is the only health care plan offered.CBasic plan that limits the amount of payments or number of times that services will be covered.Source: 2018 Employee Benefits (SHRM)4 2018 EMPLOYEE BENEFITS
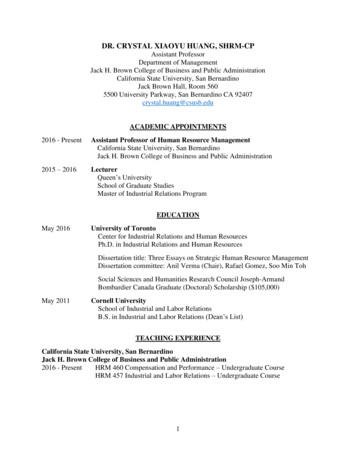
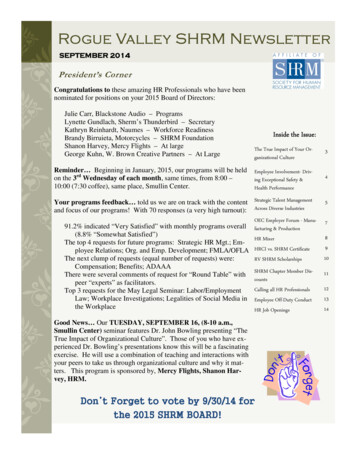
HEALTH CARE BENEFITS (CONTINUED)points (from 22% to 17%) and indemnity plans (fee-for-service)by eight percentage points (from 12% to 4%) between 2014 and2018 (see Figure 2).Health care coverage varies by type of employee andrelationship to employee. The vast majority of organizations offerhealth care coverage to full-time employees (99%), dependentchildren (98%), opposite-sex spouses (94%) and same-sexspouses (85%) (see Figure 3). Likely due to the implementationof the ACA, substantial increases in the prevalence of healthcare coverage have been seen for several groups since 2014,including opposite-sex spouses (23 percentage points), samesex spouses (39 percentage points), opposite-sex domesticpartners (25 percentage points), same-sex domestic partners(20 percentage points), foster children (32 percentage points),nondependent children (29 percentage points) and dependentgrandchildren (23 percentage points); coverage for part-timeemployees increased by 10 percentage points and dependentchildren by six percentage points.FIGURE 3SUBSTANTIAL INCREASES IN THE PREVALENCE OF HEALTH CARE COVERAGE SINCE 20145-Year ChangeFull-time employees 98%Dependent children sex spouses 71%62%55%55%Same-sex spouses 46%Same-sexdomestic partners 35%Opposite-sexdomestic partners 30%Foster children 27%Part-time employeesA 27%Dependent grandchildren 26%Nondependent children e: n 496 (2014); 447 (2015); 3,032-3,151 (2016); 2,657-2,771 (2017); 3,044-3,188 (2018). An asterisk (*) indicates a statistically significant increase or decrease between 2017 and 2018.AWork less than 30 hours per week.Source: 2018 Employee Benefits (SHRM)THE EVOLUTION OF BENEFITS 5
HEALTH CARE BENEFITS (CONTINUED)Sharing the costs of health care with employees is a common strategy to manage those costs. More than three-quarters oforganizations share the cost of health care with their employees for full- and part-time employees (83%) and spouses (77% for bothopposite- and same-sex spouses) (see Table 1). Less than 0.5% of employers opt to have full-time employees cover 100% of their healthcare costs; employers are more likely to require employees to pay all the health care costs for spouses (18%), domestic partners (23%24%) and children (18%-29%) (see Figure 3).TABLE 1MAJORITY OF ORGANIZATIONS SHARE HEALTH CARE COSTS WITH EMPLOYEESShared by the organizationand employeeFully paid by theorganizationFully paid bythe employee83%16%0%83%9%8%Opposite-sex spouses77%5%18%Same-sex spouses77%5%18%Opposite-sex domestic partners72%5%23%Same-sex domestic partners71%5%24%Dependent children77%5%18%Foster children74%5%22%Nondependent children68%3%29%Dependent grandchildren72%5%23%Full-time employeesPart-time employeesANote: n 2,922. Percentages do not total 100% due to multiple response options.AWork less than 30 hours per week.Source: 2018 Employee Benefits (SHRM)In addition to sharing the cost of health care with employees,some organizations manage their costs by charging surchargesor imposing restrictions on which employee dependentsare eligible for coverage. Overall, approximately one-fifth oforganizations have a restriction or other cost-saving measurein place for coverage of spouses and domestic partners (seeFigure 4). Most commonly, spouses and domestic partners arenot eligible for health care coverage if they are covered byanother entity (e.g., their own employer) (8%-10%), and someorganizations opt to impose a surcharge for coverage (8%-9%).In addition, 18% of organizations charge a higher premium forsmokers (i.e., a smoking surcharge).Given the increase in the prevalence of organizations offeringCDHPs since 2014 (30% in 2014 vs. 40% in 2018), it is notsurprising that HSAs have also increased in popularity, withmore than one-half of employers offering this benefit in 2018(56%) (see Figure 5). In contrast, the percentage of organizations6 2018 EMPLOYEE BENEFITSoffering HRAs has remained steady at 17% to 20% over the pastfive years; flexible spending accounts (FSAs) have declined from68% in 2014 to 63% in 2018.For other health benefits prevalence rates and trends, seeAppendix Tables 3-4.In addition to sharing the cost ofhealth care with employees andimposing restrictions or othercost-saving measures, 18% oforganizations charge a higherpremium for health care coverageof employees who smoke.
HEALTH CARE BENEFITS (CONTINUED)FIGURE 4ABOUT ONE-FIFTH OF ORGANIZATIONS IMPOSE RESTRICTIONS AND SURCHARGES ON HEALTH CARECOVERAGE FOR % 1% 1%9%7% 1% 1%7%5% 1% 1%Not eligible if offeredcoverage by other entitySurcharge if offeredcoverage by other entityOther restrictions/cost-saving measuresNote: n 830-2,391.Totals may not be equal to the sum of the three types of restrictions/surcharges due to rounding.Source: 2018 Employee Benefits (SHRM)THE EVOLUTION OF BENEFITS 7
HEALTH CARE BENEFITS (CONTINUED)FIGURE 5HEALTH SAVINGS ACCOUNTS BECOMING MORE PREVALENT; HEALTH REIMBURSEMENT ARRANGEMENTSREMAIN STEADYMedical flexible spending account (FSA)A68%69%5-Year Change67%65%63%55%56%36%37%20%19%50%Health savings account (HSA)45%Employer contributions to HSAs32%Health reimbursement arrangement (HRA)17%201443%30%32%19%20%2015201620172018Note: n 470-508 (2014); n 431-460 (2015); n 3,119 - 3,161 (2016); n 2,782-2,826 (2017); n 3,153-3,216 (2018). There were no statistically significant changes between 2017 and 2018.AIRC Section 125.Source: 2018 Employee Benefits (SHRM)8 2018 EMPLOYEE BENEFITS
WELLNESS BENEFITSOf organizations that increased benefits offerings in the last12 months, 44% increased their wellness benefits. Threequarters (75%) of employers offer wellness resources andinformation and/or a general wellness program. Over the lastyear, substantial increases were seen in company-organizedfitness competitions/challenges (10 percentage points: 38% in2018 vs. 28% in 2017), CPR/first aid training (seven percentagepoints: 54% vs. 47%) and standing desks (nine percentagepoints: 53% vs. 44%). Preventive programs specificallytargeting employees with chronic health conditions fell byeight percentage points since 2017 (from 33% in 2017 to 25%in 2018) and 17 percentage points since 2014 (42%).For other wellness benefits prevalence and trends, seeAppendix Table 5.WHY OFFER WELLNESS BENEFITS? Wellness benefits designed to helpemployees reduce anxiety, such as yogaand meditation, may help employeesmanage work-related stress, a leadingworkplace health problem. Indirect costs due to missed work andassociated productivity loss translates toapproximately 1,685 per employee eachyear. Wellness benefits can help reduce thelikelihood of employees developing four ofthe 10 most costly health conditions for U.S.employers—angina pectoris (chest pain),high blood pressure, diabetes and heartattack.Source: Centers for Disease Control and Prevention.Retrieved from www.cdc.gov.10THE EVOLUTION OF BENEFITS 9
PAID LEAVE BENEFITSIn a SHRM survey on job satisfaction and engagement, the vastmajori
4 2018 EMPLOYEE BENEFITS HEALTH CARE BENEFITS U.S. health care spending grew to 3.3 trillion in 2016, a 4.3% increase from 20