Transcription
A QuickIntroductionto DistributedTracingGain Visibility and ReduceMTTR in Complex ApplicationEnvironments
Table of ContentsIntroduction: Cutting Through the Complexity 03What Is Distributed Tracing? 05Why Does Your Business Need Distributed Tracing? 08How Does Distributed Tracing Work? 10When Do You Use Distributed Tracing? 12Why Is Sampling Important to Understand? 13A Mini-Glossary of Distributed Tracing Terms 14What’s Next? 15
Introduction: Cutting Through the ComplexityModern software development drives innovation forcompanies of all sizes and shapes, enabling them todeliver differentiated customer experiences, accel-erate time to market, and gain the agility needed tomeet their target outcomes. However, the downsideof modern environments and architectures is complexity, making it more difficult to quickly diagnoseand resolve performance issues and errors thatimpact customer experience.?The answer is observability, which cuts through software complexity with end-to-end visibility that enables teams to solve problemsfaster, work smarter, and create better digital experiences for theircustomers. Observability creates context and actionable insightby, among other things, combining four essential types of observability data: metrics, events, logs, and traces.Traces—more precisely, distributed traces—are essential for software teams considering a move to (or already transitioning to)the cloud and adopting microservices. That’s because distributedtracing is the best way to quickly understand what happens to?New Relic: A Quick Introduction to Distributed Tracingrequests as they transit through the microservices that make upyour distributed applications.Whether you’re a business leader, DevOps engineer, product owner,site reliability engineer, software team leader, or other stakeholder,you can use this ebook to get a quick introduction into what distributed tracing is all about, how it works, and when your teamsshould be using it.03
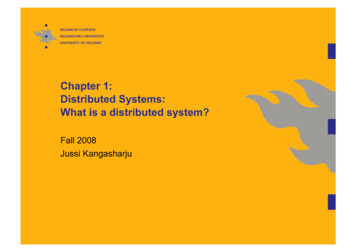
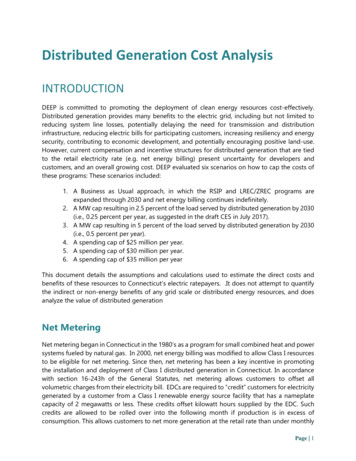
The shift to modern software developmentWaterfall developmentwith infrequent releasesAgile development withcontinuous deploymentSiloed teamsCross-functional teams and DevOpsOn-premisesCloud computingMonolithic applicationsDistributed, microservices architecturesMonitoring application performanceObserving end-to-end softwareand systems performanceReacting to performance issuesWorking to prevent performance issuesNew Relic: A Quick Introduction to Distributed Tracing04
What Is Distributed Tracing?Distributed tracing is now table stakes for operating and monitoring modernapplication environments. But what is it exactly?Distributed tracing is the capability for a tracing solution to track and observeservice requests as they flow through distributed systems by collecting data asthe requests go from one service to another. The trace data helps you understand the flow of requests through your microservices environment and pinpointwhere failures or performance issues are occurring in the system—and why.For instance, a request might pass through multiple services and traverse backand forth through various microservices to reach completion. The microservices orfunctions could be located in multiple containers, serverless environments, virtualmachines, different cloud providers, on-premises, or any combination of these.New Relic: A Quick Introduction to Distributed Tracing05
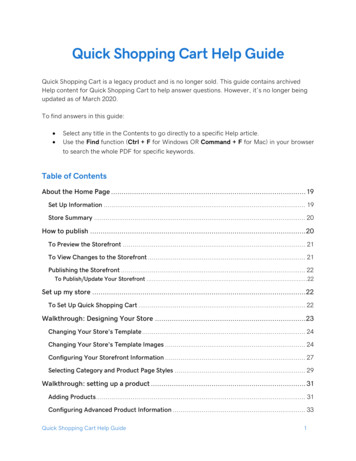
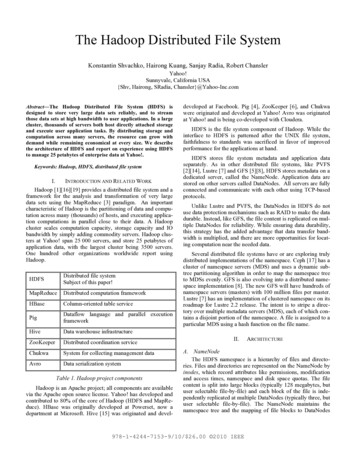
Connecting the dotsCombining traces with the other three essential types of telemetry data—metrics, events,and logs (which together with traces create the acronym MELT)—gives you a complete picture of your software environment and performance for end-to-end observability. You canlearn more about the different types of telemetry data in “MELT 101: An introduction to thefour essential telemetry data types.”A distributed trace has a tree-like structure, with “child” spans that refer to one “parent” span. This diagram showssome important span relationships in a trace.This diagram shows how spans in a different trace relate to one another.New Relic: A Quick Introduction to Distributed Tracing06
A brief history ofdistributed tracingAs companies began moving to distributed applications, they quickly realizedthey needed a way to have not only visibility into individual microservices in isolationbut also the entire request flow.Hence, distributed tracing became a bestpractice for gaining needed visibility intowhat was happening. However, softwareThen two things happened: First, solutionssuch as New Relic began offering capabilities that enable companies to quicklyand easily instrument applications fortracing, collect tracing data, and analyzeand visualize the data with minimal effort.Second, open standards for instrumenting applications and sharing data beganto be established, enabling interoperability among different instrumentation andobservability tools.teams discovered that instrumentingsystems for tracing then collecting andvisualizing the data was labor-intensiveand complex to implement. The time andresources spent building code to make distributed tracing work was taking time awayfrom the development of new features.A quick guide to distributedtracing terminology A request is how applications, microservices, andfunctions talk to one another. A trace is performance data about requests as they flowthrough microservices. A span represents operations or segments that are partof a trace. A root span is the first span in a trace. A child span is a subsequent span, which can be nested.New Relic: A Quick Introduction to Distributed Tracing07
Why Does Your BusinessNeed Distributed Tracing?As new technologies and practices—For example, a slow-running request mightthe performance of every service—bothcloud, microservices, containers, server-be impacting the experience of a set ofupstream and downstream—your soft-less functions, DevOps, site reliabilitycustomers. That request is distributedware teams can more effectively andengineering (SRE), and more—increaseacross multiple microservices and server-quickly:velocity and reduce the friction of gettingless functions. Several different teams ownsoftware from code to production, theyand monitor the various services that arealso introduce new challenges:involved in the request, and none have More points of failure within theapplication stack Increased mean time to resolution(MTTR) due to the complexity of the reported any performance issues withtheir microservices. Without a way to viewence and business outcomes high latency is occurring and which teamLess time to innovate because moreshould address the issue.As part of an end-to-end observabilitystrategy, distributed tracing addressesMeasure overall system health andunderstand the effect of changes onthe customer experienceacross the different services, it’s nearlyimpossible to pinpoint where and why theIdentify and resolve issues to minimizethe impact on the customer experi-the performance of the entire requestapplication environmenttime is needed to diagnose problems Prioritizehigh-valueareasforimprovement to optimize digitalcustomer experiences Innovatecontinuouslywithconfi-dence to outperform the competitionthe challenges of modern applicationenvironments. By deeply understandingNew Relic: A Quick Introduction to Distributed Tracing08
Gaining visibility into a massive data pipelineFleet Complete is the fastest-growing telematics provider in the world, serving more than 500,000 subscribers and 35,000 businesses in 17 countries, whileexperiencing tenfold growth in the past several years. It uses distributed tracingand other telemetry data to gain full visibility into its data-ingestion pipeline,which collects 1 billion data points every day.New Relic gave us all the insightswe needed—both globally andinto the different pieces of ourdistributed application. [As] wemove data across our distributedsystem, New Relic enables usto see where bottlenecks areoccurring as we call from serviceto service.— Muhamad SamjiArchitect, Fleet CompleteNew Relic: A Quick Introduction to Distributed Tracing09
How Does Distributed Tracing Work?Distributed tracing starts with instrumenting your environment toNew Relic is fully committed to supporting open standards for dis-enable data collection and correlation across the entire distrib-tributed tracing, so that your organization can ingest trace datauted system. After the data is collected, correlated, and analyzed,from any source, whether that’s open instrumentation or proprietaryyou can visualize it to see service dependencies, performance,agents. Learn more about New Relic’s support for OpenTelemetry,and any anomalous events such as errors or unusual latency.OpenCensus, and Istio.InstrumentationInstrumenting your microservices environment means addingcode to services to monitor and track trace data. Solutions such asNew Relic make it easy to instrument your applications for almostany programming language and framework. You can also use opensource tools and open instrumentation standards to instrumentyour environment. OpenTelemetry, part of the Cloud Native Computing Foundation (CNCF), is becoming the one standard for opensource instrumentation and telemetry collection. Projects suchas OpenCensus and Zipkin are also well established in the opensource community. Some service meshes, such as Istio, also emittrace telemetry data.New Relic: A Quick Introduction to Distributed Tracing10
Trace contextMetrics and metadataTo make the trace identifiable across all the different componentsA single trace typically captures data about:in your applications and systems, distributed tracing requirestrace context. This means assigning a unique ID to each request,assigning a unique ID to each step in a trace, encoding this con- Spans (service name, operation name, duration, and othermetadata)textual information, and passing (or propagating) the encoded Errorscontext from one service to the next as the request makes its way Duration of important operations within each service (such asthrough an application environment. This lets your distributedtracing tool correlate each step of a trace, in the correct order,along with other necessary information to monitor and track performance.W3C Trace Context is becoming the standard for propagatingtrace context across process boundaries. It lets all tracers andagents that conform to the standard participate in a trace, withtrace data propagated from the root service all the way to the terminal service. New Relic supports the W3C Trace Context standardfor distributed tracing.internal method calls and functions) Custom attributesAnalysis and visualizationCollecting trace data would be wasted if software teams didn’thave an easy way to analyze and visualize the data across complex architectures. A comprehensive observability platform allowsyour teams to see all of their telemetry and business data in oneplace. It also provides the context they need to quickly derivemeaning and take the right action, and work with the data in waysthat are meaningful to you and your business.New Relic: A Quick Introduction to Distributed Tracing11
When Do You Use Distributed Tracing?In general, distributed tracing is the best way for DevOps, operations, software, and site reliability engineers to get answers tospecific questions quickly in environments where the softwareis distributed—primarily, microservices and/or serverless architectures. As soon as a handful of microservices are involved ina request, it becomes essential to have a way to see how all thedifferent services are working together.This means that you should use distributed tracing when you wantto get answers to questions such as: What is the health of the services that make up a distributedsystem? What is the root cause of errors and defects within a distributed system? Where are performance bottlenecks that could impact thecustomer experience? Which services have problematic or inefficient code thatshould be prioritized for optimization?New Relic: A Quick Introduction to Distributed Tracing12
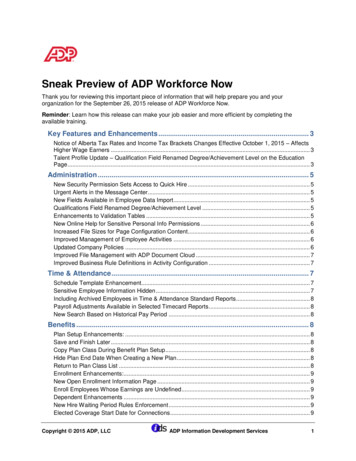
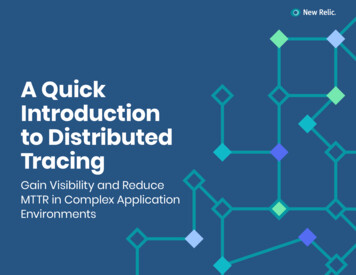
Why Is Sampling Important to Understand?As you can imagine, the volume of trace data can grow exponentially over time as the volume of requests increases and as more microservices are deployed within the environment. To manage the complexity and cost associated with transmitting and storing vast amounts oftrace data, organizations can store representative samples of the data for analysis instead of saving all the data.There are two approaches to sampling distributed traces:Sampling TypeAdvantages& Use CasesHead-based sampling makes the decision to collect andTail-based sampling makes the decision to sample the requeststore trace data randomly while the root (first) span iswhen it has completed and all information about that trace hasbeing processed.been collected. Works well for applications with lower throughput Works well for highly distributed, high-volume app environments Fast and simple to get up and running Captures and analyzes 100% of traces across a distributed system Works well with a blend of monoliths and microservices Observes every span within a request and then decides which Little-to-no impact on application performance Low-cost solution for sending trace data to third-partyvendors Random sampling can give sufficient visibility for sometraces are most useful to save Visualizes the most actionable data with errors, unusual latency,and anomalies Lets you ask deeper system questionssystemsConsiderations Traces are sampled randomly The sampling decision is made before traces have fullycompleted Traces with errors or unusual latency might be sampled out and missed Usually offered in on-premises distributed tracing solutions,which burdens you with deploying, managing, and scaling complex software Requires operational effort of planning for usage spikes, resiliency,cost, and scale for on-premises solutions Results in additional costs for transmitting and storing vastamounts of data for on-premises solutionsNew Relic: A Quick Introduction to Distributed Tracing13
A Mini-Glossary of Distributed Tracing TermsChild span: Subsequent spans after theyou understand why something is wrong,microservice or function. It’s a named,root span. Child spans can be nested.compared with monitoring, which simplytimed operation representing a piece oftells you when something is wrong.the workflow.sion to collect and store trace data isRequest: How applications, microservices,Tail-based sampling: Where the deci-made randomly while the root (first) spanand functions talk to one another.sion to sample is made after the full traceHead-based sampling: Where the deci-is being processed.Observability: In control theory, observability is a measure of how well internalstates of a system can be inferred fromknowledge of its external outputs. Observability involves gathering, visualizing, andanalyzing metrics, events, logs, and traces(MELT) to gain a holistic understanding ofa system’s operation. Observability letsRoot span: The first span in a trace.Sampling: Storing representative samples of tracing data for analysis insteadof saving all the data.Span: The primary building block of ainformation has been collected.Trace: The tracking and collecting ofdata about requests as they flow throughmicroservices as part of an end-to-enddistributed system. A trace is made up ofone or more spans.distributed trace, a span represents acall within a request, either to a separateNew Relic: A Quick Introduction to Distributed Tracing14
What’s Next?Now that you understand how valuable distributed tracing can be in helping you findissues in complex systems, you might be wondering how you can learn more about gettingstarted. Read the white paper, “Gain an Edge with Distributed Tracing.”New Relic: A Quick Introduction to Distributed Tracing15
2008-20 New Relic, Inc. All rights reserved. 06.2020
is how applications, microservices, and functions talk to one another. A . trace is performance data about requests as they flow . through microservices. A . span. represents operations or segments that are part of a trace. A . root span is the first span in a trace. A . child span. is a subsequent span which can be nested.