Transcription
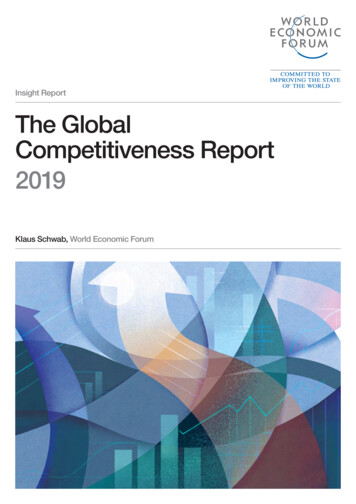
Insight ReportThe GlobalCompetitiveness Report2019Klaus Schwab, World Economic Forum
Insight ReportThe GlobalCompetitiveness Report2019Professor Klaus SchwabWorld Economic ForumEditor
World Economic Forum91-93 route de la CapiteCH-1223 Cologny/GenevaSwitzerlandTel.: 41 (0)22 869 1212Fax: 41 (0)22 786 2744E-mail: contact@weforum.orgwww.weforum.orgCopyright 2019by the World Economic ForumAll rights reserved. No part of this publication may bereproduced, stored in a retrieval system, or transmitted,in any form or by any means, electronic, mechanical,photocopying, or otherwise without the prior permissionof the World Economic Forum.ISBN-13: 978-2-940631-02-5The Report and an interactive data platform are availableat www.weforum.org/gcr.TERMS OF USE AND DISCLAIMERThe analysis presented in the Global Competitiveness Report 2019(herein: “Report”) is based on a methodology integrating the lateststatistics from international organizations and a survey of executives.The methodology, developed in collaboration with leading experts andpractitioners through a three-year consultative process, is designedto support countries to identify relevant policies and practices. Thefindings, interpretations, and conclusions expressed in this work do notnecessarily reflect the views of the World Economic Forum.The Report presents information and data that were compiledand/or collected by the World Economic Forum (all informationand data referred herein as “Data”). Data in this Report is subjectto change without notice. The terms country and nation as used inthis Report do not in all cases refer to a territorial entity that is a stateas understood by international law and practice. The terms coverwell-defined, geographically self-contained economic areas thatmay not be states but for which statistical data are maintained ona separate and independent basis.Although the World Economic Forum takes every reasonable stepto ensure that the Data thus compiled and/or collected is accuratelyreflected in this Report, the World Economic Forum, its agents,officers, and employees: (i) provide the Data “as is, as available” andwithout warranty of any kind, either express or implied, including,without limitation, warranties of merchantability, fitness for a particularpurpose and non-infringement; (ii) make no representations, expressor implied, as to the accuracy of the Data contained in this Reportor its suitability for any particular purpose; (iii) accept no liability forany use of the said Data or reliance placed on it, in particular, for anyinterpretation, decisions, or actions based on the Data in this Report.Other parties may have ownership interests in some of the Datacontained in this Report. The World Economic Forum in no wayrepresents or warrants that it owns or controls all rights in all Data,and the World Economic Forum will not be liable to users for anyclaims brought against users by third parties in connection with theiruse of any Data.The World Economic Forum, its agents, officers, and employeesdo not endorse or in any respect warrant any third-party productsor services by virtue of any Data, material, or content referred to orincluded in this Report. Users shall not infringe upon the integrity ofthe Data and in particular shall refrain from any act of alteration ofthe Data that intentionally affects its nature or accuracy. If the Data ismaterially transformed by the user, this must be stated explicitly alongwith the required source citation.For Data compiled by parties other than the World Economic Forum,as specified in Appendix A of this Report, users must refer tothese parties’ terms of use, in particular concerning the attribution,distribution, and reproduction of the Data.When Data for which the World Economic Forum is the source(herein “World Economic Forum”), as specified in Appendix A of thisReport, is distributed or reproduced, it must appear accurately andbe attributed to the World Economic Forum. This source attributionrequirement is attached to any use of Data, whether obtained directlyfrom the World Economic Forum or from a user.Users who make World Economic Forum Data available to otherusers through any type of distribution or download environment agreeto make reasonable efforts to communicate and promote complianceby their end users with these terms.Users who intend to sell World Economic Forum Data as part of adatabase or as a standalone product must first obtain the permissionfrom the World Economic Forum (gcp@weforum.org).
ContentsPrefacevby Klaus SchwabExecutive SummaryviiAt a Glance: The Global Competitiveness Index 4.0 2019 RankingsxiiiChapter 1: Global Findings1Chapter 2: Regional and Country Analysis11Chapter 3: Competitiveness, Equality and Sustainability—The Way Forward23Economy Profiles41How to Read the Economy ProfilesIndex of Economy ProfilesEconomy Profiles434546Appendix A: Global Competitiveness Index 4.0 Methodology and Technical Notes611Appendix B: The Executive Opinion Survey:The Voice of the Business Community633Contributors and Acknowledgements641Partner Institutes643The Global Competitiveness Report 2019 iii
PrefaceKLAUS SCHWABFounder and Executive Chairman, World Economic ForumGlobalization and the Fourth Industrial Revolutionhave created new opportunities but also disruptionand polarization within and between economies andsocieties. In this context, the World Economic Forumintroduced last year the new Global CompetitivenessIndex 4.0, a much-needed new economic compass,building on 40 years of experience of benchmarking thedrivers of long-term competitiveness.The index is an annual yardstick for policy-makersto look beyond short-term and reactionary measuresand to instead assess their progress against the fullset of factors that determine productivity. These areorganized into 12 pillars: Institutions; Infrastructure;ICT adoption; Macroeconomic stability; Health; Skills;Product market; Labour market; Financial system;Market size; Business dynamism; and Innovationcapability.The results of the GCI 4.0 in 2019 reveal that, onaverage, most economies continue to be far from thecompetitiveness “frontier”—the aggregate ideal acrossall factors of competitiveness. Performance is alsomixed across the 12 pillars of the index. The reportdemonstrates that 10 years on from the financial crisis,while central banks have injected nearly 10 trilliondollars into the global economy, productivity-enhancinginvestments such as new infrastructure, R&D andskills development in the current and future workforcehave been suboptimal. As monetary policies begin torun out of steam, it is crucial for economies to rely onfiscal policy, structural reforms and public incentives toallocate more resources towards the full range of factorsof productivity to fully leverage the new opportunitiesprovided by the Fourth Industrial Revolution.The report also looks to the future, specifically thetwo defining issues of the next decade—building sharedprosperity and managing the transition to a sustainableeconomy—and poses the question of their compatibilitywith competitiveness and growth. There is already aclear moral case for a focus on the environment and oninequality. The report demonstrates that there are noinherent trade-offs between economic growth and socialand environmental factors if we adopt a holistic andlonger-term approach. While few economies are currentlypursuing such an approach, it has become imperativefor all economies to develop new inclusive andsustainable pathways to economic growth if we are tomeet the Sustainable Development Goals. Boldleadership and proactive policy-making will be necessary,often in areas where economists and public policyprofessionals cannot provide evidence from the past. Thereport showcases the most promising emergingpathways, policies and incentives by identifying “win-win”spaces, but also points to the choices and decisions thatleaders must make in sequencing the journey towards thethree objectives of growth, inclusion and sustainability.At the World Economic Forum’s Platform forShaping the Future of the New Economy and Society,the home of The Global Competitiveness Report,over 200 leaders from business, government and civilsociety work together to deepen their understanding ofcomplex issues, shape new models and standards anddrive scalable, collaborative action for systemic changeon three deeply interconnected areas: growth andcompetitiveness; education, skills and work; and equalityand inclusion. By combining insight, models and actionthe Platform serves as an accelerator for emergingsolutions, pilots and partnerships. We invite leaders tojoin us to co-shape new solutions to the challengeshighlighted in this report, working together with theurgency and ambition that the current context demandsof us.I want to express my gratitude to the core projectteam involved in the production of this report: SophieBrown, Roberto Crotti, Thierry Geiger, Guillaume Hingel,Saadia Zahidi and other colleagues from the Platform forShaping the Future of the New Economy and Society.My deep gratitude goes to Professor Xavier Sala-iMartin for his guidance and to the experts, practitionersand governments who were consulted. Finally, wethank the 141 Partner Institutes, which help administerthe Executive Opinion Survey, whose results provideinvaluable data for the GCI 4.0 and other benchmarks.The Global Competitiveness Report is designedto help policy-makers, business leaders and otherstakeholders shape their economic strategies in theera of the Fourth Industrial Revolution. We hope it willalso serve as a call to action to engage in the visionaryand bold leadership required to build a new economicagenda for growing, sustainable and inclusive economiesthat provide opportunity for all.The Global Competitiveness Report 2019 v
Executive SummaryThe 2019 edition of The Global Competitiveness Reportseries, first launched in 1979, features the GlobalCompetitiveness Index 4.0 (GCI 4.0). As the decadeconcludes and we look towards the dawn of the 2020s,the GCI 4.0 offers insights into the economic prospectsof 141 economies. Drawing on these results, the reportprovides leads to unlock economic growth, whichremains crucial for improving living standards. In addition,in a special thematic chapter, the report explores therelationship between competitiveness, shared prosperityand environmental sustainability, showing that there isno inherent trade-off between building competitiveness,creating more equitable societies that provide opportunityfor all and transitioning to environmentally sustainablesystems. However, for a new inclusive and sustainablesystem, bold leadership and proactive policy-making willbe needed, often in areas where economists and publicpolicy professionals cannot provide evidence from thepast. The report reviews emerging and promising ‘winwin’ policy options to achieve the three objectives ofgrowth, inclusion and sustainability.The Global Competitiveness Index 4.0:An Economic Compass for Uncertain TimesIntroduced in 2018, the GCI 4.0 provides a detailedmap of the factors and attributes that drive productivity,growth and human development in the era of the FourthIndustrial Revolution. The 2019 edition covers 141economies, which account for 99% of the world’s GDP.The index is anchored in growth accountingeconomic literature and aims to measure the drivers of‘total factor productivity’ (TFP), the part of economicgrowth that is not explained by the growth in the factorsof production. TFP can be interpreted as how smartlythese factors are used and is the main determinant oflong-term economic growth. To put it simply, howefficiently units of labour and capital are combined forgenerating output.The GCI 4.0 is the product of an aggregation of 103individual indicators, derived from a combination of datafrom international organizations as well as from the WorldEconomic Forum’s Executive Opinion Survey. Indicatorsare organized into 12 ‘pillars’: Institutions; Infrastructure;ICT adoption; Macroeconomic stability; Health; Skills;Product market; Labour market; Financial system; Marketsize; Business dynamism; and Innovation capability.A country’s performance on the overall GCIresults as well as each of its components is reportedas a ‘progress score’ on a 0-to-100 scale, where 100represents the ‘frontier’, an ideal state where an issueceases to be a constraint to productivity growth. Eachcountry should aim to move closer to the frontier on eachcomponent of the index. The GCI 4.0 allows economiesto monitor progress over time. This approach emphasizesthat competitiveness is not a zero-sum game betweencountries—it is achievable for all countries.Global Findings and ImplicationsEnhancing competitiveness is still key forimproving living standardsSustained economic growth remains a critical pathwayout of poverty and a core driver of human development.In fact, there is overwhelming evidence that growth hasbeen the most effective way to lift people out of povertyand improve their quality of life. For least-developedcountries (LDCs) and emerging countries, economicgrowth is critical for expanding education, health,nutrition and survival across populations. With a decadeleft, the world is not on track to meet most of the 17United Nations’ Sustainable Development Goals by thedeadline of 2030. On Goal 8 (Decent Work and EconomicGrowth), LDCs have consistently missed the target of 7%growth since 2015. Extreme poverty reduction isdecelerating. At current pace, itis estimated that by 2030 the rate will stand at abouttwice the 3% target set in Goal 1. As of 2015, 46% of theworld’s population struggled to meet basic needs.Hunger is on the rise again and affects one in nine peoplein the world. The “zero hunger” target set by Goal 2 willalmost certainly be missed. It is clear that for most of thepast decade, growth has been subdued and hasremained below potential in many developing countries.Economic development is not a pre-determineddestiny. Pro-active efforts are needed to start and sustainthe development process. The GCI 4.0 highlights theprofound competitiveness deficit that needs to beurgently addressed to restore productivity and growth toimprove living standards.The Global Competitiveness Report 2019 vii
Executive SummaryThe global economy is ill-prepared for a downturnafter a lost decade for productivity-enhancingmeasuresPersistent weaknesses in the drivers of productivitygrowth, highlighted by the GCI 4.0, are among theprincipal culprits of the lacklustre performance andfrailty of the global economy over the past decade.Productivity growth started slowing down well before thefinancial crisis and had decelerated in its aftermath. Thefinancial crisis may have contributed to this decelerationthrough “productivity hysteresis”. Furthermore, beyondstrengthening financial system regulations, many of thestructural reforms designed to revive productivity did notmaterialize.The 2019 results of the GCI 4.0 reveal the size of theglobal competitiveness deficit. The average GCI scoreacross the 141 economies studied is 60.7, meaning thatthe ‘distance to the frontier’ stands at almost 40 points.On nine of the 12 pillars, the average gap globally standsat more than 30 points. Advanced economies performconsistently better than the rest of the world, but overall,they still fall 30 points short of the frontier. Singapore,the best performer overall, still falls 15 points short of theideal.While the predicted slowdown is unlikely to benearly as severe as the Great Recession of 2008–2009,policy-makers generally have fewer policy optionstoday than they did back then to stimulate aggregatedemand. Monetary policy may have run out steam andsome countries are facing a liquidity trap. Furthermore,the geopolitical context is more challenging than in2007, with gridlock in the international governancesystem, and escalating trade and geopolitical tensionsfuelling uncertainty, which holds back investments, andincreases the risk of supply shocks.Policy-makers must look beyond monetary policyto other policies, investments and incentives forreviving productivity growthSince the Great Recession, policy-makers have keptthe global economy afloat primarily through loose andunconventional monetary policy. But despite the massiveinjection of liquidity—four among the world’s majorcentral banks alone injected over 10 trillion between2008 and 2017—productivity growth has continued tostagnate over the past decade. Although loose monetarypolicy mitigated the negative effects of the globalfinancial crisis, it may have also contributed to reducingproductivity growth by encouraging capital misallocation.With extremely low (or even negative) interestrates and increasing capital constraints, banks havebecome less interested in lending to businesses andfavoured firms that were not credit-constrained ratherthan to credit-constrained ones that might have moreproductivity potential. Furthermore, over-reliance onmonetary policy, fiscal prudence, limited fiscal spaceand/or high levels of public debt have meant that fiscalviii The Global Competitiveness Report 2019policy has been underutilized and contributed to thesteady decline in public investments, despite the very lowborrowing costs.In this context, investment-led stimulus appears asan appropriate action to re-start growth in stagnatingadvanced economies. More specifically, fiscal policy thatprioritizes stimulating productivity-enhancing investmentsin infrastructure, human capital and R&D can indeed helpthe economy to return to a higher growth trajectory,complemented by structural reforms that make iteasier to innovate and enable responsible and inclusivebusinesses to thrive. In addition, a revived fiscal policythat incentivizes green investments could offer anopportunity to ‘de-carbonize’ the economy. Similarly,greater investment in social protection measures couldsupport the shift towards greater shared propserity.Finding a balance between technology integrationand human capital investments will be critical toenhancing productivityMaking technology and innovation part of an economy’sDNA is challenging in itself but governments mustalso account for enabling this change through humancapital investments and mitigating the unintendedadverse impacts of technological advancements onincome distribution and social cohesion through a holisticapproach. In the Schumpeterian process of“creative destruction”, creativity must be encouraged, andthe destruction must be managed. Increasedprecariousness of workers, the skills gap, excessivemarket concentration, corrosive effects on the socialfabric, regulatory loopholes, data privacy issues andcyberwarfare are all but a few of the potential negativeeffects that governments must mitigate.The GCI results show that technology governancehas not kept pace with innovation in most countries,including some of the largest and most innovative.Further, countries must improve talent adaptability; thatis, enable the ability of their workforces to contributeto the creative destruction process and cope with itsdisruptions. Talent adaptability also requires a wellfunctioning labour market that protects workers ratherthan jobs. The GCI 4.0 reveals that in several countrieswith significant innovation and technological capabilitiessuch as Korea, Rep., Italy, France and Japan, insufficienttalent development may increase the risk of negativesocial consequences. Emerging economies with growinginnovation capacity such as China, India and Brazil mustalso better balance technological integration and humancapital investments.Regional and Country AnalysisWith a 2019 GCI score of 84.8 out of 100, Singapore isthe country closest to the frontier of competitiveness. Thecountry ranks first in terms of infrastructure,health, labour market functioning and financial system
Executive Summarydevelopment. Going forward, in order to become aglobal innovation hub, Singapore will need to promoteentrepreneurship and further improve its skills base.Among the G20, the United States (2nd, down1 place), Japan (6th), Germany (7th, down 4) and theUnited Kingdom (9th, down 1) feature in the top 10,but they all have experienced erosion in theirperformance. So has Canada (14th, down 2). Korea(13th, up 2), France (15th, up 2) and Italy (30th, up 1)are the only advanced economies to improve this year.Argentina (83rd, down 2 places) is the lowest ranked.Among the BRICS, China is by far the best performer,ahead of the Russian Federation, 32 places ahead ofSouth Africa (60th) and some 40 places ahead of bothIndia (68th) and Brazil (71st).Led by Singapore, the East Asia and the Pacificregion is the most competitive in the world, followed byEurope and North America. Hong Kong SAR (3rd) andJapan (6th) also feature in the top 10. Viet Nam (67th) isthe country whose score improves the most globally. Butthe region is also home to economies with significantcompetitiveness deficits, such as Cambodia (106th) andLao PDR (113th).The United States (2nd overall) is the leader inEurope and North America. Despite dropping oneposition it remains an innovation powerhouse, ranking1st for business dynamism and 2nd for innovationcapability. The Netherlands (4th), Switzerland (5th),Germany (7th), Sweden (8th), the United Kingdom (9th)and Denmark (10th) all feature in the top 10. The region’smost improved country is Croatia (63rd).In Latin America and the Caribbean, Chile (33rd)is the most competitive economy thanks to a stablemacroeconomic context (1st, with other 32 economies)and open markets (68.0, 10th). It is followed by Mexico(48th), Uruguay (54th), and Colombia (57th). Brazil,despite being the most improved economy in the regionis 71st; while Venezuela (133rd, down 6 places) and Haiti(138th) close out the region.In Middle East and North Africa, Israel (20th) and theUnited Arab Emirates (25th) lead, followed by Qatar (29th)and Saudi Arabia (36th); Kuwait is the most improvedin the region (46th, up 8 places) while Iran (99th) andYemen (140th) lose some ground. The region has caughtup significantly on ICT adoption and many countriesboast well developed infrastructure. Greater investmentsin human capital, however, are needed to transform thecountries in the region into more diversified, innovativeand creative economies.Eurasia’s competitiveness rankings see the RussianFederation (43rd) on top, followed by Kazakhstan (55th)and Azerbaijan (58th), both improving their performanceover 2018. Focusing on financial development andinnovation capability would help the region to achieve ahigher competitiveness performance and advance theprocess towards structural change.In South Asia, India, in 68th position, loses ground inthe rankings despite a relatively stable score, mostly dueto faster improvements of several countries previouslyranked lower. It is followed by Sri Lanka (the mostimproved country in the region at 84th), Bangladesh(105th), Nepal (108th) and Pakistan (110th).Led by Mauritius (52nd), sub-Saharan Africa isoverall the least competitive region, with 25 of the 34economies assessed this year scoring below 50. SouthAfrica, the second most competitive in the region,improves to the 60th position, while Namibia (94th),Rwanda (100th), Uganda (115th) and Guinea (122nd) allimprove significantly. Among the other large economiesin the region, Kenya (95th) and Nigeria (116th) alsoimprove their performances, but lose some positions,overcome by faster climbers. On a positive note, ofthe 25 countries that have improved their Health pillarscore by two points or more, 14 are from sub-SaharanAfrica, making strides to close the gaps in healthy lifeexpectancy.Competitiveness, Equality and Sustainability—The Way ForwardDecades of focus on economic growth without equalfocus on making growth inclusive and environmentallysustainable are having dire consequences for the planetand humankind. Accelerating climate change is alreadyaffecting hundreds of millions around the world, andit is likely that people under 60 will witness its radicaldestabilizing effects on Earth. In parallel, rising inequality,precarity and lack of social mobility are underminingsocial cohesion with a growing sense of unfairness,perceived loss of identity and dignity, weakening socialfabric, eroding trust in institutions, disenchantment withpolitical processes and an erosion of the social contract.It has become clear that environmental, socialand economic agendas can no longer be pursuedseparately and in parallel: they must be merged into asingle sustainable and inclusive growth agenda. In thisapproach, the perceived trade-offs between economic,social and environmental factors can be mitigatedby adopting a holistic and longer-term approach togrowth. This implies addressing the spillover effectsand externalities, positive and negative, intended orunintended, of economic policies beyond the directobjectives they pursue.The very different degrees and speeds at whichcountries are adopting such holistic approach to growthare reflected in the fact that countries at similar levelsof competitiveness achieve very different environmentaland social outcomes. For example, Sweden, Denmarkand Finland have not only become among the world’smost technologically advanced, innovative and dynamiceconomies in the world, but are also providing betterThe Global Competitiveness Report 2019 ix
Executive Summaryliving conditions and better social protection, are morecohesive and more sustainable than their peers.Sustainability, growth and competitivenessWhile the traditional narrative has focused on thetrade-offs between growth and sustainable practices,there is emerging evidence that failing to address theenvironmental tipping points will affect productivity.Environmental-driven TFP losses may even outweighthe costs associated with transitioning to a low-carboneconomy; for example, climate change is resulting inlower agriculture productivity, more capital depreciationdue to infrastructure damage, and a fall in both laboursupply and workers’ output due to higher temperatures.Additionally, exposure to chemicals and air pollutionincreases the incidence of non-communicable diseasesand mortality rates.Furthermore, constraints to specific renewable andnon-renewable inputs such as energy and water mayhave also important productivity spillover effects. Despiteincreasingly efficient electric vehicles, growing installedcapacity of solar and wind farms and energy-savingappliances, non-renewable resources still account forover 80% of global energy consumption. In the shortrun, a lack of alternatives to meet the global demandfor energy, a push towards non-fuel energy may leadto an increase in production costs in most sectors andhurt productivity. Finally, episodes of water shortagehave proven to have an extremely negative effect onproductivity in agriculture, as well as for smelting,chemical and mining activities.To some extent, more competitive economies arebetter positioned to transition to a low-carbon economy.For instance, they typically boast greater innovationcapability and are therefore more likely to come upwith breakthrough green technology. In addition,countries with stronger human capital, better developedinfrastructure and greater innovation capacity are, onaverage, more likely to adopt a greener energy mix.But success will depend on policy choices ultimately.Here are four areas for policy intervention towards moresustainable growth: Openness and international collaboration.Sustainability issues are a global problem. Nocountry can manage environmental challengeswith national policies only. It is essential that, evenin a context of trade tensions and diminishedcommitment to international governance systems,countries discuss shared solutions to climatechange and the transition to a low-footprint globaleconomy. Carbon taxes and subsidies. The prices of carbonintensive products do not fully reflect their truex The Global Competitiveness Report 2019cost because of unaccounted externalities anddistortions from energy subsidies. Efforts totax emissions and phase out subsidies remaininsufficient. Seventy-six percent of emissions are stillnot subject to carbon pricing. Phasing out subsidiesto fossil fuels and implementing bolder carbonpricing schemes must be paired with measures thatminimize the potential social costs of these reforms.Externality-adjusted prices could potentially furtheraccelerate the re-allocation of investment towardsgreen projects. Incentives for green R&D. Renewable energytechnologies still need to overcome technicallimitations that prevent them from becoming themain and possibly the sole source of energy in thefuture. These limitations and the continuous increasein demand explain why fossil fuels still account forabout 80% of total energy consumption, despitethe significant decrease in the cost of electricityproduction from renewable resources. Moreinvestments in research are needed to overcomethese technical limitations and develop newtechnologies. Tax incentives and/or direct publicinvestments can boost these efforts. Green public procurement. Public procurementcan sustain markets for innovative products aswell as for sustainable products or services.Some countries have already started to introduceenvironmental standards in technical specifications,procurement selection and award criteria, andhave inserted environmental performance clausesinto contracts. Despite potential implementationchallenges, green public procurement can signal amajor policy shift and break from the lock-in effectsof status-quo technologies and production models.Shared prosperity, growth and competitivenessOver the past few decades, income inequality hasincreased in both advanced and emerging economies.Growth and shared prosperity started to decouple inmost of the advanced economies in the 1970s andhave further diverged since the early 2000s. Similarly, indeveloping and emerging economies, growth has beenaccompanied by a signif
society work together to deepen their understanding of complex issues, shape new models and standards and drive scalable, collaborative action for systemic change on three deeply interconnected areas: growth and competitiveness; education, skills and work; and equality and inclusion. By combining insight, models and action

