Transcription
UNIVERSITY OF NORTH TEXASDepartment of GeographyGEOG 4220/5220: Applied Retail GeographyGIS Lab, Part 2: Advanced GIS Locationand Market AssessmentIn this second part of your applied assignment, we will use advanced GIS analysis capabilitiesfrom the BA Web software package to provide site and market insights for restaurant locationplanning at a broader, regional level. The instructions below pick up where Part 1 of the assignmentleft off (Task 5), so the analysis in Part 2 begins with Task 6.The scenario: you are continuing in your job as market analyst for Pei Wei Asian Diner. Yourassignment now is to analyze Pei Wei restaurant network in the entire Dallas-Fort Worth regionand compare this network with the restaurant network of Chipotle Mexican Grill in particular.Recent survey and focus group research that Pei Wei has done has indicated that Chipotle is aparticularly important competitor for Pei Wei in North Texas.As noted earlier, Chipotle is not a direct competitor for Pei Wei (their menu is considerablydifferent from Pei Wei), but Pei Wei competitor analysis indicates that both chains compete withinthe national casual dining sector and appeal to very similar market types. Your objective in thisregional analysis is to draw insights from a GIS assessment of Pei Wei current regional operationsand Chipotle’s competitor locations that could help Pei Wei formulate locational strategies to guideits next best moves in North Texas.As in Applied Assignment Part 1, please provide “rough note” results or answers (using completesentences) or other material (maps, graphics) for anything highlighted as a “rough notes step”.Also, please label each of these responses using the task and step number associated with thebolded question you are answering – e.g. “Task 1, Step 1a”. Many steps do not require a writtenresponse, but you still might need to save a map or report produced in some steps. Also, pleasenote that most steps do not require that you record anything at all, although you will still need tocomplete every step in order to complete the exercise.For this second phase of the project, we will again be using the Esri Business Analyst Web softwareto provide GIS analytical support.Assignment Credit: Dr. Murray Rice created part 2 of this applied assignment using the Business Analyst Web GISpackage and its associated data resources.1
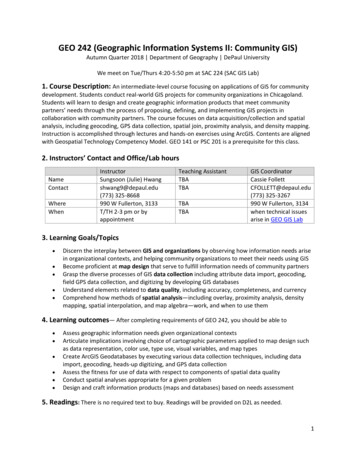
Task 5: General Restaurant Market Orientation in D-FWYou will begin your search by creating a project to contain your new maps and analysis. Then youwill create a map to look at Dallas-Fort Worth, classified by dining out spending potential. Youwill also build current restaurant location information into your analysis. Lastly, you will analyzea combination of variables to help you highlight high-potential zones for new Pei Wei restaurants.Before you begin the following make sure you have logged in to BA Web and are ready to createa new project.1. In BA Web, create a new project using the “Create Project” button that appears after youlog in. Use the project name “DFW Dining Part 2”.2. Open the newly created project, and close the Project Manager pane at left. After the projectis opened, you can begin your market analysis.3. At the top right of the page, verify once again that the country dataset used is USA.4. In the search field at the top right, verify that “Zoom To An Area” is the search optionselected in the drop-down list. Type “Dallas, TX” and press Enter.Click toactivate thedrop-downlistThis search displays the city of Dallas.2
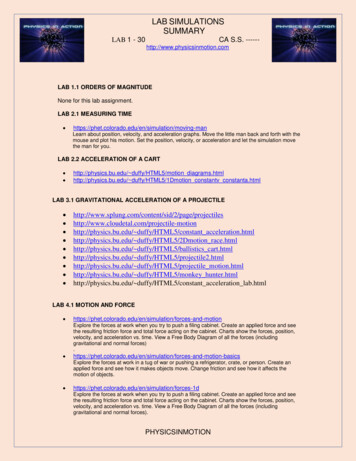
5. Pan out a little and recenter your map so the entire Dallas-Fort Worth Metroplex area isshown, something like the below (you do not need an exact match on your screen; theimportant thing is to display a map that covers the approximate area represented below).You now have a base map you can use to evaluate the potential for restaurantdevelopment across the Dallas-Fort Worth area.6. Now at the top of your BA Web screen, on the “Maps” tab, click “Create Maps” and thenchoose the “Color-Coded Maps” option that appears after that.3
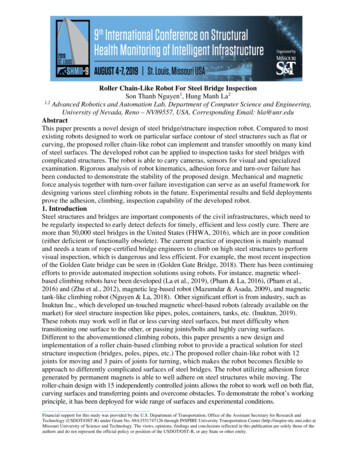
7. You want your D-FW map to show dining out potential. In the search field of the ColorCoded Maps pane on the left, type “dining out”.8. A “data browser” guide comes up with the available data fields that match your searchterms most closely.a. The display provides an initial, simple grid of variable options for the current year andthe current year plus 5 years. Select the current year set of variables.4
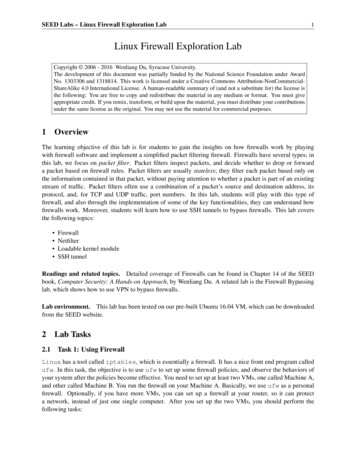
b. This will give you a more detailed list of variables to select from. From the availableoptions, the “Food Away from Home – Lunch” fits your Pei Wei project needs mostclosely. Select “Index” (far right of line) and click on the data field name to proceed(BA Web will start drawing a map of this variable theme as soon as you click on thevariable label).9. Rough Notes Step: You can pan and zoom the map as you like. When you are happywith the map, save it as a JPG file (filename “task5step9.jpg”). Yours should looksomething like the one shown below (yours might not be exactly the same as this, andit does not need to be).Describe the map pattern you see of “Food Away from Home – Lunch” index values.In a general sense, across the D-FW metroplex, where are the highest locations of“Food Away from Home – Lunch” index values? Where are the lowest values? Use afew place names for orientation, and limit your discussion to 3 to 5 sentences.5
Task 6: Adding Restaurant Sites to the AnalysisYour next step is to add current restaurant sites to the analysis to visualize the extent of servicecurrently provided by Pei Wei and Chipotle to provide additional analytical context.1. With your current “Food Away from Home – Lunch” theme still displayed, move toincorporate restaurant locations by clicking on “Add Data” and “Import File”.2. The import file dialogue gives you the option to import either an Excel file of address datafor BA Web to map, or a Shapefile that contains location data that has already been mapped.We have restaurant address data for BA Web to map, so click “Browse ” here to searchfor your Excel data files.6
3. On your CSAM computer, you will find the Excel Pei Wei address file you need in the“Class” drive, “4220” / “AA2” subdirectory. Clicking on the “chipotle.xlsx” file will placethe file in your import dialogue ready to upload. Click on “Import” to read this locationdata into BA Web.4. BA Web will then give you the opportunity to confirma. The type of data being imported (point data, versus geographic boundaries). Thisfile is point location data, so select that option and click “Next”.b. After that, BA Web will ask you to confirm the input data fields needed for mapping(Address, City, etc.). You should see BA Web make the following choices below,which are correct. If these are all set, you can click “Next” again.7
5. This will result in the display of a new D-FW map, but before you examine it, take time toun-check the “Cluster points” option so every restaurant location is represented by a locatorsymbol (make sure there is no check mark in this box).6. Rough Notes Step: Your map should now look something like the one shown below(yours might not look exactly the same as this, and it does not need to be). Save theChipotle map as a JPG file (filename “task6step6.jpg”).7. Rough Notes Step: Comment on the relationship between the geographic distributionof Chipotle locations (point symbol theme) and the distribution of “Food Away fromHome – Lunch” spending (area color theme). Use 3-5 sentences.8
8. Rough Notes Step: Repeat steps 1 to 7 for the Pei Wei restaurant address file. Youwill need to click the “Back” button in the Import dialogue a few times, which willremove the Chipotle locations from your map (so be sure to save an image of yourChipotle map before you do this). When you have completed the new Pei Wei map,save it as “task6step8.jpg”.a. Comment on the relationship between the geographic distribution of Chipotlelocations and the distribution of “Food Away from Home – Lunch” spending.b. How similar and how different are the Pei Wei and Chipotle restaurantnetworks from each other?c. Note one specific comparison: how many Pei Wei locations are there inDenton, versus how many Chipotle locations?9
Task 7: Adding Multiple Market Variables to the AnalysisYour next step is to add two additional market variables to your maps to refine your view of theD-FW restaurant market for Pei Wei expansion. Pei Wei’s market research has led seniormanagement to target a specific age and income demographic for their future restaurant expansion.A. Age target: 30-40 years of ageB. Income target: 50,000 to 74,999 annual incomeThe steps in this task show how BA Web can help to geographically identify the D-FW marketsthat best fit these or other criteria.1. From the Maps tab, click Create Maps from Data, then click Smart Map Search.2. Smart Map Search gives us the ability to use up to five variables in a target market analysis.10
3. Click on the “Age” Category icon (shown in the step 2 “Smart Map Search” graphic at thebottom of the previous page) and click on “2019 Median Age (Esri)” in the “PopularVariables” box. This will add median age as the first target variable to the analysis.4. Click on the “Back” button to display the full range of data categories again. Now, selectthe Income category for variable selection, which will give this dialogue. However, ratherthan selecting from the three highlighted variables in the “Popular Variables” space, wewill choose to find what other choices are available under “Disposable Income”:11
5. Searching under disposable income gives us this dialogue of additional variables toconsider. Click on the “2019 Disposable Income (Esri)” category, which will result in anew list of disposable income range variables appearing. From this detailed income list,select “2019 Disposable Income 50,000 to 74,999 (Esri)” and click the “%” tab for thisvariable, as shown below:6. With these two variables selected (an age variable, and an income variable), click on“apply”, which will give us a new and extremely powerful map tool:Every census tract on this map is currently selected (highlighted in light blue), as the mapselection criteria start with a broad range: no census tract is omitted. However, use of theslider variables in the “median age” and “disposable income” boxes (“Smart Map Search”,the part of the screen outlined in red at left) gives us the capability of narrowing ourselection criteria for each variable so only the most suitable census tracts remain.12
7. Try playing with this capability: try dragging the data limits in the median age data graphto narrow the range of census tracts highlighted on the map. Do the same, playing with thedata limits in the disposable income data graph. Get a sense of what this filtering capabilitydoes to the map as you adjust your limits.8. When you have a good idea of how this capability operates, try setting the following datalimits:A. Median Age (#): 32 to 40 (or as close as you can move the sliders to thesevalues)B. Disposable Income (%): 18 to 26% (or again, as close as you can move thesliders to these values)You should have a map now that looks something like the below:9. Rough Notes Step: Save the target market map as it stands now as a JPG file (filename“task7step9.jpg”). Comment on the map as you see it here: What does this map mean in a general sense? What is the significance of the census tracts you see selected? (recallthat these fit the given age and income criteria) What meaning is added to the map by placing the Pei Wei locations onthis same map with the census tract selection? How does each locationrelate to the census tracts displayed around it?Take 2-3 sentences to address each of these three sub-questions.13
Putting It All Together: The GIS Lab Final Report (Covering Parts1 and 2)Now is the time to make sense of the evidence you have assembled so far for the entire GIS Lab(including work completed in both part 1 and part 2). Remember that the “Common Features ofApplied Assignments in GEOG 4220/5220” document specifies that your final report needs toinclude the following components (please label each clearly as sections in your report):1.2.3.4.5.Exercise scenarioQuestion to be solvedAnalytical approaches usedResults obtainedApplicationAs you prepare to write this report, review the steps you took for each analysis and all of yourrough notes. Consider the following as you prepare to write the application section of your finalreport:1. Take time to carefully examine the entire set of evidence you gathered from both part 1and part 2 of this applied assignment: your pre-analysis reflections (task 1), fieldobservations (tasks 2 and 3), and your GIS analysis (tasks 4, 5, 6, and 7). Make note of themajor products you produced in each section (maps and reports), as well as yourobservations (answers to all questions in all tasks 1-7).2. Your “results obtained” discussion should summarize the most important findings of allthat you have uncovered throughout tasks 1-7.3. Your “application” discussion should provide your bottom-line recommendation: whichfactors and evidence are most important from tasks 1-7, what does this collective evidencetell you, and how does that take you to a recommendation as to what locational strategyPei Wei should be pursuing in Denton and the overall D-FW market?14
To Submit this GIS Lab Final Report:1. Ensure all of your rough note question responses (for all steps highlighted in bold) aretyped into a single Word document named “Part2-RoughNotes.docx”. Please place yourresponses in order (by task and step number) within this file. Each question response shouldbegin with a heading giving the task and step number to which the response refers (e.g.“Task 5, Step 9”).2. Collect all of the map attachments requested in this part of the assignment (from the stepswhere you were asked to save a file, and you were given a file name to save under).3. Complete your final report and save in a single Word document named “Part2FinalReport.docx”.4. Attach all of the above material (your questions responses, your map and reportattachments) to a single e-mail to be sent to my special assignment submission emailaddress (rice@unt.edu). Please make the e-mail subject line “Your last name – Part 2”(e.g. “Smith – Part 2”).15
D-FW restaurant market for Pei Wei expansion. Pei Wei’s market research has led senior management to target a specific age and income demographic for their future restaurant expansion. A. Age target: 30-40 years of age B. Income