Transcription
Introduction to GISUsing ArcGIS Desktop 10Last Modified: January 2012
This reference and training manual was produced bythe University of Maryland Libraries.Permission to reproduce this manual or any of its parts for non-commercial, educational purposes isgranted. Appropriate citation is appreciated.University of Maryland LibrariesU.S. Government Information, Maps & GIS ServicesMcKeldin Library, Room 4118College Park, MD 20742-7011www.lib.umd.edu/GOV/
Table of ContentsGIS Facilities at the University of Maryland . 1Introduction . 2Components of ArcGIS Desktop 10 . 3ArcCatalog . 4ArcMap . 8Symbology and Labeling . .18Performing Analysis in the Map Display . 27Queries . 35Layouts . 40More Training . 44
GIS Facilities at the University of MarylandMcKeldin LibraryThere are two GIS workstations located in the Government Documents GIS & Computer Lab onthe fourth floor of McKeldin Library. They are available on a walk-in basis when the Library isopen. In addition, there are available datasets for other parts of the world including suburbanMaryland; Washington, DC; the Washington Metropolitan Area; Europe; etc. Color printing isavailable in McKeldin Library.The instruction labs on the sixth floor of McKeldin Library (6101, 6103, and 6107) are restrictedaccess during the earlier part of the semester, but open to the public during the later part ofthe semester. ArcGIS software is installed on all computers in these labs, and can be used whenthey are open. Please see the following website for more information on the instruction labs:http://www.lib.umd.edu/UES/labs.htmlOther FacilitiesThere are other departmental (e.g., anthropology, architecture/urban planning, civilengineering, landscape architecture, and geography) GIS laboratories on campus that arerestricted to faculty, staff, and students in each of those disciplines. Additionally, the Office ofInformation Technology's software licensing program (http://www.oit.umd.edu/slic) offersArcGIS and ArcInfo for various platforms at special/reduced rates for faculty and staff at theUniversity of Maryland.1
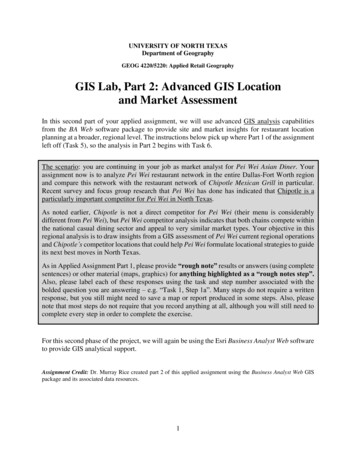
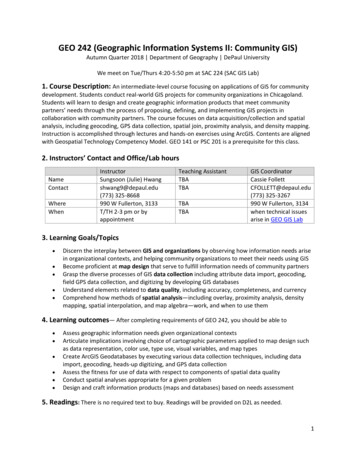
IntroductionA GIS (Geographic Information System) is a powerful tool used for computerized mapping andspatial analysis. A GIS provides functionality to capture, store, query, analyze, display andoutput geographic information.For this seminar we will be using ArcGIS Desktop 10, the newest version of a popular GISsoftware produced by ESRI. This course is meant to teach some fundamental GIS operationsusing ArcGIS. It is not meant to be a comprehensive course in GIS or ArcGIS. However, we hopethis seminar will get you started using GIS and excited about learning more.Definition of GIS(Geographic Information System)A computer-based systemthat stores geographicallyreferenced data, links itwith non-graphic attributes(data in tables) allowing fora wide range of informationprocessing includingmanipulation, analysis andmodeling. A GIS alsoprovides for map displayand production.2Data Model of RealityGraphic Source: ESRI, Inc.
Components of ArcGIS Desktop 10ArcMap, ArcCatalog, (and ArcToolbox)ArcGIS Desktop is comprised of a set of integrated applications, which are accessible from theStart menu of your computer: ArcMap and ArcCatalog. ArcMap is the main mapping application which allows you to create maps, queryattributes, analyze spatial relationships, and layout final projects. ArcCatalog organizes spatial data contained on your computer and various otherlocations and allows for you to search, preview, and add data to ArcMap as well asmanage metadata and set up address locator services (geocoding). ArcToolbox is the third application of ArcGIS Desktop. Although it is not accessible fromthe Start menu, it is easily accessed and used within ArcMap and ArcCatalog. ArcToolboxcontains tools for geoprocessing, data conversion, coordinate systems, projections, andmore. This workbook will focus on ArcMap and ArcCatalog.Software Products (Licensing Levels)ArcMap is made up of three software product levels: ArcView, ArcEditor, and ArcInfo. Theseproducts share a common architecture but provide increasing levels of functionality. ArcViewprovides the base mapping and analysis tools. ArcEditor provides all ArcView capability andincludes additional processing and advanced editing. ArcInfo provides all ArcEditor capabilityplus advanced analysis and processing. While these levels are crucial to consider whenpurchasing software, it is also important to be aware of the limitations of the level you areusing. We are using the ArcInfo level.Look at the menu bar at the top of the window in either ArcMap or ArcCatalog to see which level youhave.3
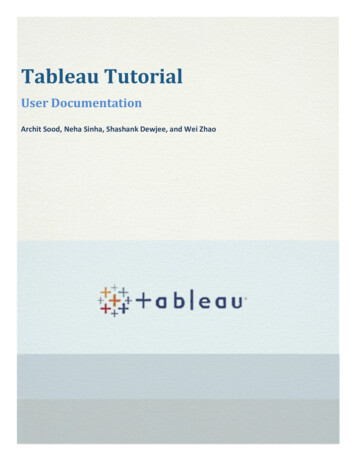
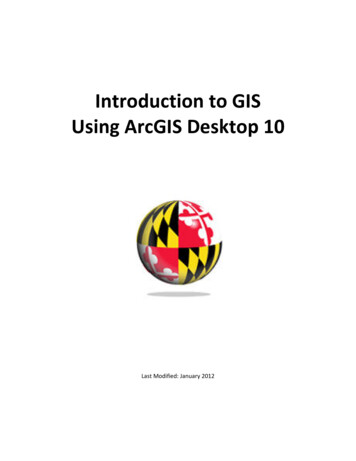
Data Management – ArcCatalogSearching and ContentFinding and using data is at the center of any GIS project. Let’s get started by openingArcCatalog:1. Double-click with the left mouse button on the ArcCatalog icon on the desktop, or from theWindows Start menu, select ‘Programs’ ‘ARCGIS’ ‘ArcCatalog’After opening the software, you will be greeted by screen like this one:The left side of the screen lists a set of possible locations for data in the Catalog Tree. Don’tworry if yours does not look exactly the same. It is easy to add directories for data by clicking onthe ‘Connect to folder’ icon on the top left toolbar.4
Common GIS File TypesTECHTALKGeodatabase – The personal geodatabase, or geographic database, file is called the “moderncontainer for GIS data” and is specific to ArcGIS. Geodatabases define, manage, process andstore all the types of data that can be used in ArcGIS (i.e., feature, rasters, relationships,measurements, attributes, etc) inside either a Microsoft Access database (.mdb) or a fullrelational database (SQL Server, Oracle, Informix or DB2).Shapefiles – ArcGIS shapefile format is a widely adopted standard and comprises three ormore associated files. Be careful copying this data to a disk. You must get all of the filesassociated with a single layer. They will have a variety of file extensions: .shp, .shx, .dbf andsometimes others. If you are copying shapefiles, we recommended that you use the ‘File’ ‘Data’ ‘Export Data’ function in ArcMap or through ArcCatalog. This will automaticallycopy all files associated with a layer. Also, be aware that some of these files may be very largein size.Layer – According to ESRI, the layer file (.lyr) stores symbology, symbology classifications,labeling properties, scale dependency, and definition. If you save something in this format itmeans that, unlike shapefiles, colors and other characteristics are saved and will appear thesame every time you open it.Coverages – “A coverage stores a set of thematically associated data considered to be a unit. Itusually represents a single layer, such as soils, streams, roads, or land use. In a coverage,features are stored as both primary features (points, arcs, polygons) and secondary features(tics, links, annotation).” Source: ESRI Data Dictionary.CAD (computer-aided design) – “A computer-based system for the design, drafting, anddisplay of graphical information.” Although most commonly used to support engineering,planning, and illustrating activities, these files can be used in a GIS. Source: ESRI DataDictionary.Image formats – ArcGIS accepts and uses a variety of image files (.tiff, .jpg, .jp2, .png, etc).Text files (with x,y coordinates)Many others 5
ArcGIS TerminologyTermViewDefinitiona collection of themesExampleWashington, DCThemea single layer of dataHousingAttributea defined characteristic of athemeYear BuiltValuea specific quality or quantity 1920assigned to an attribute, fora specific instance.Previewing DataFrom the catalog tree on the left side, navigate to C:\ESRI\GIS WRKSHP\. You will see a list ofshapefiles. The .shp extension of the file means that these files are in shapefile format and thuscan be read by ArcGIS. Although this is not the only file format ArcGIS can read, it is a popularformat.1. To view file extensions, navigate to ‘Customize’ ‘ArcCatalog Options’ and under the‘General’ tab unclick ‘Hide file extensions’ and hit ‘OK’.6
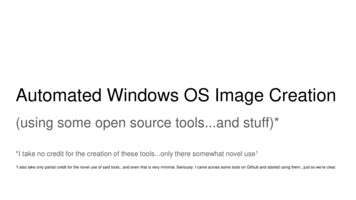
NOTE: This is what shapefiles look like in Windows Explorer – a combination of 3 to 7 individual filesmake up one shapefile. You should view GIS data in ArcCatalog.TECHTALKThere are two kinds of data that can be viewed in ArcGIS – vector and raster. Vector data isa format whereby points, lines, and polygons are used to represent real features on theearth’s surface such as an address location, a street or a zip code area. Raster data is acontinuous image of a portion of the earth’s surface and is made up of grid cells or pixels asin an aerial or satellite image. If both vector data and raster data are georeferenced to thesame position, they can be used in the same view.2. After locating data, it is possible to preview it before adding it to ArcMap. Click once withthe left mouse button on mdcounties.shp and then select the ‘Preview’ tab.This will allow you to look at the mdcounties file. We will return to these files later.MetadataMetadata is loosely defined as “data about data.” This is important, especially in a geospatialcontext, because it contains information about the source, author, creation, and geographicreferencing. ArcCatalog allows you to view and manage metadata.1.Click on the ‘Description’ tab.This section provides a description of the files,spatial information, and a list of all of the attributesassociated with the file.7
Organization of ArcMapArcMap can be opened from multiple locations. This time, we will open it from ArcCatalog. Itcan also be opened from the start menu or an icon on the desktop.Beginning with a Blank Project1. From ArcCatalog, click on the ArcMap icon:Upon opening ArcMap you may see the following startup window:This is a new feature with version 10 of ArcGIS software that allows you to make a shortcut toyour most-used data location. Since we’re just beginning, we are going to skip this option andsimply use the default. Click on Cancel.ArcMap makes a default geodatabase in the C:\My Documents\ArcGIS folder.8
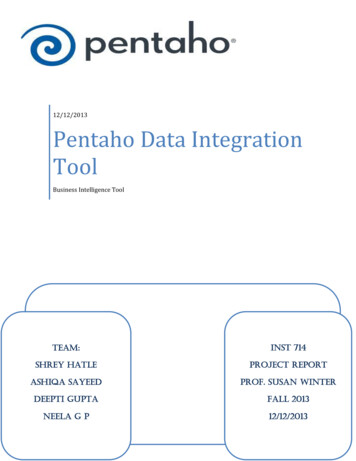
Now you will be in a new, blank document in ArcMap.This area is known as the Map Display. This display area is where map features are drawn.Menu BarBasicToolbarMap DisplayTable of ContentsWhen you begin, the menu bar changes to show the menu functions available. You can changethe way the ArcMap looks by moving or hiding toolbars. Docking toolbars in another locationcan be done by clicking on the vertical gray bar at the left edge or top and dragging it to a newlocation.To hide or show toolbars, click ‘Customize’ (on the menu bar) ‘Toolbars’ and check or uncheck thename.Any changes made to the interface will be kept and applied every time you use ArcMap. Pleasenote that some toolbars are dependent upon the license level. Some toolbars and extensionswill be visible, but the user will not be able to access the functionality if they do not possess therequired license.At this point, most of the icons of the button bar and tool bar are grayed out because we do nothave any data in our view. Let’s add data to see what functions are available to us.9
Adding Data through ArcCatalogThere are two main ways to add data. We will begin with adding two data files – md cities.shpand md interst.shp – from ArcCatalog.1. Click on the ‘ArcCatalog’ tab icon at the top right of the display. You will see the catalog tree.2. Navigate to the data you want to add. For us, that is under Folder ConnectionsC:\ESRI\GIS WRKSHP3. We will add two layers: md interst and md counties. Drag and drop it into the Table ofContents under Layers.10
Adding Data through ArcMapIn addition to ArcCatalog, it is possible to add data directly through ArcMap.1. Select the ‘Add Data’ button.If you selected the drop-down, choose the firstoption, Add Data. Or, from the menu bar, select ‘File’ ‘Add Data’ ‘Add Data’.2. Change directories until you find C:\ESRI\GIS WRKSHP\3. Select md cities.shp and click the ‘Add’ button.On the left-hand side of the view the three selected layers are displayed in the view’s table ofcontents. Each layer has a little check mark in the box to its left. This means they are “turnedon” and being displayed. If you uncheck them, that layer is no longer visible.The colors of your layers and their order may differ from the example on the instructor’sscreen, but you should have all three datasets. Each of these layers contains geometric objectsthat represent some real world entity. Points are used in the md cities layer to representMaryland cities. (At a larger scale cities could be represented by polygons.) Lines are used in themd interst layer to represent the interstate highways in Maryland, and polygons are used inthe mdcounties layer to represent Maryland counties.Notice how most of the button and tool bar functions are available to us now. Also notice thescale display next to the Add Data button.This display tells you what the scale value is of the current view. If it displays the value ‘1:2,922,847’ that means that every one unit on the map is equal to 2,922,847 units in the realworld. As you zoom in and out of the map the scale will change dynamically. Scale is animportant concept in computer mapping. The scale of the map often determines the amount ofinformation that can be shown without the map becoming too busy.11
Also notice the position display at the bottom right of the screen. As you move the cursoraround the view these units change dynamically according to your cursor’s position. Your mapunits are likely in decimal degrees.Moving Around the Map DisplayNow let’s examine ways of zooming in and out and panning. The Tools toolbar contains eightbuttons that provide zooming functions and allow you to define a custom view of the layerdata. Some of the most useful ones are illustrated here.Zoom In – zooms the view window in to a user-defined area. To use:1.Select the Zoom In tool with the left mouse button. Notice the cursor changes to themagnifying glass with the sign icon.2.3.Go to one corner of the area you would like to zoom in on and click with the left mousebutton. While holding down the mouse button, move the cursor to the opposite corner thatdefines the area you want to magnify.Release the mouse and the view window should zoom in to your defined area and redraw.Zoom Out – zooms the view window out from the point clicked. To use:1.Select the Zoom Out tool with the left mouse button. Notice the cursor changes to themagnifying glass with the - sign icon.2.With the left mouse button click the area of the map you want to zoom out from. The viewwindow should zoom out, centering on the area that you clicked.12
Pan – moves all the view layer layers in the direction you move your mouse. It is a useful toolwhen viewing data that is larger than the view window, and you do not want to change yourscale or loose detail by zooming out. To use:1.2.Select the Pan tool with the left mouse button. Notice the cursor changes to a hand.Click a spot on the view with the left mouse button, and while holding down the button movethe mouse away from the direction you want to move the view and release the button. Theview should move and redraw the view in the new location once the mouse button isreleased.Full Extent – zooms the view window to the full extent of all layers shown in the view. This isvery handy when you want to get back to the way things looked when you first added the layer.Zoom to Previous Extent – zooms the view window back to the previous view window extent.Practice using the zooming and panning tools to view the Maryland data. You may also zoom inand out by using the wheel on your mouse. You can always return to the initial view by pressingthe ‘Full Extent’ button; so don’t be afraid to move around!Identifying ObjectsNow let’s examine the identify tool. This tool helps us to identify the objects of a layer. It islocated on the Tools toolbar and it has the icon with the letter i in a blue circle. This tool willdisplay the attributes of a particular layer object. These attributes are actually located in a tablethat we will discuss later.To use the identify tool:1.Click the identify tool with the left mouse button. Your cursor changes to a cross hair withthe i icon.When you click on a feature in the map, the Identify Results window will open and you canchoose what layers you would like to be able to identify or see what you have identified.13
Setting Map Units, Display Units and Map ProjectionOne of the very first things that you should do after adding data is to set the map and displayunits. It is also a good idea to set the projection (if desired) at this stage as well. Setting theseunits will allow you to measure distances or compute areas. Display units should also be set ifyou are planning to create a map layout with a distance scale. To set the map and display units:1. Right click on the data frame ‘Layers’ at the top of the legend and scroll down to ‘Properties.’The ‘Data Frame Properties’ dialog box pops up. You should be in the ‘General’ tab. Take a lookat the ‘Units’ portion of the dialog box. As you can see, the map units are already determinedin this case, but you can choose what units you would like to use for display. The map unitshere are “decimal degrees” because all of the ESRI data is shipped in decimal degrees. Not alldata is in decimal degrees. Some data, especially images, are in other map units such as meters.1.Let’s change our display units to “Miles”.14
Because our data is in decimal degrees, it is considered unprojected. We want to give our viewa standard projection. For Maryland, the Maryland State Plane 1983 NAD projection is typicallyused. Let’s set our data frame to this projection.2.Click on the ‘Coordinate System’ tab.Notice that it states that our current coordinate system is a geographic coordinate system,which is not projected.Let’s select a projected coordinate system.3.4.5.6.7.8.Click on ‘Predefined’.Click on ‘Projected Coordinate System’.Scroll down and click on ‘State Plane’.Click on ‘NAD 1983 (Feet)’.Scroll down and choose ‘NAD 1983 StatePlane Maryland FIPS 1900 (Feet)’.Click ‘Apply’ and then ‘OK’.15
TECHTALKThe Maryland State Plane is a Lambert Conformal Conic Projection. This projectionpreserves shape and maintains accurate distance in an east-west direction for the lower 48states, but only at the expense of direction (north, south, east and west) and area. Otherprojections such as Mercator preserve direction and shape, but sacrifice accurate distanceand area. Depending on the use of your data, some projections may be more suitable thanothers. Much of the data that you buy commercially is stored in decimal degrees, therebyallowing you to select and change projections. However, data from governmental sources isusually stored in a projection.When you first add a layer to ArcMap, it is shown based on its coordinate system(geographic or projected). When you add additional layers that have different coordinatesystems, ArcMap creates an on-the-fly projection and changes it to match the first. Thisdoes not
display of graphical information.” Although most commonly used to support engineering, planning, and illustrating activities, these files can be used in a GIS. Source: ESRI Data Dictionary. Image formats – ArcGIS accepts and uses a variety of image fil