Transcription
2013APPLICATION OF GIS INCONSTRUCTION PROJECTMANAGEMENT
CITY AND REGIONAL PLANNING DEPARTMENTCRP (514)Section 1TERM (122)TERM PAPERAPPLICATION OF GIS IN CONSTRUCTION PROJECTMANAGEMENTSubmitted by: Mohammed Ahmed Al-gahzariID: 201102430Instructor: Dr. Baqer Al-RamadanMay 12, 2013
OUTLINE:- INTRODUCTION- OBJECTIVES- CONSTRUCTION PROJECT MANAGEMENT- GEOGRAPHICAL INFORMATION SYSTEMS (GIS)- GIS APPLICATIONS IN CONSTRUCTION INDUSTRY- INTEGRATING PROJECT MANAGEMENT AND GIS- BENEFITS AND LIMITATIONS OF THE SYSTEM- CONCLUSION
IntroductionIn any construction project there is a large number of tasks and activitiesinvolved to it. The Construction Project Managers have a hard time monitoring theprojects between site and office. They have to come on site to know the developmentof work and decide the order of work. The managers are confused on what to do nextor what would be the changes faced by them in future. Therefore, the cost involved islarge and it varies with respect to the finishing of the project.The traditional approach for scheduling and progress control techniques such as barcharts and the critical path method (CPM) are still being used by the project managersfor planning which a serious disadvantage for the decision is making purpose as thespatial aspects fail to provide the required information (Naik et al., 2011).We need aconsiderable improvement in the quality and efficiency of scheduling and progressreporting to shorten the delivery period of construction projects. For achieving thisobjective, the integration between construction project management and theGeographical Information System seems to be the effective tool. In addition , in megaprojects, a visual representation of the schedule can be extended to monitoring notonly the construction process itself, but also all the supporting activities, includingonsite plant and equipment .The application of GIS in construction project management will be new in the SaudiConstruction industry. GIS will allow construction managers and different peopleinvolved in project with different backgrounds to get the information about theprogress of the project and support “Decision Making”.it will enhance thecommunication between these people.
GIS is both a database system with specific capabilities for spatially referenced data,as well as a set of operations for working with the data (Chrisman, 1999). Visualizingconstruction progress in three dimensions provides the construction project managerwith a more intuitive view of the construction sequence (Arditi, 2010).3-D visualization allows the construction manager to view the construction activitiesduring any stage of the construction process.The GIS database will help in analyzing, improving, monitoring, decision-making andoptimal planning. Its capabilities are embedded in its storing, manipulating, analyzingand presenting, which allow informed decision-making and optimal planning forconstruction (Sadoun, 2009).Objective:The objective of this paper is to demonstrate that GIS can be integrated withproject management software for construction progress visualization and anintegrated information system.
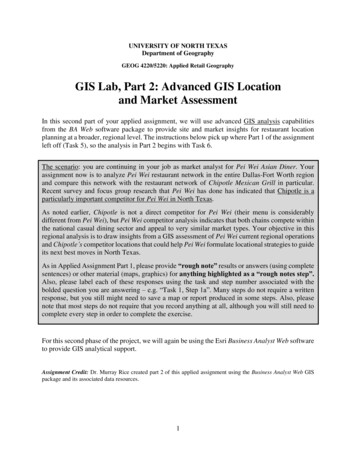
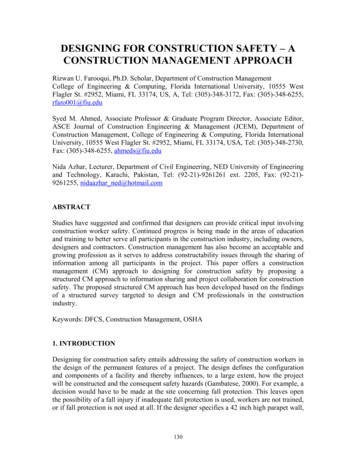
PROJECT MANAGEMENTThe term Project Management is defined as "The application of knowledge, skills, toolsand techniques to project activities to meet project requirements." (PMBOK)"The planning, monitoring and control of all aspects of the project and the motivation ofall those involved in it to achieve the project objectives on time and to the specified cost,quality and performance.” (PRINCE2)Project management processes can be organized into five groups of one or moreprocesses each (PMP) as shown in Fig 1:Initiating processes: recognizing that a project or phase should begin and committingto do so.Planning processes: devising and maintaining a workable scheme to accomplish thebusiness need that the project was undertaken to address.Executing processes: coordinating people and other resources to carry out the plan.Controlling processes: ensuring that project objectives are met by monitoring andmeasuring progress and taking corrective action when necessary.Closing processes: formalizing acceptance of the project or phase and bringing it to anorderly end.Fig. 1: Links among Process Groups in a Phase and the various applications in theprocesses
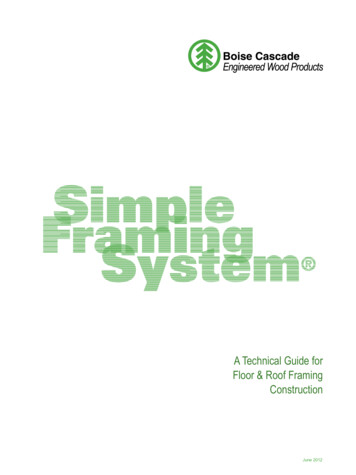
GEOGRAPHICAL INFORMATION SYSTEMS (GIS)In the past two decades, a host of professions has been in the process of developingautomated tools for efficient storage, analysis and presentation of geographic data.These efforts have apparently been the result of increasing demands by users for thedata and information of a spatial nature (Naik et al., 2011). This rapidly evolvingtechnology has come to be known as “Geographic Information Systems (GIS)”.Geographic information system goes beyond description; it also includes analysis,modeling, and prediction. According to the Environmental Systems Research Institute(ESRI), a GIS is defined as “an organized collection of computer hardware,application software, geographic data, and personnel designed to efficientlycapture, store, update, manipulate, analyze, and display all forms of geographicreferenced information (Naik et al., 2011)” Kang Tsung Chang describes GIS as acomputer system for capturing, storing, querying, analyzing and displayinggeographically referenced data. GIS is essentially a marriage between computerizedmapping and database management systems. Thus, a GIS is both a database systemwith specific capabilities for spatially referenced data, as well as a set of operationsfor working with the data. Geographically referenced data separates GIS from otherinformation systems. Let us take an example of road. To describe a road, we refer toits location (i.e. where it is) and its characteristics (length, name, speed limit etc.). Thelocation, also called geometry or shape, represents spatial data, whereascharacteristics are attribute data. Thus, a geographically referenced data has twocomponents: spatial data and attribute data.
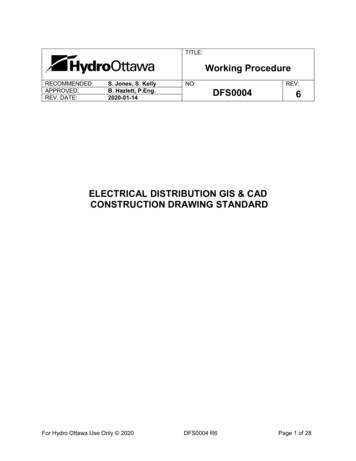
Fig. 2: Geographical Referenced DataSpatial Data: Describes the location of spatial features, which may be discrete orcontinuous. Discrete features are individually distinguishable features that don’t existbetween observations. Discrete features include points (wells), lines (roads) and areas(land-use types). Continuous features are features that exist spatially betweenobservations (elevation and precipitation) (Patra et al., 2008). A GIS represents thesespatial features on a plane surface. This transformation involves two main issues: thespatial reference system and the data model.
Attribute Data: Describes characteristics of spatial features. For raster data, eachcell value should correspond to the attribute of the spatial feature at that location. Acell is tightly bound to a cell value. For raster data, the amount of attribute data isassociated with a spatial feature can vary significantly (Patra et al., 2008). Thecoordinate location of a Land parcel would be spatial data, while its characteristics,e.g. area, owner name, vacant/ built-up, land use etc., would be attribute dataGIS is a relatively broad term that can refer to a number of different technologies andprocesses. It is attached to many operations, in engineering, planning, management,transport/logistics and analysis.GIS APPLICATIONS IN CONSTRUCTION MANAGEMENTGIS applications have proliferated in the construction industry in recent years. Thisfact I illustrated by the growing number of articles finding their way into civilengineering and construction journals and conference proceedings (Naik et al., 2011)GIS can be used for: Progress monitoring system in construction Networking solutions 3-D data analysis Site location and Client Distance Comparison of data Construction scheduling and progress control with 3-D visualization Government Regulations
EXAMPLE OF INTEGRATING PROJECT MANAGEMENT AND GIS:The goal of this paper is to demonstrate the benefits of using Geographic InformationSystem integrated with construction project management. In this paper, an example ofthe integration in introduced and the integration of GIS and Project Management isdeveloped using ArcGIS, MS Project, AutoCAD.Successful project control is a challenging responsibility for all constructionmanagers. Visualization of information is an important benefit for any project.The objective of this example is to display the progress and sequence of constructionwork in 3-D while synchronizing this information with a formal CPM work schedule.This would help all parties involved in a construction project to visualize the progressin a natural way, hence minimizing delays and cost overruns. In addition tomonitoring the schedule, the system can also be extended to monitor quantities ofmaterials, costs, and resources.
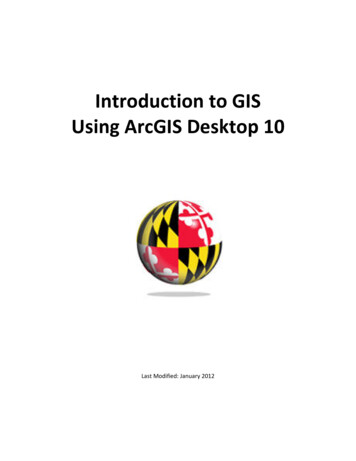
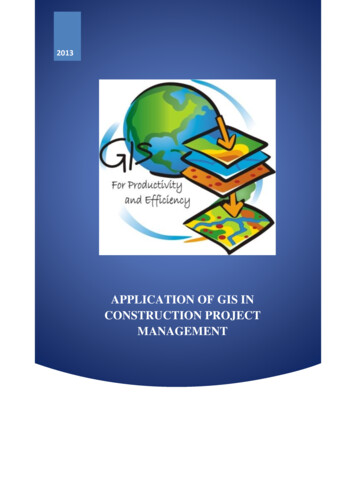
Fig. 3 shows the path of the project among the various applications in the system. Italso shows the procedure that needs to be used in using the system. A building ofG 20 storey building is selected as the study area. The progress reports are describedin the following sections.Fig 3: Flow Chart showing the Integration of Project Management and GIS
The following steps are required to generate the 4D model :1: CREATING AUTOCAD DRAWINGS2: CREATING WORK BREAKDOWN STRUCTURE3: INITIATING SCHEDULING PROCESS4: DIGITIZING AUTOCAD DRAWINGS TO GIS FORMA5: CREATING FEATURE CLASSES W.R.T. ACTIVITIES6: CREATING DATABASE W.R.TO FEATURE CLASS AND ACTIVITIES7: CREATE UPDATES OF MS PROJECT SCHEDULE8: RUN-TIME APPLICATION9: IMPORT INFORMATION ABOUT ACTIVITIES AND UPDATEGIS DATABASE10: SHOWING PROGRESS OF ACTIVITY IN 3-DIMENSIONALVIEWThese steps are illustrated in the following figures:STEP 1: CREATING AUTOCAD DRAWINGS
STEP 2: CREATING WORK BREAKDOWN STRUCTURESTEP 3: INITIATING SCHEDULING PROCESS
STEP 4: DIGITIZING AUTOCAD DRAWINGS TO GIS FORMATSTEP 5: CREATING FEATURE CLASSES W.R.T. ACTIVITIESSTEP 6: CREATING DATABASE W.R.TO FEATURE CLASS ANDACTIVITIESSTEP 7: CREATE UPDATES OF MS PROJECT SCHEDULE
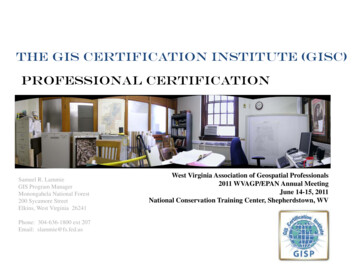
STEP 8: RUN-TIME APPLICATIONThe run time application is developed using Visual Studio 5.0 in C# language. Withthe help of this run-time application a User Interface was developed. Here the userwould come to know about the location of the source file. The user interface displayspresent date and time. It has drop down lists for the user to select accordingly. Fig.9shows the User Interface Window.
STEP 9:IMPORT INFORMATION ABOUT ACTIVITIES AND UPDATEGIS DATABASEThe percent complete information is transferred with the help of custom run timeapplication to MS Project every time a progress evaluation is made and theapplication is run. MS Project was run to generate the updated schedule network. Theupdated schedule shows the progress for all the activities as of the new date of theupdate (e.g. at the end of every month or daily updates) and the percent completeinformation.STEP 10: SHOWING PROGRESS OF ACTIVITY IN 3-DIMENSIONALVIEW
BENEFITS AND LIMITATIONS OF THE SYSTEMTraditionally, the CPM schedule does not offer adequate information pertaining to thespatial aspects or context and complexities of the various components of aconstruction project (Jongeling and Olofasson, 2007). Therefore, to interpret progressinformation, project members normally look at 2D drawings and conceptuallyassociate components with related activities. Different project members may developinconsistent interpretations of the schedule when reviewing only the CPM scheduled(Bing and Wang, 2007). This causes confusion on many occasions and usually makeseffective communication among project participations difficult. This system allowsproject planners and managers to see in detail the spatial characteristics of the project.All the project members should be able to visually observe the progress, which willhelp in effective communication of the schedule. The system has to be runperiodically over the duration of the project.
CONCLUSIONThis system will benefit project managers, site engineers and clients in the followingmanner:PROJECT MANAGER Up-to date information about the progress of work Helps in controlling big project sites Comes to know about the Cost incurred/Spent and the quantity of materials used onsite Reduces time for decision making as all information is in one systemSITE ENGINEER Controlling the project site by knowing the progress of work Helps in easy decision making for procurement of funds or materials Helps in informing the contractors beforehand about the start of their work Helps in knowing how much more material is required Helps in reducing wastage of materials Helps in ordering the ideal quantity of materials thus by reducing over ordering ofmaterialsCLIENT Helps in knowing the exact status of the project Has a 3-D view of the progress of work thus knowing where large cost has beenincurred.
REFERENCES:Balqies Sadoun. "A GIS system for tourism management", 2009 IEEE/ACSInternational Conference on Computer Systems and Applications, 05/2009Bing Yao and Wang. "Research on Work Flow Optimization and VisualizationSystem", 2007 IEEE International Conference on Automation and Logistics, August18 - 21, 2007, Jinan, ChinaGopal M. Naik, Aditya M and Suman B. Naik “Integrated 4D Model Developmentfor Planning and Scheduling of a Construction Project using GeographicalInformation System”, 2011 2nd International Conference on Construction and ProjectManagement IPEDR vol.15 (2011) (2011) IACSIT Press, SingaporeKang-tsung Chang, “Introduction to Geographic Information Systems”, 2006, TataMcGraw-HillMiles, S. and Ho, C. (1999). ”Applications and Issues of GIS as Tool for CivilEngineering Modeling.” J. Comput. Civ. Eng., 13(3), 144–152Nicholas R. Chrisman. "What Does 'GIS' Mean?", Transactions in GIS, 03/1999,(2),175-186Prashanta Kumar Patra1 Chittaranjan Pradhan2 Animesh Tripathy2 “An IntelligentFramework For Distributed Query Optimization Of Spatial Data In GeographicInformation Systems” IJCSNS International Journal of Computer Science andNetwork Security, VOL.8 No.5, May 2008PMBOK, Project Management -- Body of Knowledge as defined by the ProjectManagement Institute — PMIR. Jongeling, T. Olofsson,” A method for planning of work-flow by combined use oflocation-based scheduling and 4D CAD” / Automation in Construction 16 ttp://en.wikipedia.org/wiki/Geographic information system
Visualizing construction progress in three dimensions provides the construction project manager with a more intuitive view of the construction sequence (Arditi, 2010). 3-D visualization allows the construction manager to view the construction activities . The term Project Management i