Transcription
GIS Best PracticesGIS in AfricaMarch 2009
Table of ContentsWhat Is GIS?1Global Dialogues: GIScience and Sustainable Developmentin Africa3Cape Town's Emphasis on Systems Integration Exemplifies"Smart City" Goals7Early Warning Planning for Mosquito-Borne Epidemics13Planning Education Projects in Rural Ethiopia Using GIS17Nigerian Voting System Modernized21Helping Elephants Across the African Continent with GIS25South African Educators Teach GIS—With orWithout Computers31Ghana Project Leverages GIS-Based Title Registration andMicrofinance to Alleviate Poverty39i
What Is GIS?Making decisions based on geography is basic to human thinking. Where shall we go, what will it belike, and what shall we do when we get there are applied to the simple event of going to the store orto the major event of launching a bathysphere into the ocean's depths. By understanding geographyand people's relationship to location, we can make informed decisions about the way we live on ourplanet. A geographic information system (GIS) is a technological tool for comprehending geographyand making intelligent decisions.GIS organizes geographic data so that a person reading a map can select data necessary for aspecific project or task. A thematic map has a table of contents that allows the reader to add layersof information to a basemap of real-world locations. For example, a social analyst might use thebasemap of Eugene, Oregon, and select datasets from the U.S. Census Bureau to add data layersto a map that shows residents' education levels, ages, and employment status. With an ability tocombine a variety of datasets in an infinite number of ways, GIS is a useful tool for nearly every fieldof knowledge from archaeology to zoology.A good GIS program is able to process geographic data from a variety of sources and integrateit into a map project. Many countries have an abundance of geographic data for analysis, andgovernments often make GIS datasets publicly available. Map file databases often come includedwith GIS packages; others can be obtained from both commercial vendors and governmentagencies. Some data is gathered in the field by global positioning units that attach a locationcoordinate (latitude and longitude) to a feature such as a pump station.GIS maps are interactive. On the computer screen, map users can scan a GIS map in any direction,zoom in or out, and change the nature of the information contained in the map. They can choosewhether to see the roads, how many roads to see, and how roads should be depicted. Thenthey can select what other items they wish to view alongside these roads such as storm drains,gas lines, rare plants, or hospitals. Some GIS programs are designed to perform sophisticatedcalculations for tracking storms or predicting erosion patterns. GIS applications can be embeddedinto common activities such as verifying an address.From routinely performing work-related tasks to scientifically exploring the complexities of our world,GIS gives people the geographic advantage to become more productive, more aware, and moreresponsive citizens of planet Earth.GIS BEST PRACTICES1WWW.ESRI.COM
Global Dialogues: GIScience and SustainableDevelopment in Africa"Crossing Borders"A column by Doug Richardson,Executive Director, Association of American GeographersThe Association of American Geographers recently had theopportunity to participate with hundreds of African geographers,GIScientists, and environmental scientists in a new dialogue aroundthe theme of Geospatial Science and Sustainable Developmentin Africa. These discussions, which were initiated in March 2008and have already generated several promising new areas ofresearch and educational collaboration, were sponsored by the U.S.Department of State's Global Dialogues on Emerging Science andTechnology (GDEST) program. Follow-on activities and continuinginteractions resulting from these dialogues have the potential togenerate considerable ongoing and long-term cooperation among African and U.S. scientistsin geographic research, geographic information science (GIScience) education and GISapplications, sustainability science, and many related fields.Five other GDEST programs also have been undertaken, including dialogues in Japan (focusingon nanotechnologies), China (biotechnology), and Germany (quantum computing). However,the recent Africa GDEST program is the first to be initiated on a continental scale and the first toaddress geography-related research fields, such as geospatial science and sustainability.The Global Dialogues on Emerging Science and Technology program focusing on GeospatialScience and Sustainable Development in Africa began in March 2008 with site visits touniversities, governmental ministries, and nongovernmental organizations in nine Africancountries, followed by a conference on the same theme in Cape Town, South Africa.The U.S. delegation was divided into two teams, East Africa and West Africa, and includedmembers from the U.S. Department of State Humanitarian Information Unit and its Bureauof Oceans and International Environmental and Scientific Affairs, as well as representativesGIS BEST PRACTICES3WWW.ESRI.COM
from other U.S. governmental agencies, several U.S. universities, the American GeographicalSociety, the Association of American Geographers, and the United States Agency forInternational Development (USAID) regional offices. The teams conducted more than 50 sitevisits and met with hundreds of African experts in the fields of environmental remote-sensinginterpretation and modeling, GIS cartography and analysis, agriculture, education, health,surveying, mining, climate, hydrology, population, urban systems, and information andcommunication technology.Care was taken to listen to and learn from our African colleagues, to identify needs ratherthan prescribe solutions, to build upon existing regional capacity in geospatial science andtechnology rather than duplicate or displace it, and to explore opportunities for collaborationbetween U.S. and African scientists and institutions, as well as among African organizations andnetworks, in ways identified as useful to scientists, educators, and governmental agencies fromthe region.It was clear from both the country visits and the conference that significant progress has beenachieved since the 2002 World Summit on Sustainable Development in terms of the diffusionand sophistication of geospatial technologies, applications, and coordination, both regionallyand in individual countries, and their use in sustainable development planning and programimplementation. Despite progress, however, optimal use of geographic information science andassociated technologies is often constrained by a lack of resources, a lack of access to suitabledata, and a lack of coordination among users and data producers.Among other topics, GDEST participants particularly sought to promote future dialogues thatwould identify partners for collaboration on specific projects or programs; make better useof collaboration among U.S. and African scientists and practitioners to create a sustainablecritical mass of African expertise; support regional and indigenous educational and institutionalinfrastructures; and develop educational and research collaborative mechanisms, includingfaculty and student exchange programs, online interactions, and better access to research andcurricular information.The AAG currently is implementing some of the above resource sharing and online interactivecoordinative mechanisms through its new subsidized Developing Regions Membership Programand through the existing AAG Center for Global Geography Education programs.Also important to sustaining collaboration is supporting existing African networks of excellenceand platforms for dialogue, information sharing, and communication. For example, AfricanMARCH 20094GIS IN AFRICA
networks of excellence, such as the African Association of Remote Sensing of the Environment(AARSE), African Geo Information Research Network (AGIRN), African Reference Frame(AFREF), Environmental Information Systems Africa (EIS-AFRICA), Mapping Africa forAfrica, and university networks (e.g., University Network for Disaster Risk Reduction inAfrica [UNEDRA]), are vital infrastructures of communication and coordination for research,education, and applications collaboration. Descriptions of and linkages to these and many otherexisting African networks can be accessed directly through the AAG Web site at www.aag.org/developing.The U.S. GDEST delegation representatives, both individually and in coordination with U.S.embassies in the countries visited, are currently following up on contacts and acquaintancesmade during the site visits and will be continuing discussions on specific projects for whichopportunities for partnerships and collaboration were identified. A report on the African GDESTprogram's progress and findings is under development and will be made available in the nearfuture.I would like to thank Lee Schwartz, director of the Office of the Geographer and Global Issuesat the U.S. Department of State, together with Nina Fedoroff and Andrew Reynolds of the Officeof the Science and Technology Adviser to the Secretary of State, for providing key leadershipand logistical support essential to the success of the African GDEST program. Most importantly,on behalf of all of the participants, I would like to express our deep appreciation to our Africancolleagues for the opportunity to learn from them during these dialogues and for their insightand guidance on how to sustain ongoing interactions and useful collaborative activities in theyears ahead.More information on African geography and GIS research, education, and sustainabledevelopment activities, as well as collaborative needs and opportunities, is available andupdated regularly on the AAG Web site (www.aag.org).(Reprinted from the Spring 2008 issue of ArcNews magazine)GIS BEST PRACTICES5WWW.ESRI.COM
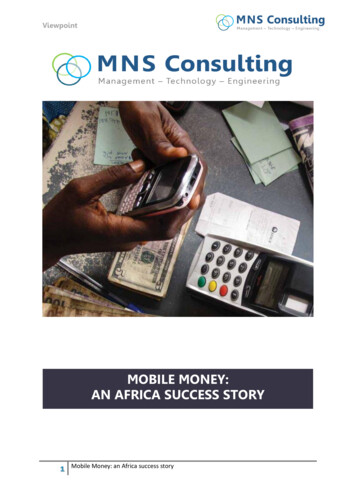
Cape Town's Emphasis on Systems IntegrationExemplifies "Smart City" GoalsHighlights ERP and GIS optimize city's entire business processes through seamless IT integration. System is recognized as one of the world's largest local government ERP systems. City realizes substantial savings.In 2001, seven neighboring local authorities were amalgamated into the City of Cape Townin the Republic of South Africa with the intention of consolidating and streamlining municipalservices across the Cape Town metropolitan area. As a result of this massive restructuringprocess, the City of Cape Town, with a population of approximately 3.2 million, immediatelybecame responsible for managing a number of antiquated, stand-alone informationmanagement systems holding disparate data in at least seven different IT centers across thenew city.Integrating its existing legacy systems into a seamless IT infrastructure became a top priorityfor the city. Committing itself to a holistic and comprehensive "smart city" strategy, the ITdepartment initiated a number of projects to address the standardization of Information andCommunications Technology (ICT) architecture and connection of constituent parts to enablea better flow of information among the departments and more efficient services for the city'sresidents.Key to the success of the smart city strategy was the implementation of the enterprise resourceplanning (ERP) system, which saw approximately 113 legacy systems and 70 interfacesreplaced with a single functionally rich SAP solution designed to standardize and optimize thecity's entire business processes. Recognized as one of the world's largest ERP systems everimplemented by a local government, it deploys SAP's Industry Solution for Utilities as the billingsystem to help streamline the revenue process and integrate these into the ERP back-office andCRM processes.GIS BEST PRACTICES7WWW.ESRI.COM
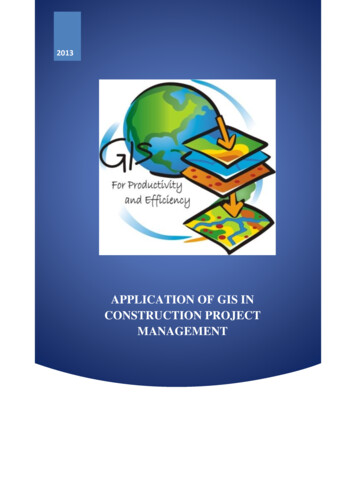
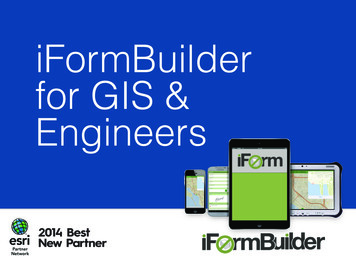
SAP is linked to GIS to extract monthly maintenance costs of water bursts in the Khayelitsha service area.Bursts have been captured with mobile GIS devices.Next, the city integrated a GIS into the information system infrastructure. While GIS technologywas used throughout the various local councils prior to the amalgamation, it functioned primarilyas stand-alone systems with little standardization and limited compatibility. To reform thisparticular legacy, Cape Town implemented an enterprise GIS based on the ArcGIS platform.This allowed extensive functionality within a multiuser environment and provided an effectivespatial data management platform for its many users. Initially, the city concentrated onconsolidating electricity and property geodatabases into the GIS and subsequently added theWater Services geodatabase to the GIS process. Since then, a number of other departments,such as Planning and Valuations, have started implementing GIS technology. ArcGIS wassuccessfully implemented in participating departments as the city focused on integration issues,such as user profiles, as well as standardized data capturing and maintenance of departmentalgeodatabases.MARCH 20098GIS IN AFRICA
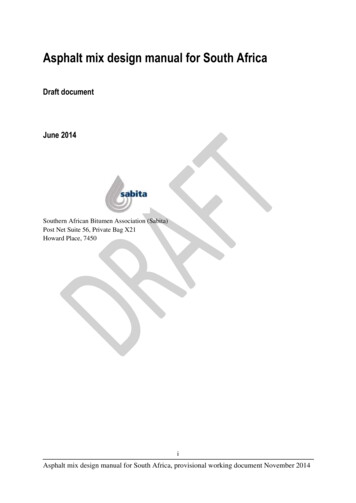
Cape Town's Water Services proved to be the ideal utility from which to continue its GISintegration initiatives. South Africa is located in a semiarid region without significant perennialrivers or lakes, and this reality requires extensive conservation and water control measures. TheCity of Cape Town also experiences a 3 percent annual growth in its population, placing an evengreater strain on the city's limited water resources. Given these constraints, GIS provides oneof the best possible means to collect, analyze, and model spatial data for optimization of waterconservation and demand strategies.The implementation of SAP enabled the city to establish an effective link between the system'sbusiness information capabilities and its location-based asset information, such as pipes,meters, reservoirs, treatment plants, and associated attribute data stored in GIS. By takingadvantage of this linkage, Cape Town is now able to extract the monthly maintenance costs forincidents, such as burst pipes and sewer blockages, as well as to evaluate water consumptionpatterns based on tariff structures.This shows the percentage of capital budget allocation spent for 2006 per selected wards.The data originates from SAP Business Warehouse.GIS BEST PRACTICES9WWW.ESRI.COM
There is also a link to the asset register, which is a model that runs against the GISinfrastructure geodatabase and is used to calculate solutions, such as the life span of thevarious parts and components of the Water Services infrastructure. GIS can, therefore, be usedas a tool to plan medium- and long-term budgeting of infrastructure projects, such as replacingpipe infrastructure due to increased population demands or end of life cycle redundancy.Next, the city will apply the lessons learned from the Water Services implementation to thedevelopment of a sewer and storm water geodatabase. Currently, the existing ArcEditor/ArcInfotools are utilized for multiuser editing in eight district offices, but the long-term vision is todevelop a customized editing tool within the ArcGIS Server environment.By developing a common data model for GIS use throughout the city, the City of Cape Town hasrealized substantial savings in its operations and developed a GIS that promotes data sharingwhile minimizing data redundancy. The overall strategy is to implement a GIS completelyintegrated with the city's enterprise-wide information architecture and infrastructure, providingsupport to the city's private citizens and its local business community.The Water Services Department has also implemented a Technical Operations Centre (TOC)that interfaces with the Corporate Call Centre to initiate operational responses and manageevent tracking and logging. Currently, the Water Services Department is evaluating the availabletechnology and interfacing options to develop a fully automated, spatially enabled eventmanagement system (EMS), defining an event as any operational activity requiring a response.The EMS would be used to monitor and support the responsibilities of the city's employees toincrease their efficiency. For example, the EMS would automatically record the exact locationof an event occurring in the city and analyze it to determine its impact on the surroundingarea. Using location as a reference, the system would then identify assets the city has at anyparticular location and dispatch work crews to respond to the event. Workflows developed withinthe EMS will allow the city to define and manage its standard operating procedures to supportthe EMS. The workflows would analyze the system's automated response to an event andescalate the response to a higher level, demanding greater urgency, if required.According to Pieta Le Roux, former GIS coordinator for the city's Water Services Department,because events will be spatially referenced, engineers will be able to interpret trends andpatterns visually, which will allow them to be proactive in their response to events. In addition,the TOC will coordinate responses to water/wastewater emergencies by integrating thenotification and work order processes of SAP with mobile GPS/GIS and communicationtechnologies. This integration will allow the city's supervisory control and data acquisitionMARCH 200910GIS IN AFRICA
(SCADA) and telemetry systems' alarm components to be part of the central IT network andinformation infrastructure for quicker response to any malfunctions or anomalies occurring withinthe city's utility networks.Le Roux further states that the City of Cape Town has a mature GIS, which is commonlyviewed as central to the city administration's plans for a tightly integrated and service-orientedIT architecture, supported by a modern infrastructure, for seamless enterprise informationmanagement capability. The GIS production and geodatabase server environments form amajor part of this integration process.Commenting on the future, Le Roux says, "Cape Town will be implementing strategies andprocesses toward the transactional integration of GIS and SAP to provide the necessary lifecycle views and real-time feedback of their asset maintenance environment."(Reprinted from the Winter 2007/2008 issue of ArcNews magazine)GIS BEST PRACTICES11WWW.ESRI.COM
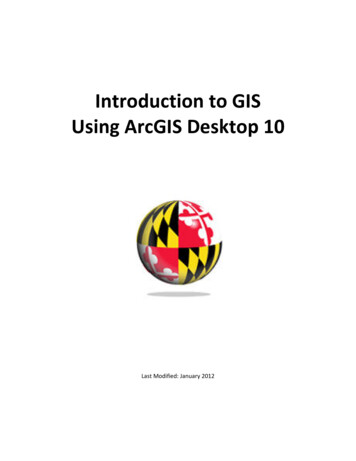
Early Warning Planning for Mosquito-Borne EpidemicsGIS, High-Resolution Remote Sensing Help Evaluate Degrees of Risk inSenegalBy Yves M. Tourre, Delphine Fontannaz, Cécile Vignolles, Jacques-André Ndione, Jean-PierreLacaux, and Murielle LafayeHighlights GIS tools and remote sensing were used to detect potential breeding ponds. In situ observations validated the indexes. Using ArcView, researchers calculated mosquito density and evaluated cross-potential risksFifty years of successful efforts in the prevention and control of infectious diseases andepidemics have inspired confidence and optimism in modern medicine and technology.Nevertheless, epidemics remain a conspicuous challenge to public health today. In the contextof climate change and rapidly increasing population, some epidemics are even reemerging.A false-color composite of a 10 m SPOT 5 image (left) and ENVI 4.3 software were used toobtain a new pond index (NDPI). From the NDPI, ponds (in blue) were precisely located (centerand right). The 500 m zone potentially occupied by mosquitoes (ZPOM) is shown in orange.GIS BEST PRACTICES13WWW.ESRI.COM
For example, the Ferlo region in Senegal, Africa, became prone to Rift Valley fever (RVF) inthe late 1980s when virus-carrying mosquitoes Aedes vexans and Culex poicilipes appeared.The latter species proliferate near temporary ponds and neighboring humid vegetation. RVFepizootic outbreaks in livestock cause spontaneous abortions and perinatal mortality. Sofar, human-related disease symptoms are often limited to flu-like syndromes but can includemore severe forms of encephalitis and hemorrhagic fevers. As a result, local socioeconomicresources can be seriously affected.Professor P. Sabatier at the University of Grenoble indicated that this growing threat created anurgent need for a local early warning system (EWS) for RVF epidemics in Senegal. The goalwas to use specific GIS tools and remote-sensing images/data to detect potential breedingponds and evaluate RVF diffusion and areas with potential risks.Project Description andPreliminary MethodsMEDIAS-France implemented the RVF project in the Ferlo region under the auspices of theFrench Spatial Agency (Centre National d'Etudes Spatiales). MEDIAS-France is a nonprofitcorporation that coordinates research groups studying global environmental issues in areasincluding the Mediterranean Basin and subtropical Africa.In the Ferlo region, the abundance of mosquitoes is linked to rainfall, ponds and their turbidity,and the presence or absence of vegetation in ponds (e.g., water lilies, wild rice). Initially,Environment for Visualizing Images (ENVI) 4.3 imagery processing software from ITT VisualInformation Solutions was used for spectral analysis of high-resolution ( 10 m) SPOT 5 imagesto locate the ponds. First, image registration tools were used to warp the images to match andimplement relative georeferencing for all SPOT 5 images collected, with further adjustmentto minimize spatial errors. Then, new indexes were obtained by using the classic NormalizedDifference Vegetation Index (NDVI) transform tool to allow the combination of different spectralbands (such as the middle infrared [MIR] and the near infrared [NIR] red and green bands).The Normalized Difference Pond Index (NDPI) allowed detection of all ponds; the NormalizedDifference Turbidity Index (NDTI) allowed the evaluation of water transparency or turbidity. Insitu observations by participants from the Center for Ecological Monitoring (Centre de SuiviEcologique) in nearby Dakar validated the indexes using GPS and GIS.MARCH 200914GIS IN AFRICA
Using these methods, small ponds were located with precision, making it further possible tomap RVF risks from zones potentially occupied by mosquitoes (ZPOM) following recent studiesfrom entomologists on flying ranges and spatial distribution of mosquitoes.ArcView conversion, data management, and analysis tools enable the display of animproved three-zone ZPOM for potential Rift Valley fever risks.The very high-risk zones are red-hatched to identify underlying pond limits.GIS MethodsGIS BEST PRACTICESFurther refinement and simplification were needed, however, because of the complexity of thepond distribution and to develop an effective usage strategy for local health informationservices. Researchers wanted to identify degrees of risk from isolated and/or clustered ponds,calculate the target risk coverage area, and evaluate risk by mosquito density in overlappingzones.15WWW.ESRI.COM
Because of researcher Delphine Fontannaz's GIS expertise and the availability of new detailedinformation in the zones, the GIS approach became an obvious solution for the team. UsingArcView software and tools (e.g., conversion and data management for spatial projection andtransformation, as well as overlay and proximity vector data analyses), maps obtained fromSPOT 5 10-meter multispectral resolution imagery were first transformed into appropriateformats, then converted from raster to vector formats. The georeferencing accomplishedthrough universal transverse Mercator (UTM) WGS 1984 for zone 28N permitted furthercomparison and processing.The initial ZPOM was first divided into three bands chosen for defining risk levels for potentialvirus transmission by Aedes vexans. Then, using ArcView software, researchers calculatedmosquito density and evaluated cross-potential risks. They noted that zones with very high andhigh risks were inhabited by potential reservoirs, i.e., carriers (snakes, frogs, and toads), of theRVF virus and produced an improved ZPOM.ResultsThe analyses using GIS technology allowed researchers to see that risks increase when pondsare close to each other. Using GIS technology, researchers created a new, more detailed, andmore useful ZPOM. GIS tools provided new products and information for use by local earlywarning systems in the prevention of disease.FutureApplicationsThis technique might be improved by adding digitized ecological zone layers. Multidisciplinaryusers can benefit from this data by using it to choose strategic positioning of villages and parksaccording to RVF risks. This new methodology is also being transferred to other teams in Africafor varied types of mosquito vector research.About the AuthorsTourre, Fontannaz, Vignolles, and Lacaux are affiliated with MEDIAS-France, Toulouse, France;Ndione is affiliated with the Centre de Suivi Ecologique (CSE), Laboratoire de Physique del'Atmosphère et de l'Océan, Université Simon Fongang, Dakar, Senegal; and Lafaye is affiliatedwith the Centre National d'Etudes Spatiales (CNES), Toulouse, France.(Reprinted from the Spring 2008 issue of ArcNews magazine)MARCH 200916GIS IN AFRICA
Planning Education Projects in Rural EthiopiaUsing GISHighlights GIS technology maximizes the number of children reached. IRC Ethiopia has gained new insight into its development and relief programs. Success with ArcView software has led IRC Ethiopia to expand GIS into almost everyproject it undertakes.Every day, millions of rural children in Ethiopia do not attend school. Instead, they work onfarms; dig in mines; or perform strenuous household tasks, such as gathering firewood orfetching water, which together can take several hours each day. For them, education is out ofreach, both because poor families require the additional income and because many areas lackelementary schooling altogether.Beginning in 2005, the United States Department of Labor funded the International RescueCommittee (IRC) to build schools and train teachers for community Alternative BasicEducation (ABE) schools, which would serve as institutions to transition children from thelabor force into more formal educational institutions, such as primary schools. Simultaneouscommunity awareness and education programs promoted the benefits of education andencouraged families to send their children to school.In implementing the project, IRC wished to use the funding as effectively as possible. The firsttask was to locate each new ABE school within walking distance of as many out-of-schoolchildren as possible. Second, because the ABE program is designed to prepare childrenfor more formal schooling, it was decided that each new ABE school should be within twokilometers of a formal primary school so that graduates of the ABE program could easily transferto the formal school system. One further constraint on the program was that proposed schoolsites should be relatively near main roads in order to facilitate the construction process andprogram monitoring.GIS BEST PRACTICES17WWW.ESRI.COM
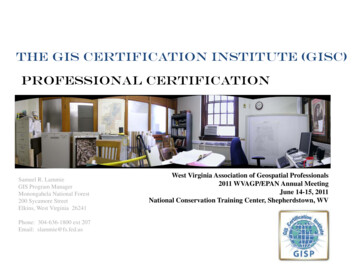
Map of villages in Boke Woreda, Ethiopia, that displays the number of out-of-school children in eachvillage. Maps such as this were used to site new Alternative Basic Education schools/centersnear the most potential students and near extant primary schools in the area.Based on this analysis, Qeelee was chosen as the site for a new school.The Ethiopian Education Office lacks the infrastructure and funding to maintain information onprimary school locations, village school age populations, and distances between schools andvillage populations. Low-level road maps are also not available for most rural districts. The IRCEthiopia program therefore had to build its geographic database from the ground up. BeharHussein, the IRC Ethiopia GIS coordinator, trained eight people in the use of Garmin eTrex VistaGPS units to aid in the survey of 491 villages. The surveyors used Garmin eTrex Vista GPS forthe survey. While four of the eight surveyors gathered geographic data about village boundaries,roads, health centers, water points, and primary school locations, the remaining four gathereddemographic data from each village: the number of households, number of children of eachMARCH 200918GIS IN AFRICA
age, and number of children of each age attending formal schooling. The data took more than50 days to collect and was cleaned and compiled at IRC's Addis Ababa office."It was much harder to obtain this data than downloading it," laughs Hussein, who performed theanalysis using the office's ArcView program. He focused on children aged 6 to 11 years of agewho were not enrolled in formal schools. First, he plotted the number of children not in schoolin each village; that map displayed several obvious locations for ABE schools that would be inclose proximity to large numbers of out-of-school children. Of those locations, not all were withinthe proposed two kilometers of the nearest primary school. Potential locations were furthernarrowed down by their access to roads, which were extensively mapped out during the villagesurveys.IRC constructed ABE schools at 22 sites in each of the four selected rural districts, each sitechosen to be close to a large number of children not already enrolled in school. Each ABEschool was also within two kilometers of a government primary school, ensuring that theprogram and its graduates were integrated into Ethiopia's educational institutions. The proximityto usable roads meant that the construction could be carried out in a timely manner and that IRCcould easily monitor the progress and enrollment at each ABE site. Following the constructionof the 22 ABE schools and with continued funding from the U.S. Department of Labor, thereare currently 4,120 children enrolled in the Alternative Basic Education program and preparingto enter more formal schooling. The program is currently expanding enrollment to vocationaltraining for older youth. By enabling these children to further their education instead of laboring,the program improves their individual economic opportunities while simultaneously furtheringthe development of Ethiopia
Key to the success of the smart city strategy was the implementation of the enterprise resource planning (ERP) system, which saw approximately 113 legacy systems and 70 interfaces replaced with a single functionally rich SAP solution designed to stand