Transcription
Instant Demo GuideCisco dCloudCisco Stealthwatch 7.0 v1 - InstantDemoLast Updated: 29-August-2019About This Instant DemoThis guide for the preconfigured demonstration includes:About This Instant DemoRequirementsAbout This SolutionScenario 1.Real-time RiskScenario 2.Policy ValidationScenario 3.Data Theft ForensicsScenario 4.Cognitive Analytics IntegrationScenario 5.ETA Cryptographic AssuranceWhat’s Next? 2019 Cisco and/or its affiliates. All rights reserved. This document is Cisco Public Information.Page 1 of 31
Instant Demo GuideCisco dCloudRequirementsThe table below outlines the requirements for this preconfigured demonstration.RequiredOptionalLaptopCisco AnyConnect 2019 Cisco and/or its affiliates. All rights reserved. This document is Cisco Public Information.Page 2 of 31
Instant Demo GuideCisco dCloudAbout This SolutionThe Stealthwatch System provides enhanced visibility into advanced threats by identifying suspicious patternsof traffic within an enterprise network. These suspicious patterns are supplemented with contextual informationfrom other devices to improve the overall analytics and establish specific threat levels associated with anactivity. The solution delivers the following capabilities: Discover and mitigate advanced threats more quickly and before sensitive information is lost or criticalbusiness operations are disrupted. Gain network-wide visibility by turning the entire network into a sensor. Detect advanced malware propagation across the network. Build on your existing network infrastructure investments for advanced threat detection and response. Provide end to end visibility on traffic passing through network devices. Stores traffic flows for suspicious and normal traffic for long period for investigation and analysis. Allows Encrypted traffic analysis for compliance and for malware encrypted communication detection.The value of Stealthwatch helps customers preserve revenue generation by protecting operations, save moneyby avoiding loss and exposure, and lowering the risk associated with a Digital Enterprise.The key components of the solution are: Aggregation and analysis of Netflow telemetry and other data to detect threats and anomalous behavior,provided by the Stealthwatch System. Network-wide security telemetry, provided by Netflow export from Cisco Catalyst switches, Ciscorouters, Cisco ASA 5500 Series Adaptive Security Appliances (ASA), and Cisco Netflow GenerationAppliances. Identity context for users and devices, including authentication, posture validation, and device profiling,provided by the Cisco Identity Services Engine (ISE). 2019 Cisco and/or its affiliates. All rights reserved. This document is Cisco Public Information.Page 3 of 31
Instant Demo GuideCisco dCloudScenario 1.Real-time RiskValue Proposition: An overview of the Stealthwatch Dashboard can be used to gain a view of the real-timethreat environment within a customer’s network. If a customer’s primary concern is answering the question“What threats exist in my network right now,” this is the place to start.Traditionally network security has relied on perimeter devices. One of the limitations of that method is gaininginsight into what is happening throughout the network. By enabling Netflow across all devices in the networkand by sending that information to the Stealthwatch system, we can gain network-wide threat visibility and turnthe entire network into a security sensor.Challenge - Focus on Risk Secure perimeter does not mean secure network as insider threats remain invisible to perimeter securityBenefits - Focus on Lower Risk Enable the entire network to gain real time visibility into security threats and anomalous behavior acrossthe environmentStepsNOTE: When we first login into the system, we are presented with a dashboard showing our current threatenvironment.1. In the User Name field, enter amdemo1 and in the Password field, enter C1sco12345, and then click SignIn. 2019 Cisco and/or its affiliates. All rights reserved. This document is Cisco Public Information.Page 4 of 31
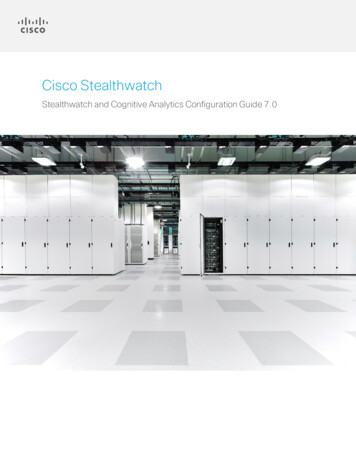
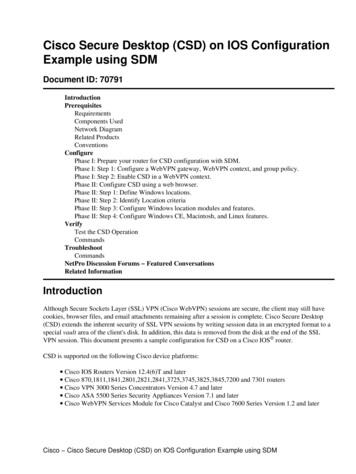
Instant Demo GuideCisco dCloud2. View the Alarming Host widget across the top of the Dashboard to see the current security events.NOTE: Events are generated when policies, anomalies, attacks, exploitations or other security related violationsare detected.NOTE: The trend numbers within the categories will change and refresh on a regular basis. This is normalbehavior and reflects the real-time data collection within the Stealthwatch Demo System.3. Here is a breakdown of alarm categories: Concern Index – Hosts behaving as bad actors in the network. Target Index – Hosts that are the target or recipient of scans or other malicious attacks. Recon – Indicates the presence of unauthorized and potentially malicious scans using TCP or UDP andbeing run against hosts inside the network. These scans, referred to as reconnaissance are early indicatorsof attacks against your network, and the scans may come from inside or outside your network. C&C – Indicates the existence of bot-infected servers or hosts in your network attempting to contact a C&CServer. Exploitation – Tracks direct attempts by hosts to compromise each other, such as through wormpropagation and brute force password cracking. DDoS Source – Host acting as a denial of service source. DDoS Target – Host acting as denial of service target. Data Hoarding – A host that is downloading unusually large volume of data from one or more hosts insidethe network.(east -west). Exfiltration – Tracks inside and outside hosts to which an abnormal amount of data has been transferred.(South – North). Policy Violation – Any violation of a rule(s) within a policy. Anomaly – Tracks events that indicate that hosts are behaving abnormally or generating traffic that isunusual, but is not consistent with another category of activity.4. The information presented above is great for gaining insight into what is happening now. If we look at thevarious dashboards below the current alarms, we can see threats over time. 2019 Cisco and/or its affiliates. All rights reserved. This document is Cisco Public Information.Page 5 of 31
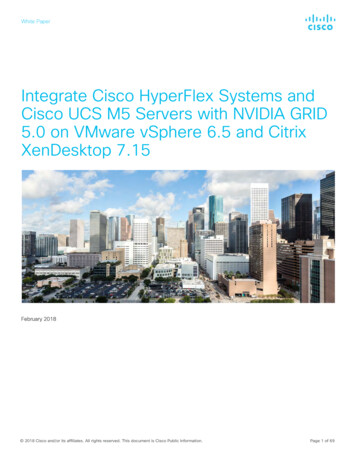
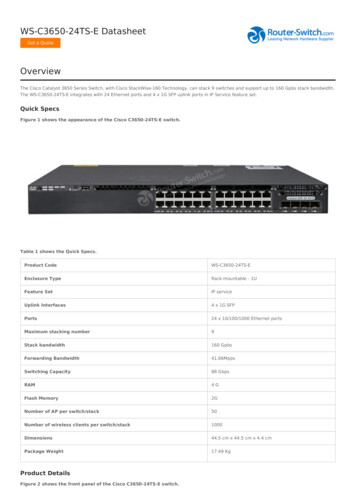
Instant Demo GuideCisco dCloud5. In the Alarms by Type widget, view a breakdown of all the alarms by type and frequency over the last week 2019 Cisco and/or its affiliates. All rights reserved. This document is Cisco Public Information.Page 6 of 31
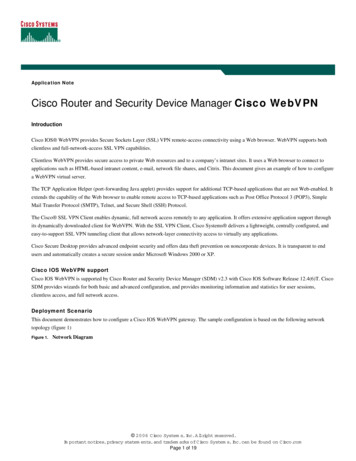
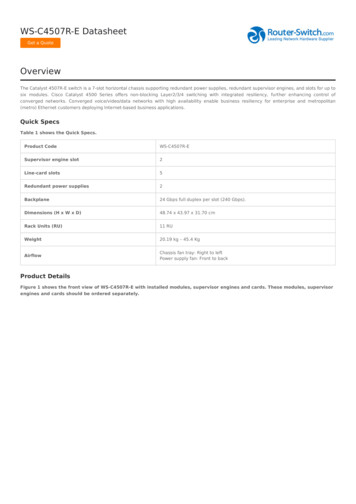
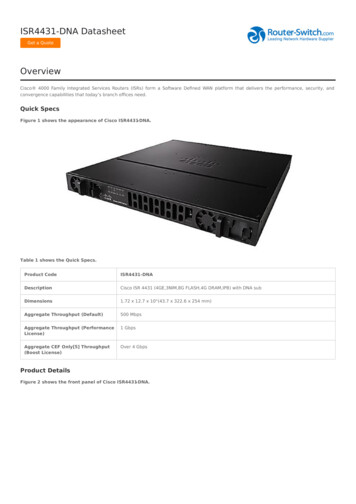
Instant Demo GuideCisco dCloud6. In the Today’s Alarms widget, view a snapshot of all the alarms that have fired since the last archive hour. 2019 Cisco and/or its affiliates. All rights reserved. This document is Cisco Public Information.Page 7 of 31
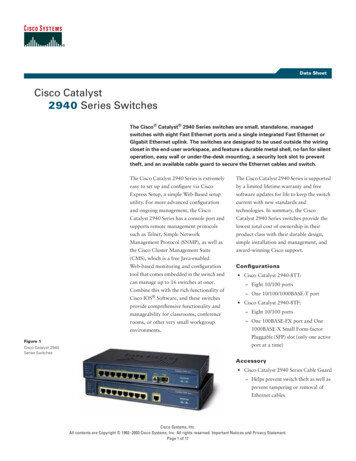
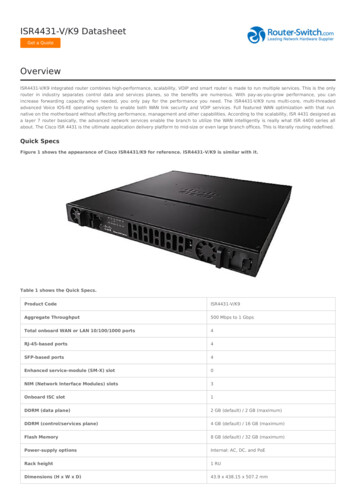
Instant Demo GuideCisco dCloud7. In the Top Application widget, view the top applications over the last 24 hours. 2019 Cisco and/or its affiliates. All rights reserved. This document is Cisco Public Information.Page 8 of 31
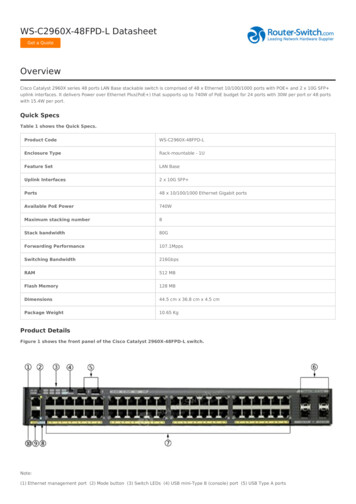
Instant Demo GuideCisco dCloud8. In the Flow Collection Trend widget, view the total amount of flow data through the network for the last 48hours. This is useful to visually inspect the normal baseline trend in flow volume and provides immediatevisual indications of abnormal behavior.SummaryMost organizations invest in a perimeter-based approach to network security. While effective at the perimeter,security does not end at the network boundary. The Stealthwatch System translates the information provided byNetflow into actionable intelligence, allowing security teams to detect even the stealthiest attackers. From realtime current threats to the daily and weekly summaries, Stealthwatch enables to customers to have immediateaccess to data resulting in lower risk.9. 2019 Cisco and/or its affiliates. All rights reserved. This document is Cisco Public Information.Page 9 of 31
Instant Demo GuideCisco dCloudScenario 2.Policy ValidationValue Proposition: This scenario uses the comprehensive Flow Query tool to manually validate networksegmentation between host device communities. If a customer is concerned with keeping business units,manufacturing devices, IOT sensors, medical devices, etc. secured and separated from other organizations anddevices, this demo can be used to demonstrate the effectiveness of those segmentation efforts. What methodsdo you have to quickly discern the effectiveness of your security efforts?When we think of security at the network level, we immediately call to mind firewalls, access control lists, andother complex, static methods of security enforcement. Alternative techniques for separating traffic orsecluding host communities often rely on even more complexity, such as VRFs. Agility becomes a challengewith these static methods. Costs increase as we add more devices into the network for security enforcement orcomplexity increases in trying to maintain a consistent, network wide policy. While these challenges are inthemselves barriers to success, perhaps an even bigger challenge is in validation and ongoing knowledge ofwhether these efforts are working or effective at achieving the intended goal.Stealthwatch is uniquely suited to validating the results of your security investment by providing full disclosureof what is happening in the network before and after deploying security measures.For many customers, segmentation or separation is a critical element to their security framework. Formanufacturing, IP enabled robotics or plant systems need to be segmented from the general office workersystems. In healthcare, medical devices remain separate and independent from other parts of the network. Inmany cases, it is difficult and time consuming to verify device level segmentation. Even then, it is impossible toknow if fully automated endpoints are only able to communicate with other automated endpoints. Full, ongoingvisibility is the only means of verifying your security efforts are functioning as intended.Validation can be automated via policy creation for long-term use, but for this demonstration we will do amanual verification to provide an idea of how Stealthwatch can be used to validate your security measures. Thismanual example can be automated, modified or adapted to provide ongoing verification.Challenge - Focus on Risk No automated mechanism for validating the application of security policyBenefits - Focus on Lower Risk Enable the entire network to gain real time visibility into security threats and anomalous behavior across theenvironment 2019 Cisco and/or its affiliates. All rights reserved. This document is Cisco Public Information.Page 10 of 31
Instant Demo GuideCisco dCloudSteps1. In the top navigation section, navigate to Analyze Flow Search.2. In the Time Range drop down, select Last 7 Days, so we can view any flows that have happened in the last7 days. Since we do not know when, or if a conversation has happened, we want to cast a wide net to seeif our security measures are working as we expect. 2019 Cisco and/or its affiliates. All rights reserved. This document is Cisco Public Information.Page 11 of 31
Instant Demo GuideCisco dCloud3. The next part of our query, in the left-hand pane where the Search Subject is listed, we are going to narrowthe search down to devices in the Machines hosts. Our focus in this demo is to ensure our automation hostsin the Machines group, are only talking to the ControlSystems group. We need to do a little drill down here. Stealthwatch can organize hosts in a hierarchical fashion; we willclick on the Host Groups button. Inside Hosts is the default setting, but we will narrow this down to theControlSystems hosts. This group of hosts has been defined by their IP Address in the StealthwatchManagement Console Application as part of this demo. Our goal is to identify any traffic that may have reached the Machine hosts from anything other than theControl System hosts. The easiest way to do this is to look for all flow data to our Search hosts(Machines group), excluding anything from the ControlSystem group.4. In the Subject and Peer sections, click Select, click Inside Hosts, click Machines, and then click Apply.NOTE: In the Peer section, repeat the steps above. 2019 Cisco and/or its affiliates. All rights reserved. This document is Cisco Public Information.Page 12 of 31
Instant Demo GuideCisco dCloud5. Now we will exclude any Control Systems group flow data from our query in the Subject and Peersections, click Select, click Exclude, click ControlSystems, and then click Apply.NOTE: In the Peer section, repeat the steps above. 2019 Cisco and/or its affiliates. All rights reserved. This document is Cisco Public Information.Page 13 of 31
Instant Demo GuideCisco dCloudNOTE: We have defined what devices we want to see conversations between, our Machines group andanything outside of that group, we need to specify what type of traffic we are looking for. In our case, we arelooking for any flows (traffic) that is outside Machines to ControlSystems, so it is unnecessary to narrow downour search definition any further.6. To run the Flow Search query, click Search 2019 Cisco and/or its affiliates. All rights reserved. This document is Cisco Public Information.Page 14 of 31
Instant Demo GuideCisco dCloudNOTE: It will take a few moments for the query to run. The system is processing every flow record generatedwithin the network for the last week. The more flow data that exists, the longer the query will take. What is trulyamazing is how fast this is given the workload underway. In just a few moments, the system is processingthousands or possibly millions of flow records.SummaryIf our network policies are functioning correctly, when the query completes, we should see no flow records. Ifany flow records were returned as part of this query, we would know that the customers changed to theirenvironment, whether a firewall/segmentation/ACL/etc. Also, we can see that the security effort was faultybecause the ControlSystems group should be sending or receiving traffic flows with hosts outside Machines.All companies want some reassurance of security and that their security efforts are making a difference. Howmany companies can say they have real-time, pervasive visibility into the effectiveness of those efforts? Havethe investments, both in money and effort, made a positive impact in securing the infrastructure? Stealthwatchprovides ongoing, visible and demonstrable evidence and feedback on the measures undertaken to secure theDigital Enterprise.This flow query identifies unwanted traffic and can be transformed to an automated detection mechanism usingCustom Security Events capability in Stealthwatch, which provides the ability to detect these traffic violationsautomatically without having to repeatedly search for such traffic. The automated detection will trigger a policyviolation alarm that can be associated with a response action. 2019 Cisco and/or its affiliates. All rights reserved. This document is Cisco Public Information.Page 15 of 31
Instant Demo GuideCisco dCloudScenario 3.Data Theft ForensicsValue Proposition: Unfortunately, data theft happens daily. Where in the past, attackers were primarily focusedon disrupting services; today’s security breaches are focused on theft. Stealthwatch works across the attackcontinuum, providing early behavioral insight to detect attacks and security breaches early in theirreconnaissance cycle, identification of attacks in progress and post-incident forensics. In fact, whenStealthwatch is coupled with ISE, Incident response goes from guesswork to context aware, user centricanalysis.Network forensics and investigation into suspected data theft of confidential or critical information. Whencustomers are concerned that confidential information and data integrity is maintained, this demo is effective inshowing how Stealthwatch can be used to track down data breaches. If a data breach were to occur, howquickly would you be able to identify when it happened, what device was used, who was on the device, whereit happened and the methodology?Not all threats are easily detected or based on malicious traffic. Social engineering coupled with valid traffictypes can still result in lost revenue or damaged credibility. The integrity of sensitive data such as partner orsupplier information can easily be intentionally or unintentionally exposed to a third party. What part canStealthwatch play in assisting with network forensics?Let us say there is a rumor circulating that partner data or some other sensitive information is being sent offsite. At this point, it is just a suspicion, but it needs to be investigated.Challenge - Focus on Risk No simple way to gather data during a security incidentBenefits - Focus on Lower Risk Full audit trail of all network transactions for detecting anomalous traffic and performing more effectiveforensic investigationsSteps1. Start at the Navigation Pane and click on Monitor Hosts. 2019 Cisco and/or its affiliates. All rights reserved. This document is Cisco Public Information.Page 16 of 31
Instant Demo GuideCisco dCloud2. What we see now is the hosts view. This is a complete listing of all internal hosts, sorted by alarm severity.The severity level is determined by a composite rating across the event categories tracked by Stealthwatch.3. We also see details of when the host first came on the network, when it was last seen on the network, andthe categories of events generated or identified as associated with the host. The color-coding assists inquickly assessing whether an event requires immediate attention or intervention.4. In the Filter Results By: section, select Exfiltration.NOTE: What we are looking for is a data theft or exfiltration. Since we do not know when it happened,remember we are investigating a rumor, we will scan down the left-hand side and see a list of the individualalarm types that are supported. We can see that there are exfiltration alarms that have been triggered within thelast 24 hours. We may have more than just a rumor. 2019 Cisco and/or its affiliates. All rights reserved. This document is Cisco Public Information.Page 17 of 31
Instant Demo GuideCisco dCloud5. Let us see what information we can get from Stealthwatch regarding this exfiltration alarm.6. We can see that host 10.210.7.38 was one possible host that triggered the alarm.NOTE: The demo environment is using pre-recorded Netflow data from a live customer environment. The datais replayed, with slight variation, every 24 hours. This may result in one, or more hosts generating theExfiltration alarm. Host 10.210.7.38 is expected.7. In this demonstration, we will focus on 10.210.7.38, however in a live network; it would be prudent torecommend that all alarms be investigated.8. Right now, we have a suspicion and confirmation that some exfiltration event happened, since we have a hitagainst the exfiltration policy. However, we do not know if this is a legitimate data transfer or data theft. Letus see if we can get more detail.9. Let us dig one-step deeper by clicking on the IP address 10.201.3.149. 2019 Cisco and/or its affiliates. All rights reserved. This document is Cisco Public Information.Page 18 of 31
Instant Demo GuideCisco dCloud10. Now we see that this host is part of the End User Devices host group, (left side of screen lists host details)and it has been communicating with some host in China at least once a day (center of screen shows flowpeers).11. We now know what organizational unit the host belongs to which may also tell us something about the typeof data this host, and user have access to and whether we should be concerned.12. The chart to the upper-right shows Suspected Data Loss and Data Exfiltration events over the last 7 days.13. To run a flow query on the external host involved, in the Traffic by Peer Host Group (last 12 hours) section,click the End User Devices host line, and then click View Flows. 2019 Cisco and/or its affiliates. All rights reserved. This document is Cisco Public Information.Pag
routers, Cisco ASA 5500 Series Adaptive Security Appliances (ASA), and Cisco Netflow Generation Appliances. Identity context for users and devices, including authentication, posture validation, and device profiling, provided by t