Transcription
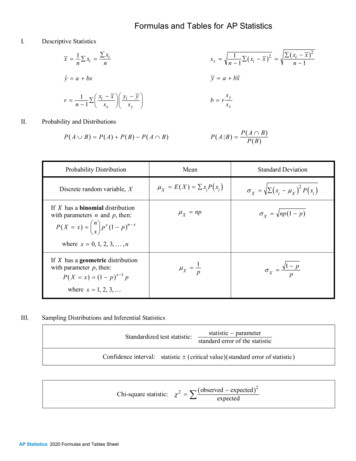
Formulas and Tables for AP StatisticsI.Descriptive Statisticsx xi1 xi nns xII. ( xi x )2n 1y a bxŷ a bxr 12 ( xi x ) n 1x x yi y 1 in 1 s x s y b rsysxProbability and DistributionsP ( A B) P ( A B ) P ( A ) P ( B ) P ( A B )Probability DistributionMeanDiscrete random variable, Xµ X E ( X ) xi P ( xi )If 𝑋𝑋 has a binomial distributionwith parameters n and p, then:nP( X x ) p x (1 p )n x x P ( A B)P ( B)Standard Deviationµ X np2σ X ( xi µ X ) P ( xi ) σXnp (1 p )where x 0, 1, 2, 3, , nIf 𝑋𝑋 has a geometric distributionwith parameter p, then:P ( X x ) (1 p ) x 1 pµX 1pσX 1 ppwhere x 1, 2, 3, III.Sampling Distributions and Inferential StatisticsStandardized test statistic:statistic parameterstandard error of the statisticConfidence interval: statistic ( critical value )( standard error of statistic )Chi-square statistic: χ 2 AP Statistics 2020 Formulas and Tables Sheet ( observed expected )2expected
III. Sampling Distributions and Inferential Statistics (continued)Sampling distributions for proportions:RandomVariableFor onepopulation:p̂For twopopulations:pˆ1 pˆ 2Standard Error*of Sample StatisticParameters ofSampling Distributionµ p̂ pµ pˆ pˆ p1 p212σ p̂ s p̂ 2p̂ (1 p̂ )np̂1 (1 pˆ1 ) pˆ 2 (1 p̂2 ) n1n2p1 (1 p1 ) p2 (1 p2 ) s pˆ1 pˆ 2 n1n2σ pˆ pˆ 1p (1 p )nWhen p1 p2 is assumed:s pˆˆ1 p2 11 pˆ c (1 pˆ c ) nn 12 where p̂c X1 X 2n1 n2Sampling distributions for means:RandomVariableFor onepopulation:XFor twopopulations:X1 X 2Standard Error*of Sample StatisticParameters of Sampling DistributionµX µµX µ1 µ21 X2σX σX X12σsX nσ12n1 σ 22s X Xn212sns12 s22 n1 n2Sampling distributions for simple linear regression:RandomVariableFor slope:bStandard Error*of Sample StatisticParameters of Sampling Distributionµ βbσb where σ x σσx nsb , ( xi x )n2where s and s x s,sx n 1 ( yi yˆi )n 2 ( xi x )n 122*Standard deviation is a measurement of variability from the theoretical population. Standard error is the estimate of the standard deviation. If thestandard deviation of the statistic is assumed to be known, then the standard deviation should be used instead of the standard error.AP Statistics 2020 Formulas and Tables Sheet
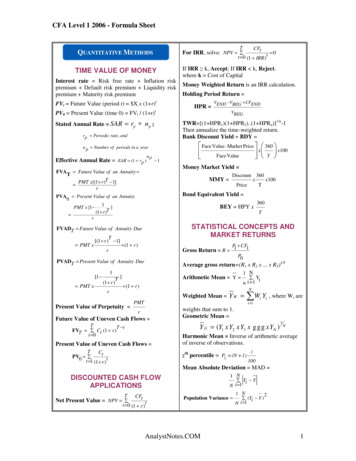
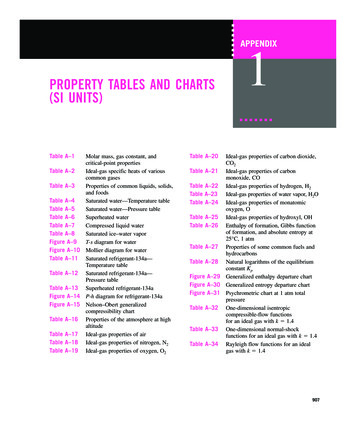
ProbabilityTable entry for z is theprobability lying below z.Table AzStandard normal .8-0.7-0.6-0.5-0.4-0.3-0.2-0.1-0.0AP Statistics 2020 Formulas and Tables Sheet
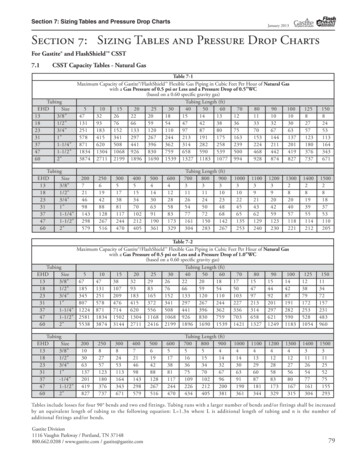
ProbabilityTable entry for z is theprobability lying below z.Table P Statistics 2020 Formulas and Tables Sheet
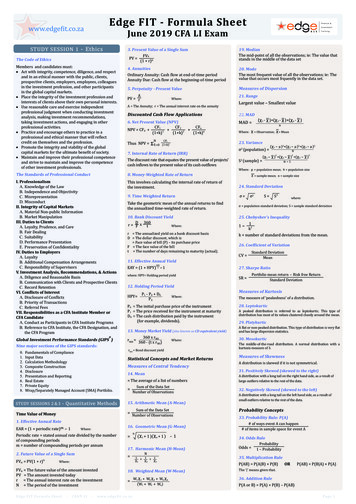
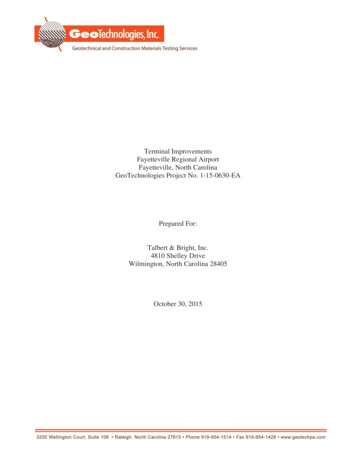
Table entry for p andC is the point t* withprobability p lyingabove it andprobability C lyingbetween t * and t*.Probability pt*Table Bt distribution critical valuesTail probability 60%70%80%90%95%96%98%99%99.5%99.8%99.9% Confidence level CAP Statistics 2020 Formulas and Tables Sheet.0025.001.0005
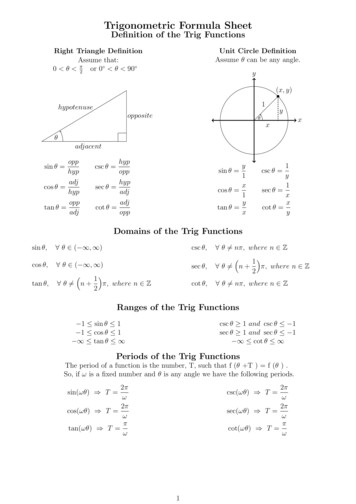
Probability pTable entry for p is the point( 2 ) with probability p lyingabove it.(χ2 )Table Cc 2 critical valuesTail probability .5AP Statistics 2020 Formulas and Tables 0989.56102.7128.3153.2
AP Statistics 2020 Formulas and Tables Sheet *S tandard deviation is a measurement of variability from the theoretical population. Standard error is the estimate of the standard deviation.