Transcription
ACCESS,A F F O R D A B I L I T Y,AND SUCCESSHOW DO AMERICA’S COLLEGES FARE AND WHAT COULDIT MEAN FOR THE PRESIDENT’S RATINGS PLAN?Awilda RodriguezAndrew P. KellyC E N T E RAMERIO NCANH I G H E RENTERE D U C A T I O NPRISEINSR E F O R MTITUTE
!Last fall, President Obama unveiled a plan to promote college affordability by changing the waythe federal government distributes student financial aid. The proposal calls for a federal collegeratings system that appraises colleges on measures of access, affordability, and student success.These ratings would then govern the allocation of federal student aid dollars, with schools thatperform well receiving larger Pell Grants and more generous student loans. Schools that lag behindwould get less.The proposal is a dramatic departure from the government’s traditional approach to aid policy,under which loan and grant monies flow to any accredited college that enrolls students, so long asthe institution passes minimal standards of financial health and student loan default rates. Thenew plan would challenge colleges to perform on all three sides of higher education’s “irontriangle”: access, affordability, and quality. According to a 2008 report by Public Agenda, mostcollege presidents believe the three sides of the triangle are “linked in an unbreakable reciprocalrelationship, such that any change in one will inevitably impact the others.”1 Through this lens,enrolling more disadvantaged students is a worthwhile goal, but it will likely lead to a drop incompletion rates. Similarly, reducing costs will boost affordability and encourage access, but itcould compromise the quality of the education provided. Meanwhile, spending more and raisingtuition prices has historically helped colleges rise in the rankings and attract better students, butdoing so limits access. Never before has a reform targeted all three sides of the iron triangle at thesame time.Since the ratings plan was announced, college leaders, advocacy groups, and researchers have askedwhether these three dimensions can be measured accurately and whether existing databases couldcollect the necessary data. Accepted measures of “quality” are notoriously absent, and capturingaffordability and access is not straightforward either. Others have voiced concerns about theconsequences the ratings may have for particular groups of institutions like open-access and forprofit colleges, where completion rates are usually low.But while it’s easy to hypothesize about which institutions and students would win and lose underthe new ratings scheme, an informed debate requires an empirical look at how America’s collegesand universities currently fare on the three sides of the triangle. Is the iron triangle an iron law? Orare there colleges hitting high marks on all three sides? How many colleges might be in troubleunder a new ratings scheme? And how are students distributed across the different levels ofperformance?This policy brief provides such a snapshot. The precise measures and methods that will govern theratings system are not yet known—indeed the Department of Education will convene a panel ofexperts this week to discuss these issues. However, using details from the White House’sdescription of the proposal and data from the federal Integrated Postsecondary Education DataSystem (IPEDS), we can take a look at the pre-ratings status quo. Admittedly, existing measures of—1—!
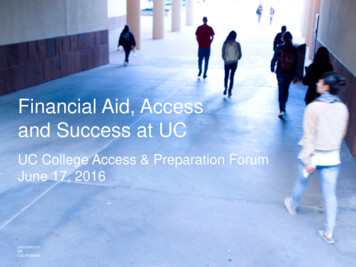
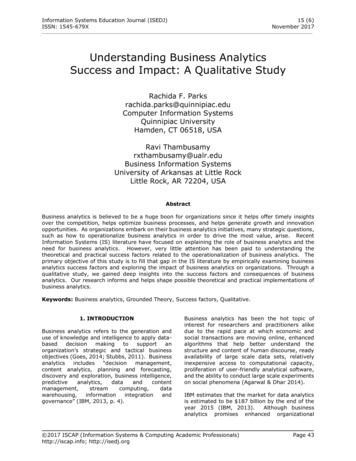
!access, affordability, and student success are imperfect at best. But even so, they can help us betterunderstand the implications of the proposed ratings scheme.The DataWe limited the analysis here to just over 1,700 four-year colleges with complete data on all threemeasures.2 As suggested in the White House plan, access is measured by the percent ofundergraduate students who receive Pell Grants. This is clearly an imperfect measure of access.The number of Pell-eligible students is finite and is often a function of a college’s surroundings,meaning it would be unrealistic to expect every college to have a similarly high proportion of lowincome students. Nonetheless, in the absence of a better measure, we used percent Pell as a proxy.For student success, we used the official 6-year graduation rate for first-time, full-time students. Theflaws in this measure are well known, but it provides a consistent benchmark across institutions.Affordability is a more challenging concept to measure. We ultimately settled on the average netprice3, since it represents the out-of-pocket costs, after grants and scholarships, that the average aidrecipient paid in a given year. While this measure is far from perfect, it fits with conventionalnotions of “affordability” in other markets.The ResultsFigure 1 (next page) plots where these colleges fall on each of the three measures. Affordability ison the x-axis, and percent Pell recipients on the y-axis. The colors correspond to graduation rates:like a traffic light, red corresponds to low graduation rates and green to high. Ideally, aninstitution would be green and in the upper left quadrant. This would mean they had highgraduation rates, were accessible to low-income students, and had a low net price. Theconcentration of red and green in the top left and bottom right corners, respectively, indicates thataccess and affordability are negatively correlated with student success.The good news is very few institutions are terrible on all three marks: there are not many red dotsin the lower right corner. The bad news is very few institutions appear to have broken the irontriangle. More discouraging, most institutions would need to make significant progress to land inthe top left corner with a green circle.4 Not surprisingly, many of the institutions with the highestgraduation rates (i.e., dark green) are those that enroll a low percentage of low-income students.The converse is also true—the institutions with the highest proportion of low-income students havelow graduation rates. This relationship is relatively consistent across the net price axis; red dots inthe top half of the graph appear across a wide range of the x-axis.—2—!
!Figure 1. Scatterplot of Four-Year Colleges by Access, Affordability, and CompletionInstitution TypesThe figure above hints at some clusters of institutions that look similar on the three measures (i.e.,the patch of dark green in the bottom right, the mass of yellow in the middle). To further flesh outthese clusters, we used a technique called latent profile analysis to find the patterns in the data andcategorize institutions based on their similarities.5 The end-result was four major categories ofinstitutions within the sample.6 Figures 2 through 5 simply decompose Figure 1 into these distinctgroups. The axes and colors are identical to those used in Figure 1. It is important to note that thisis not to a “ranking” of any kind; rather, it is a description of how different institutions performon all three dimensions.7!!—3—!
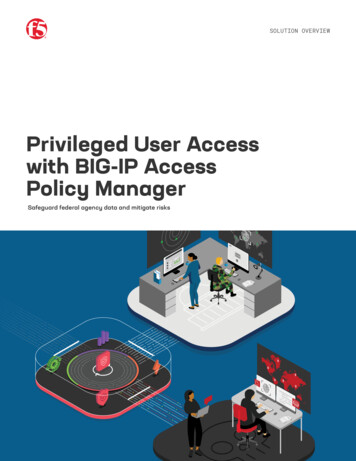
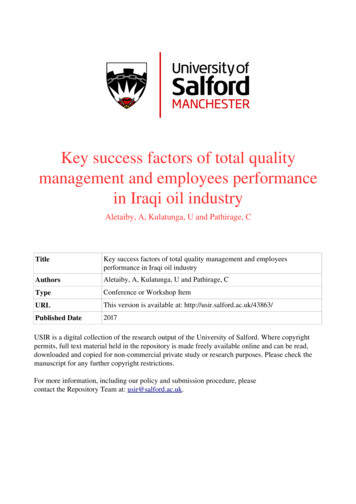
!Figure 2. High Access, High to Average Affordability, Low CompletionYou can get in, but you can’t get out. This groupmakes up 20% of colleges and 14% of studentenrollments. It is a mix of 39% private nonprofits(e.g., University of Sacred Heart, The College of NewRochelle) and 39% for-profits (e.g., University ofPhoenix, Argosy University).Several of the institutions in this category cater todistance learners, while others enroll high shares ofAfrican American and Latino students. With highrates of access (73% Pell students, on average) andaverage net prices ( 16,000), many of theseinstitutions may meet two out of the three criteria.However, their below-average graduation rates (28%among schools in the category) would leave them in aprecarious position if the new accountabilitymeasures take effect.Figure 3. Average Across the BoardMuddle in the Middle. These institutions aremiddling performers when it comes to access,affordability, and completion. The category is mostlymade up of moderately selective public institutions(e.g., UC Riverside, CUNY Baruch College, ArizonaState) and smaller private nonprofits (e.g., SalemCollege)—46% and 48% of the schools in thecategory, respectively. This category represents onethird of all institutions (33%) and undergraduateenrollments (33%) in this sample.Arguably, the President’s proposed policies couldhave the greatest impact here. With a lacklusteraverage graduation rate of 41%, a performance-basedfunding model could lead institutions at the lowerend of this measure (the red dots) to receive lessgrant money, generating higher net prices andcausing them to tumble even further. However, thefact that other colleges will receive lower ratingscould affect this category of institutions. They wouldmost likely absorb surplus demand from lowerperforming schools like those in Figure 2.—4—!
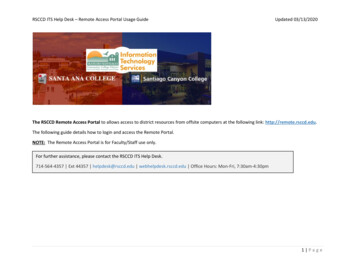
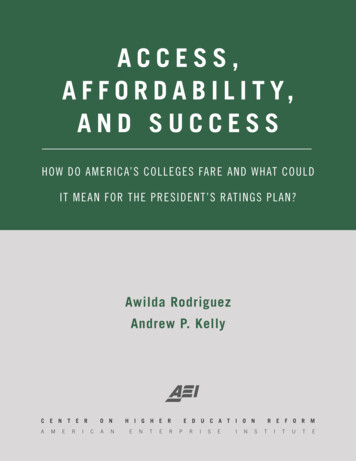
!Figure 4. Average Access, Below Average Affordability, Above Average CompletionPretty Good, But Pretty Expensive. The institutionsin this third category serve sizeable shares of lowincome students (30%, on average) and enjoy higherthan average graduation rates (60%). There is widevariation on net prices ( 6,000 to 35,000) with theaverage net price hovering around 19,000. The widerange reflects the group’s composition of roughly twoparts private nonprofit (62%) and one part public(37%).Collectively, this group represents about one-third ofthe 1,700 institutions (30%) and one-third ofundergraduate enrollments (37%). The dark greendots located in the upper left of the cluster wouldstand to benefit from the ratings scheme. Theseinclude less expensive public institutions with strongstudent outcomes (e.g., University of Washington,University of Florida, University of Georgia, andseveral of the University of California schools), and asmall handful of private nonprofits with reasonablenet prices (e.g., Brigham Young).8Figure 5. Low Access, Low Affordability, High CompletionGreat Outcomes, But Restricted Access. Nearly14% of institutions boast high graduation rates(group average: 81%) but admit few low-incomestudents (group average: 18% Pell eligible), and havesome of highest net prices. These institutions serve15% of undergraduate students in four-yearinstitutions. Nearly 9 out of every 10 institutions inthe category are private nonprofit (e.g., Oberlin,Middlebury, Yale) and one-tenth are public flagshipsor honors colleges (Penn State, The College of NewJersey, University of Maryland – College Park).There are some good bargains (institutions with lownet price and high graduation rates) for in-statestudents if they can get in: University of Virginia,Georgia Institute of Technology, Texas A&M, andCollege of William and Mary. However, there is littleevidence that these institutions currently have muchincentive to enroll Pell-eligible students. As such,providing even smaller Pell Grants as a punishmentmight depress that incentive even further.—5—!
!ImplicationsWhat do these data suggest about the President’s proposed ratings plan? A few implications standout.First, whether or not the iron triangle is indeed an iron law, very few institutions are actuallyperforming well on all three dimensions. Indeed, the latent profile analysis was not able toidentify a cluster of high performing institutions across all three measures. If we select only thosecolleges from the full sample that serve at least one-quarter Pell-eligible students, have at least a50% graduation rate, and have a net price less than 10,000, it yields only 19 colleges, includingCity University of New York (CUNY) and California State University schools, University ofWashington’s Seattle and Bothell Campuses, West Virginia University, and San Diego Stateuniversity. Together, these institutions serve only 3% of undergraduates in our sample. A full listof the 19 colleges and their performance on the three measures appears in the appendix.To be sure, these schools do fairly well on all three. But the lack of exemplars shows just how rarethis kind of well-rounded success is in American higher education. Presumably, this status quo iswhat the President hopes to improve on. The analysis here suggests it will not be easy.Second, in thinking through the potential reactions of colleges to these new incentives, it is worthkeeping in mind a basic pattern in higher education: it is generally easier for a college to changewho they admit than it is to change the success rates of the students already there. The clusteringof green and red in Figure 1 makes this apparent; student success has a lot to do with the kinds ofstudents that schools enroll.This pattern has implications for which institutions can most readily respond to and benefit fromnew incentives. On the one hand, smaller, more selective schools that are rated poorly becausethey have a low percentage of students receiving Pell Grants could register large increases on thatproportion relatively easily. Not only do they often have large endowments that enable them totake on more low-income students; they are also often smaller in size, meaning small gains in thenumber of Pell-eligible students will translate to large gains in percentages. Each additional Pellstudent they enroll also lowers their average net price. Finally, the larger Pell Grants theseinstitutions earn as a reward will offset the “cost” of the increase in Pell-eligible enrollments. Theseare by no means bad outcomes for the students involved, but these schools serve only a small sliceof the undergraduate population.Contrast that with the path to improvement for large, less selective schools with low rates ofstudent success, where nearly half of all students in the sample enroll (Figures 2 and 3). Theseinstitutions will have a choice to make. They can embark on the hard, uncertain work ofimproving teaching and learning to boost student success. Or they can take the easier route andadmit fewer low-income students. But becoming too selective would damage their access rating,and it is no sure thing that they’ll be able to attract better students. Either way, if they are large—6—!
!institutions, even substantial gains in the number of graduates will register as smaller increases incompletion rates.All of this is to say that the relative ease of improving on the different measures will lead someschools to disproportionately benefit from the new system. If improvement is quicker and easierfor low access/high success schools than it is for high access/low success schools, then rewards willaccrue to the former, reinforcing their place atop the higher education hierarchy. Increased accessto these rarified campuses for low-income students is surely a good thing. But to the extent we wishto increase rates of educational attainment, the latter category will have to improve considerably.Third, the grouping exercise shows that colleges are generally at four different starting points,meaning that improvement on the ratings will entail very different behavioral changes fordifferent institutions. For some schools, moving up will require cost containment and/or moregenerous aid that will improve access and affordability; for others, it will mean improving rates ofstudent success.The Department of Education’s “Request for Information” suggests that colleges could be rated ona “single dimension.”9 Presumably, the same policy would govern rewards and sanctions forinstitutions falling at various points on this dimension. Imagine two schools with identical ratingsthat have completely different areas in need of improvement. One has high rates of student successbut is expensive and enrolls few low-income students, while the other is cheap and open access buthas very low rates of student success. Policymakers presumably want the first college to increaseaccess and affordability and the second to boost student success. But should policymakers expectthe same incentive—eligibility for larger Pell Grants, for instance—to drive both kinds of behavior?Perhaps. But it seems plausible that carrots might work better for some goals (increasing theenrollment of Pell Grant students) and sticks for others (compelling cost containment and tuitionreduction), even among schools with the same rating. Punishing schools with already-low Pellenrollments by providing smaller grants may make them even less likely to take on Pell students.More generally, it is not clear which will be more effective: rewarding institutions that are alreadyperforming at a high level or sanctioning those that are performing poorly.The broader point is that a one-size accountability system could lead us down the well-worn path ofunintended consequences experienced in K-12. Accountability for outcomes is long overdue inhigher education. But shortsighted accountability systems often lead schools to focus overmuch onthe chosen performance metrics and less on goals that are not measured. Likewise, highexpectations for access and success are worthwhile. But setting unrealistic expectations does littleto help students; instead it primes colleges for failure on one or more metrics and could lead to thekind of ad-hoc waiver activity we have seen in K-12.Fourth, it will prove challenging to define measures and determine thresholds such that theratings do not lead to perverse consequences. For instance, coarse measures of access, like thepercentage of students receiving Pell Grants, are problematic. Setting an arbitrary standard on this—7—!
!measure ignores the fact that it would be impossible for all colleges to have the majority of theirenrollments be Pell-eligible students. But the thorniest measurement issue is how to gauge thevalue that colleges add to the students they admit rather than the absolute level of student success.The “value-added” approach will reward schools that help students build human capital but is hardto measure; the “level of success” approach is easier to measure but would reward colleges more fortheir admission process (the inputs) than the quality of the education they provide. There is areason why the dark green is clustered at the bottom of the graph. Most importantly, the level ofsuccess approach is more easily controlled by colleges via their admission policies, and will rewardthose already at the top of the heap.In thinking through these issues, the President and his advisers must acknowledge that a poorlydesigned accountability system will likely do more harm than good, providing critics with theammunition they need to roll back future efforts to hold colleges accountable. Designers would bewise to learn from the past and anticipate some of these potential pitfalls ahead of time. We stilldon’t know exactly what the ratings will measure and how the policy will work, but the datadiscussed here show just how much progress we have to make in order to create the high-quality,affordable postsecondary opportunities that Americans need.!!Awilda Rodriguez (awilda.rodriguez@aei.org) is a research fellow at the Center on Higher Education Reform at AEI. AndrewP. Kelly (andrew.kelly@aei.org) is a resident scholar and director of the Center on Higher Education Reform at AEI.—8—!
!Appendix. Nineteen four-year colleges in the sample with: graduation rates greater than 50percent, a net price lower than 10,000 and more than 25 percent Pell enrollment.Institution NameDewey UniversityUniversity of WashingtonSeattle CampusSan Diego State UniversityAppalachian State UniversityThe University of Texas atDallasUniversity of WashingtonBothell CampusCUNY Bernard M BaruchCollegeMichigan Jewish InstituteCalifornia State University-LongBeachWest Virginia UniversityCUNY Queens CollegeUniversity of North Carolina atAshevilleUniversity of North Carolina atGreensboroWayne State CollegeCUNY Brooklyn CollegeUniversity of MichiganDearbornCalifornia State PolytechnicUniversity-PomonaCalifornia State UniversityFullertonTougaloo CollegeLocationHato Rey, PuertoRicoSeattle, WANet Price 4,518Pct.Pell936-Yr GradRate84UndergradEnrollment2,198 9,395258128,289San Diego, CABoone, NCRic
The colors correspond to graduation rates: like a traffic light, red corresponds to low graduation rates and green to high. Ideally, an insti