Transcription
SKF Reliability SystemsVibrationDiagnosticGuideCM5003
Vibration Diagnostic GuideTable of ContentsPart 1Overview . 1How To Use This Guide 1Detection vs. Analysis . 1Vibration (Amplitude vs. Frequency) . 1“Overall” Vibration . 2Time Waveform Analysis . 5FFT Spectrum Analysis . 5Envelope Detection . 6SEE Technology . 7Phase Measurement . 7High Frequency Detection (HFD) . 7Other Sensor Resonant Technologies . 7Part 2Spectrum Analysis Techniques . 13Misalignment . 14Imbalance 16Looseness 18Bent Shaft 19Bearing Cocked on a Shaft . 19Bearing Defect 20Multi-Parameter Monitoring . 24Appendix AUnderstanding Phase . 25GlossaryGlossary . 27i
Overview / How To Use This Guide / Detection vs. Analysis / Vibration (Amplitude vs. Frequency)Vibration DiagnosticGuidePart 1OVERVIEWThis guide is designed to introduce machinery maintenanceworkers to condition monitoring analysis methods used fordetecting and analyzing machine component failures.This document was created by field experienced SKFapplication engineers using measurements obtained with SKFCondition Monitoring equipment. This guide is a “LivingDocument” and will continuously grow as application andexperience information becomes available.It is important to note that this guide is not intended to make thereader an analysis expert. It merely informs the reader about“typical” methods of analysis and how machinery problems“typically” show themselves when using these methods ofanalysis. It is intended to lay the foundation for understandingmachinery analysis concepts and to show the reader what isneeded to perform an actual analysis on specific machinery.Rule 1Know what you know and don’t pretend to know whatyou don’t know!Often, a situation arises where the answer is not obvious or notcontained within the analysis data. At this point “I don’t know”is the best answer. A wrong diagnosis can cost greatly and canrapidly diminish the credibility of the machinery maintenanceworker. Analysis of the problem by a vibration specialist isrequired.HOW TO USE THIS GUIDEThis guide is divided into two sections. The first section introduces concepts and methodsused to detect and analyze machinery problems. The second section examples “typical” ways in whichvarious machinery problems show themselves andhow these problems are “typically” analyzed.DETECTION VS. ANALYSISCAUSE AND EFFECTThere is a big difference between detecting a machinery problemand analyzing the cause of a machinery problem. Swapping outa bearing that is showing wear by vibrating heavily may or maynot solve your problem. Usually, some other machineryproblem is causing the bearing to wear prematurely. To solvethe bearing problem you must solve the cause of the bearingproblem (i.e. misalignment, looseness, imbalance). If not, youare not running a condition monitoring program, you’re runninga bearing exchange program.It is essential that machinery problems be detected early enoughto plan repair actions and to minimize machine downtime.Once detected, a cause and effect approach must be used to takefurther steps toward analyzing what caused the detectedproblem. Only then will you keep the problem from becoming arepeat problem.VIBRATION(AMPLITUDE VS. FREQUENCY)Vibration is the behavior of a machine’s mechanical componentsas they react to internal or external forces.Since most rotating machinery problems show themselves asexcessive vibration, we use vibration signals as an indication ofa machine’s mechanical condition. Also, each mechanicalproblem or defect generates vibration in its own unique way.We therefore analyze the “type” of vibration to identify its causeand take appropriate repair action.When analyzing vibration we look at two components of thevibration signal, its amplitude and its frequency. Frequency is the number of times an event occurs in agiven time period (the event being one vibrationcycle). The frequency at which the vibration occursindicates the type of fault. That is, certain types offaults “typically” occur at certain frequencies. Byestablishing the frequency at which the vibrationoccurs, we get a clearer picture of what could becausing it. Amplitude is the size of the vibration signal. Theamplitude of the vibration signal determines theseverity of the fault. The higher the amplitude, thehigher the vibration, the bigger the problem.Amplitude depends on the type of machine and isalways relative to the vibration level of a “good”;“new” machine!A glossary is provided at the end of this document. Referencethis glossary for any unfamiliar terms.Vibration Diagnostic Guide1
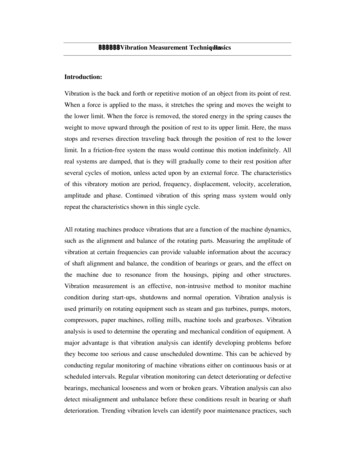
Vibration (Amplitude vs. Frequency) / “Overall” VibrationWhen measuring vibration we use certain standard measurementmethods: Overall Vibration Phase Acceleration Enveloping SEE Technology (Acoustic Emissions) High Frequency Detection (HFD) Other Sensor Resonant Technologies“OVERALL” VIBRATIONScale Factors on a Sinusoidal Vibration Waveform.Overall vibration is the total vibration energy measured within afrequency range. Measuring the “overall” vibration of amachine or component, a rotor in relation to a machine, or thestructure of a machine, and comparing the overall measurementto its normal value (norm) indicates the current health of themachine. A higher than normal overall vibration readingindicates that “something” is causing the machine or componentto vibrate more.Vibration is considered the best operating parameter to judgelow frequency dynamic conditions such as imbalance,misalignment, mechanical looseness, structural resonance, softfoundation, shaft bow, excessive bearing wear, or lost rotorvanes.FREQUENCY RANGEThe frequency range for which the overall vibration reading isperformed is determined by the monitoring equipment. Somedata collectors have their own predefined frequency range forperforming overall vibration measurements. Other datacollectors allow the user to select the overall measurement’sfrequency range. Unfortunately there is an ongoing debate onwhich frequency range best measures to measure overallvibration (even though the International Organization forStandardization (ISO) has set a standard definition). For thisreason, when comparing overall values, it is important that bothoverall values be obtained from the same frequency range.SCALE FACTORSWhen comparing overall values, the scale factors that determinehow the measurement is measured must be consistent. Scalefactors used in overall vibration measurements are Peak, Peakto-Peak, Average, and RMS. These scale factors have directrelationships to each other when working with sinusoidalwaveforms. The figure below shows the relationship of Averagevs. RMS vs. Peak vs. Peak-to-Peak for a sinusoidal waveform.2Peak 1.0RMS 0.707 PeakAverage 0.637 PeakPeak-to-Peak 2 PeakThe Peak value represents the distance to the top of thewaveform measured from a zero reference. For discussionpurposes we’ll assign a Peak value of 1.0.The Peak-to-Peak value is the amplitude measured from the topmost part of the waveform to the bottom most part of thewaveform.The Average value is the average amplitude value for thewaveform. The average of a pure sine waveform is zero (it is asmuch positive as it is negative). However, most waveforms arenot pure sinusoidal waveforms. Also, waveforms that are notcentered around zero volts produce nonzero average values.Visualizing how the RMS value is derived is a bit more difficult.Generally speaking, the RMS value is derived from amathematical conversion that relates DC energy to AC energy.Technically, on a time waveform, it’s the root mean squared(RMS). On a FFT spectrum, it’s the square root of the sum of aset of squared instantaneous values. If you measured a pure sinewave, the RMS value is 0.707 times the peak value.NOTE:Peak and Peak-to-Peak values can be either true orscaled. Scaled values are calculated from the RMSvalue.Don’t be concerned about the math, the condition monitoringinstrument calculates the value. What’s important to rememberis when comparing overall vibration signals, it is imperative thatboth signals be measured on the same frequency range and withthe same scale factors.Vibration Diagnostic Guide
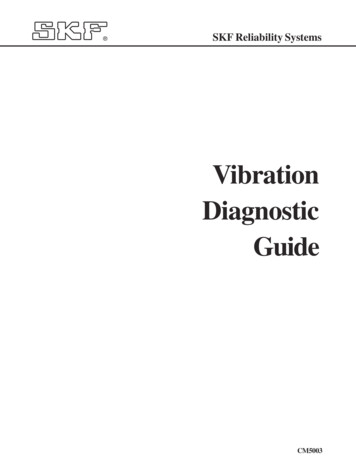
“Overall” VibrationNOTE:NOTE:As discussed in future sections, for comparison purposes,measurement types and locations must also be identical.These descriptions are given as guidelines for “typical”machinery only. Equipment that is vertically mounted,overhung, or in someway not typical may show differentresponses.MEASUREMENT SENSOR POSITIONSelect the best measurement point on the machine. Avoidpainted surfaces, unloaded bearing zones, housing splits, andstructural gaps.When measuring vibration with a hand-held sensor, it isimperative that you perform consistent readings, paying closeattention to the sensor’s position on the machinery, the sensor’sangle to the machinery, and the contact pressure with which thesensor is held on the machinery.Position - When possible, vibration should be measured in threedirections: the axial direction (A) the horizontal direction (H), and the vertical direction (V).Since we generally know how various machinery problemscreate vibration in each plane, vibration readings taken in thesethree positions can provide insight as to what may be causingany excessive vibration. Note that measurements should betaken as close to the bearing as possible. If possible, avoidtaking readings on the case as the case could be vibrating due toresonance or looseness.NOTE:Enveloping and SEE measurements should be taken asclose to the bearing load zone as possible.If possible, choose a flat surface to press the sensor tip against.Measurements should be taken at the same precise location forcomparison (moving the probe only a few inches can producedrastically different vibration readings). To ensuremeasurements are taken at the exact same spot, mark themeasurement point with permanent ink or machine a shallowconical hole with a drill point.Magnetic mounts are even better for consistency andpermanently mounted sensors are the best for consistency. Angle – Always perpendicular to the surface(90 10 ). Pressure – Even, consistent hand pressure must beused (firm, but not so firm as to dampen the vibrationsignal).OPTIMUM MEASUREMENT CONDITIONS Horizontal measurements typically show the mostvibration due to the machine being more flexible inthe horizontal plane. Also, imbalance is one of themost common machinery problems and imbalanceproduces a radial vibration, that is, part vertical andpart horizontal. Because the machine is usually moreflexible in the horizontal plane, excessive horizontalvibration is a good indicator of imbalance. Vertical measurements typically show less vibrationthan horizontal because of stiffness due to mountingand gravity. Under ideal conditions, axial measurements shouldshow very little vibration as most forces are generatedperpendicular to the shaft. However, misalignmentand bent shaft problems do create vibration in theaxial plane.Vibration Diagnostic GuidePerform measurements with the machine operating undernormal conditions. For example, when the rotor, housing, andmain bearings have reached their normal steady operatingtemperatures and with the machine running under its normalrated condition (for example, at rated voltage, flow, pressure andload). On machines with varying speeds or loads, performmeasurements at all extreme rating conditions in addition toselected conditions within these limits.TRENDING OVERALL READINGSProbably the most efficient and reliable method of evaluatingvibration severity is to compare the most recent overall readingagainst previous readings for the same measurement, allowingyou to see how the measurement’s vibration values arechanging, “trending” over time. This trend comparison betweenpresent and past readings is easier to analyze when the valuesare plotted in a “trend plot”.A trend plot is a line graph that displays current and past overallvalues plotted over time. Past values should include a base-line(known good) reading. The base-line value may be acquiredafter an overhaul or when other indicators show that the machine3
“Overall” VibrationWhen the mass is set in motion it oscillates on the spring.Viewing the oscillation as position over time produces a sinewave. The starting point (when the mass is at rest) is the zeropoint. One complete cycle of the mass displays a positive and anegative displacement of the mass in relation to its reference(zero). Displacement is the change in distance or position of anobject relative to a reference. The magnitude of thedisplacement is measured as amplitude.There are two measurable derivatives of displacement: velocityand acceleration. Velocity is the change in displacement as a function oftime, it is speed at which the distance is traveled, forexample 0.2 in/sec.is running well. Subsequent measurements are compared to thebase-line to determine machinery changes.Comparing a machine to itself over time is the much preferredmethod for detection of machinery problems as each machine isunique in its operation. For example, some components have acertain amount of vibration that would be considered a problemfor most machines, but is normal for them. The current readingby itself might lead an analyst to believe that a problem exists,whereas the trend plot and base-line reading would clearly showthat a certain amount of vibration is normal for this machine.ISO Standards are good for a start (until you develop a machinehistory). However, ISO charts define “good” or “not good”conditions for various wide-ranged machinery classifications. Acceleration is the rate of change of velocity. Fo
you to see how the measurement’s vibration values are changing, “trending” over time. This trend comparison between present and past readings is easier to analyze when the values are plotted in a “trend plot”. A trend plot is a line graph that displays current and past overall values plotted over time. Past values should include a base-line (known good) reading. The base-line value .