Transcription
WHITE PAPERThe TCO of BI: The QlikView Customer ExperienceSponsored by: QlikTechAlys WoodwardDan VessetOctober 2009IDC EMEA, 389 Chiswick High Road, London, W4 4AE, U.K.Tel. 44.20.8987.7100www.idc.comIDC OPINIONIn today's volatile economy, it is more important than ever before to monitor the costof software initiatives. Approval processes within organizations are getting longer, asmanagement prioritizes spending on the basis of detailed business justifications.Companies are becoming strongly focused on taking a financial view of both the costsand the benefits of software projects. This means that BI projects have to take theirplace alongside other technology initiatives and, in order for organizations to benefitfrom improved information they need to demonstrate a compelling return oninvestment (ROI).Luckily, the benefits provided from BI can be significant. Revenue and cash flowimprovements, operating cost reductions, and productivity gains are all different waysBI projects can benefit the business. However, ROI is impacted not only by thebenefits, but also by the time in which the benefits are realized, and the total cost ofownership (TCO) of the project. The faster the benefits are realized, and the lower theTCO, the higher the ROI. Assuming a BI project will deliver a certain amount of netbenefit over a specific timeframe, then TCO and ROI have a direct inverserelationship. Therefore, lowering TCO is a key principle of maximizing ROI.IDC conducted research into the TCO achieved by QlikView customers, and foundthat:On average, QlikView is around half of the TCO of other solutions. Whenasked what they had found the TCO of QlikView to be overall, surveyrespondents said QlikView had an average TCO of 53% of other solutions.QlikView customers made the biggest savings in services. When asked whatthey had found the TCO of each element of their QlikView solution to be,respondents found the TCO of QlikView to be:56% of the TCO of other solutions, for software39% of the TCO of other solutions, for services51% of the TCO of other solutions, for hardware46% of the TCO of other solutions, for the labor cost in the business ofproducing informationWhen the TCO for each component was aggregated, this gave an overallcomparative TCO for QlikView of 46%For a generic BI project, the TCO of QlikView is calculated to be 47%. Whenthe savings made by QlikView customers on software, services, and hardwarewere applied to IDC's standard pull-through rates for each cost component of aBI system, the cost of QlikView was 47% of that of other solutions.
METHODOLOGYThe IDC analysts opinions expressed in this white paper are based on years ofmarket research and consultations with BI technology users and vendors. This whitepaper also utilizes the findings from two research surveys conducted by IDC forQlikTech: 19 customer telephone interviews, and 809 customer respondents to anonline survey. The survey and interviews took place between January and March2009. See Appendix for the demographic profile of the respondent base.Generally, gaining success with BI projects is an iterative process, as organizationslearn how to make better use of technology and also learn how their organization willbenefit from a fact-based approach to decision-making. Because so manyorganizations have challenges with their early BI projects, the costs from BI can runvery high. What is coming more into focus is the need for organizations to measurethe total cost of ownership (TCO) of their BI projects.TCO analysis enables organizations to identify, project, measure, and track direct andindirect costs of a BI project. Organizations often estimate a BI project's TCO duringthe project planning stage to ensure alignment with budgetary constraints and thentrack costs throughout the project to prevent or minimize cost overruns.Customers also measure the return on investment (ROI) of BI. The ROI is the net ofthe benefits of the project minus its costs. From this it is simple to see the linkagebetween three factors: time, ROI, and TCO. The faster the benefits are realized for aproject, the higher the ROI. There is also an inverse relationship between ROI andTCO: the lower the TCO for a project, assuming the benefits remain constant, thehigher the ROI.This white paper is one of a series of four deliverables around the QlikView CustomerExperience:Success and Value From BI: The QlikView Customer Experience — Thispaper features data and anecdotes about the customer satisfaction, ease andspeed of development, and ease of use for business users of QlikView.The TCO of BI: The QlikView Customer Experience — This paper featuresdata and anecdotes about the TCO of QlikView, relative to traditional BIapproaches, categorized into software, services, and hardware costs.Time to Value and ROI From BI: The QlikView Customer Experience — Thispaper features data and anecdotes about the ROI of QlikView, categorized intobenefits from the time-to-value of QlikView, revenue and cash flowenhancements, operating cost reductions, productivity gains, and BI andreporting overhead reductions, as reported by customers.The IDC-QlikView Customer Experience: Survey Findings — An applicationdeveloped by QlikTech to analyze the results of the joint survey can be found athttp://www.qlikview.com/value.The TCO-related survey questions asked users various questions about the TCO ofQlikView relative to the TCO of other solutions they had evaluated. The answers wereexpressed as a range of percentages. So 1%–9% (lowest) indicates the TCO ofQlikView was between 1% and 9% of the other solution evaluated, while 100% (aboutthe same) indicates that the QlikView system had about the same TCO as the othersolution evaluated.2#IDCWP16R 2009 IDC
The average comparative TCO uses the median of the percentage range of theresponse and uses this in a calculation to give a weighted average of the TCO ofQlikView compared to other solutions. See Appendix for the exact values used.IN THIS WHITE PAPERIn this white paper, IDC discusses the TCO of BI solutions, referencing a Web-surveyand a series of in-depth interviews with QlikTech customers (see Appendix for fullmethodology). The white paper emphasizes the need for flexibility, power, andsimplicity as key variables for ensuring adoption of a BI solution, and analyzes theexperiences of a broad range of QlikView customers to understand their answers tothe following key questions:Why is TCO important as an element in solution evaluationsHow is TCO linked to business value and resulting ROIWhat are the key elements of a TCO calculation for a BI solutionHow did QlikView perform on the key elements of a TCO calculationSITUATION OVERVIEWSince the shift to a more turbulent and less predictable economy, organizations aremore highly focused on keeping costs low than ever before. Spend is becoming moretactical as opposed to strategic, and organizations want quick wins and a tangiblebusiness benefit from every project. Managing TCO to ensure costs are keptrelatively low is relevant to any technology investment, but particularly to BI solutions.IDC believes that measuring ROI and time-to-value helps organizations justify their BIbudgets of which a focus on lowering an initiative's TCO will only yield a higher ROIand accelerated payback. Controlling TCO helps to lower the investment hurdle andjustify projects in the vital early stages when both IT and business users are learningabout the business information requirements and exposing unexpected costs.Definition of Total Cost of Ownership for BISystemsIDC defines the total cost of ownership (TCO) of an information system as the entirecost of the system including upfront costs and ongoing running costs. TCO is usuallyexpressed as a figure that incorporates initial and ongoing costs over a three to fiveyear period.The TCO of an information system comprises the following elements:Software: license and maintenanceServices: implementation services, training and education services, and ongoingannual consulting servicesHardware: servers, storage, and peripherals for processing and interfacing withend users 2009 IDC#IDCWP16R3
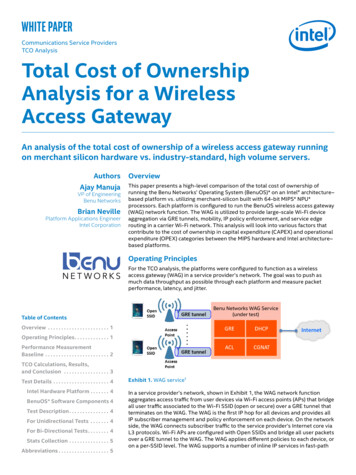
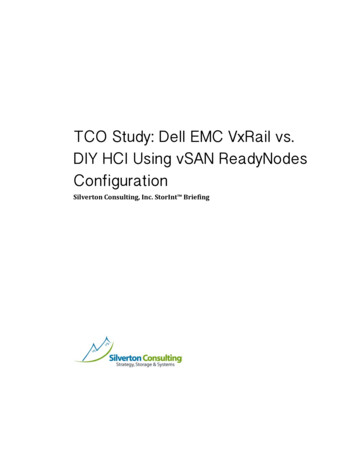
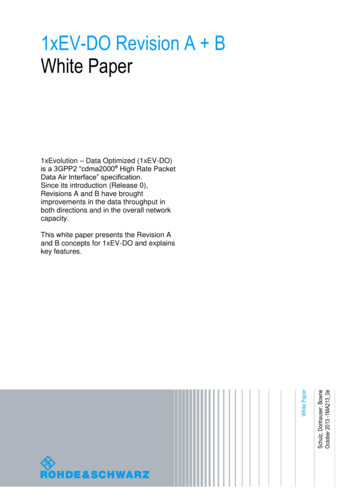
Note that TCO in isolation is only part of the financial profile of an information system.The return on investment (ROI) is defined as the net financial benefit of the system —the financial benefits minus the TCO. Additionally, payback period is defined as thetime it takes for an investment to make back its costs in benefits to break even.How Important is TCOIDC research indicates that cost is of vital importance to organizations when acquiringand implementing BI solutions. Figure 1 is from a survey conducted by IDC and DMReview in 2008. The figure shows that software price was the second most importantconsideration for BI buyers when selecting tools.FIGURE 1Important Features of BI ToolsQ.How important is each of the following features to your organization when selectingbusiness intelligence tools/solutions for purchase?Reliable softwarePricePricing options(e.g., server, named users)Aftersales supportVendor's financial stabilityPre-integrated with major ERPAvailable as an on-demand service0%20%40%60%80%100%Percentage of Responses5 — Very important4321 — Not at all importantSource: IDC and DMReview, 2008Software Price is the Key Inhibitor of Pervasive BIIn 2008, IDC conducted an in-depth study into pervasive BI, investigating how the useof BI is pushed further out into organizations. Figure 2 shows the importance ofsoftware price as an inhibitor of pervasive BI.However, organizations need to make sure they take a full view of BI project costs.Software costs are only part of the whole cost (according to IDC research, around athird of the overall BI project cost) while the services and hardware elements mustalso be considered. Ongoing costs as well as upfront costs should be brought intoany cost analysis, as ongoing costs are often higher as well as more difficult topredict.4#IDCWP16R 2009 IDC
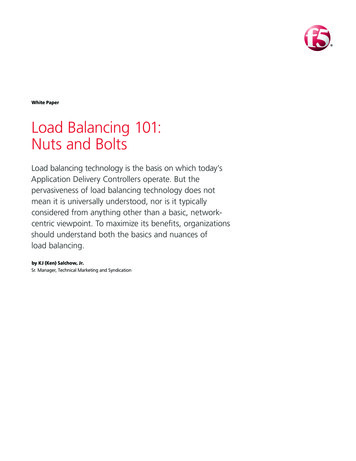
A European media company: "It's quite hard to compare costs between our originalBI system and this. I think the total TCO of QlikView is much lower than that of ourother tool."FIGURE 2Inhibitors of Pervasive BIQ.Please rate your level of agreement with the following statements regarding each as aninhibitor of broader and deeper use of BI software at your organization, on a scale of 1 (donot agree) to 5 (definitely agree).24%Software price is too expensive58%Departments' or BUs' data is consideredproprietary19%56%18%Software licensing options are too restrictive48%Our organization has inadequate IT departmentresources16%42%15%Sharing of data is perceived as loss of control42%13%No executive or top-down mandate/requirement42%0%10% 20% 30% 40% 50% 60% 70%Percentage of ResponsesTop BoxTop Two BoxesNote: On a scale of 1–5. Top Box 5. Top Two Boxes 4 or 5Source: IDC Pervasive BI study, 2008Customer Experiences With Total Cost ofOwnership of QlikViewIDC's research into QlikView customers indicated that sometimes QlikView isimplemented without being subject to a specific cost evaluation. There are a numberof possible reasons for this. Firstly, because business units have a certain amount ofbudget available that they do not need to justify outside their department, andsecondly because the tool is made available for development and prototyping prior topurchase. Users can therefore build their own prototypes and prove the benefits ofthe tool before purchasing. This is a low-risk strategy compared to the more complexarchitectures of some other BI software tools, which require upfront planning anddesign, and don't necessarily provide a pricing structure that allows an organization toprototype and test drive a product prior to purchase. 2009 IDC#IDCWP16R5
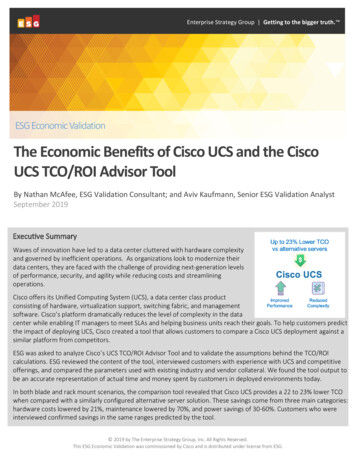
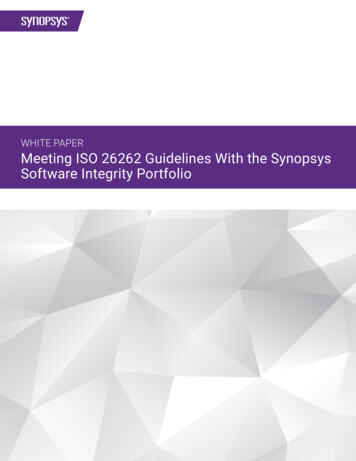
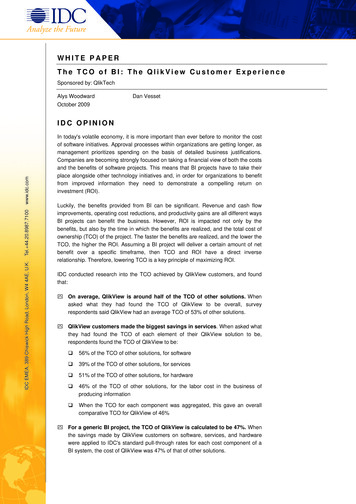
A large European organization said, "We selected QlikView because to do a BI pilotwith our ERP vendor would have cost 25k– 30k."QlikView's associative technology and the fact that data integration is included in thetool also helps users to start small and keep costs low until the benefits of thetechnology are proven.Dave McKay, Bristow Helicopters (U.K., consumer products, retail anddistribution): "We could start on a small scale, we didn't need to spend money rightat the start to extract data into a data warehouse before reporting on it."What Was the TCO of QlikViewThe next question to all respondents who stated they had measured the TCO ofQlikView, was "What was the TCO of QlikView, as a percentage relative to othersolutions that you evaluated?"Figure 3 shows the responses.FIGURE 3The Comparative TCO Of QlikViewQ.What was QlikView's TCO as a percentage relative to other solutions that you evaluated?(For TCO, please include software, services, and hardware.)100% (higherTCO) (8.2%)100% (about thesame TCO) (9.6%)1–29% (lowestTCO) (35.6%)60–99% (24.7%)30–59% (21.9%)Note: n 73Source: IDC survey of QlikView customer base, Jan-Mar 200982% of respondents found the overall TCO of QlikView to be lower than that of othersolutions they had evaluated. Over a third of respondents (36%) found QlikView notjust lower in cost than alternative solutions, but significantly so (1%–29% of the TCOof other solutions). When calculating an average for all the responses, QlikView had alower TCO than other solutions evaluated — 53% of the cost of other solutions.6#IDCWP16R 2009 IDC
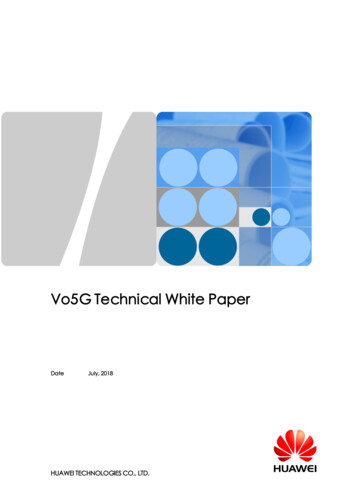
One customer described the ballpark figure for the comparative cost of QlikViewsoftware. Keith Edmonds, Aon Asia, (Singapore, financial services): "Wecalculated the difference between a traditional BI tool and QlikView, just for the frontend (excluding any data warehouse). QlikView was cheaper by a factor of 5."The Overall Comparative TCO of QlikView by ComponentTo validate survey respondents' overall TCO assessment of QlikView relative to othersolutions, the survey also assessed the TCO at a component level, as well as at anaggregate level.The aggregate level provided in the preceding question "What was the comparativeTCO of QlikView overall?" delivered a result of 53%. In most surveys, respondentsare likely to understate savings somewhat when giving a high level figure, out ofcaution. When the relative TCO of each component was aggregated, the resultingTCO was 46% of other solutions. (The components are software license, softwaremaintenance, implementation services, ongoing consultancy services, training andeducation services, hardware, and labor costs to produce information in thebusiness.) The closeness of these values demonstrates the accuracy of the surveyresponses. The following sections discuss each component of TCO in more detail.Software License and MaintenanceThe traditional and usual software licensing model for BI is the perpetual model,where the perpetual rights to use software are acquired upfront and ongoingupgrades and support are paid for by a monthly maintenance fee. This divides into anupfront cost and an ongoing cost, both of which contribute to the TCO of a softwaresystem.A less common model, although gaining in popularity, is the subscription or softwareas-a-service (SaaS) model, where the right to use the software is paid on an ongoingbasis. There are a number of issues around SaaS for BI, and currently BI is not reallyan area where there has been much take-up, although applications such as CRMhave seen significant uptake of the SaaS model.Both models correspond to an initial payment without which the software cannot beinstalled, and a series of ongoing payments without which the software will not besupported.The comparative software cost for QlikView was 56% of that of other systems. Thisaverage is comprised of software license and maintenance, which were 56% and55%, respectively. QlikView delivered very similar savings from license andmaintenance. Eddo de Vries, UWV (Netherlands, public sector) said, "Wedecommissioned our legacy analysis system as soon as we implemented QlikView,and that saved us 50%–70% of our data warehousing costs straight away, just onlicense fees."Another factor is that QlikView started out as a software vendor targeting themidmarket, and although it has a significant enterprise customer base, it has longbeen focused on delivering value for money to meet the demands of the midmarket.Maintenance is usually pegged to license, being a fixed percentage of the license fee,typically between 15% and 25%. (QlikView charges 20%.) Generally, softwarecompanies are prepared to discount the list price for the perpetual license element,but do not usually discount maintenance, because this represents their ongoing 2009 IDC#IDCWP16R7
revenue stream. Maintenance cost projections are therefore somewhere companiesshould pay attention to over time, as they are affected by license fee increases.The comparative TCO of the maintenance cost of QlikView was 55%. Figure 4 showssoftware license and maintenance TCO results.FIGURE 4The Comparative TCO of QlikView — SoftwareQ.Approximately how did the TCO of QlikView compare to the TCO of other solutionsevaluated? (Software license and maintenance measured as a component of TCO.)29%36%1–29% (lowest TCO)33%24%20%22%30–59%19%60–99%12%15%19%100% (about thesame TCO)27%23%9%5%7%100% (higher TCO)0%5%10%15%20%25%30%35%40%Percentage of RespondentsSoftware License (n 79)Software Maintenance (n 75)All SoftwareSource: IDC survey of QlikView customer base, Jan–Mar 20098#IDCWP16R 2009 IDC
ServicesIn the context of this report, we use the term "services" to mean all the humanresources required for a BI system.Initial and ongoing: Services is comprised of two categories — the initialimplementation services to get a system live and the ongoing services tomaintain a system over time. This is because BI systems need to evolve as thebusiness changes and as user requirements for information change. Ongoingservices requirements are therefore a key area for companies measuring andmanaging the TCO of their BI project.Internal and external: Resources may be employed directly by the company, orfrom external organizations. Generally, company employees will participate in theBI project by defining the business requirements, and may also have knowledgeof what data is available. External resources could also be used for either ofthese activities, to add knowledge of BI best practices, and for specific technicalknowledge of the BI tool or data integration tools and methodologies.This section looks at QlikView customers' TCO perspective of internal and externalservices, divided into implementation, ongoing consultancy and training andeducation.The comparative TCO of all services for QlikView was 39%. This breaks down asfollows:40% for implementation services38% for ongoing consultancy39% for training and educationServices had the lowest comparative TCO of all the elements. For each type ofservice (ongoing consultancy, training and education, and implementation), over 50%of respondents found QlikView to have a TCO of between 1% and 29% of othersolutions evaluated, which is impressive. See Figure 5 for the TCO of QlikView byservices element.QlikView customers found the comparative TCO of services to be significantly lowerthan the comparative TCO of software (39% compared to 56%). This demonstratesthat the build-it-yourself mentality and simplicity of installation and implementation ofQlikView both have a significant effect on the TCO of the services element of BIprojects. As services are usually the most significant proportion of a BI project, thisindicates that QlikView customers achieved considerable savings.Peter Fabricius, Magasin du Nord (Denmark, consumer products, retail anddistribution): "We ran a project with a traditional BI tool. We spent a great deal onexternal consultants every time we needed development. With QlikView, we do thedevelopment ourselves internally." 2009 IDC#IDCWP16R9
FIGURE 5The Comparative TCO of QlikView — ServicesQ.Measured as a component of TCO, approximately how did the TCO of QlikView compare tothe TCO of other solutions evaluated? (Implemen
QlikView relative to the TCO of other solutions they had evaluated. The answers were expressed as a range of percentages. So 1%–9% (lowest) indicates the TCO of QlikView was between 1% and 9% of the other solution evaluated, while 100% (about the same) indicates that the QlikView syste