Transcription
Business Intelligence Best Practices: A Strong Foundation forOrganizational SuccessWSB, February 19, 2017Joseph C Nichols MD, Health Data ConsultingThomas Harlan, Iatric Systems1
Speaker IntroductionJoe Nichols, MD - PrincipalHealth Data Consulting Inc 35 years in the healthcare industry 15 years in private orthopedic practice 18 years healthcare IT National speaker, trainer and consultant for CMS, Vendors, Associations,Hospitals, Payers and Professional Practices. Over 200 presentationsnationally on health data and coding AHIMA approved ICD-10 coding trainer Three service awards from WEDI (Workgroup for Electronic DataInterchange) Member; board of directors of the University of Washington HealthInformation Management masters degree program Member of the HIMSS Revenue Cycle Task Force2
Conflict of InterestJoseph Nichols, MDHas no real or apparent conflicts of interest to report.3
Agenda The changing role of healthcare data and analytics in a value-basedpurchasing environment Historical data quality challenges The challenge of data aggregation The impact of patient diagnostic data Re-focusing analytic efforts toward value based purchasing4
Learning Objectives Describe the change in healthcare policy and payment focus that is drivingnew analytic requirements Explain the current challenges related to data quality Identify requirements for accurate and consistent data aggregation Discuss what is needed to prepare the analytic environment to supportvalue based purchasing5
6
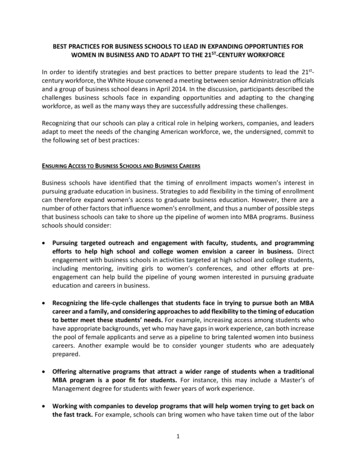
US 41st in life expectancyJapan 1st in life expectancyUS infant mortality is approximately 4 times Japan28.5 million uninsured in US*Source: OECD (Organization for Economic Co-operation and Development) 20157
The Public View of ValueSource: Health Data Consulting8
Increasing Measures of ValueSource: Health Data Consulting*Source:9
AccurateObservationsCompleteConsistent DocumentationWell-defined StandardsCoded DataInformationQualityAccurate implementationRobust Concept SupportSource: Health Data ConsultingSource: Health Data ConsultingAggregationClear definitionNormalizedAccurate inclusion andexclusionsWell definedAnalysisLogically validConsistently appliedSource: Health Data Consulting Inc.10
Good Patient DataIt’s all about good patient care 1. Observation of all objective and subjective factsrelevant to the patient condition2. Documentation of all of the key medicalconcepts relevant to patient care3. Coding that includes all of the key medicalconcepts supported by the coding standard andguidelinesSource: Health Data Consulting11
Big DataIs more garbage better?12
Unstructured DataReally?13
Source: Health Data ConsultingSource: Health Data Consulting14
Medical ConceptsExpressing the patient condition in codesMedical documentation scenario:A [27 year old] [male] patient is seen in [follow-up] for a [Smith’s fracture] on the[right] that was exposed through an [open wound] with [minimal opening and minimaltissue damage]. The fracturehas [not healed after 6 months].Source: Health Data ConsultingThough not explicitly stated in this scenario certain expressions imply other concepts:“Smith’s fracture” [fracture], [radius], [distal], [dorsal angulation], [extra-articular], [displaced]“minimal opening and minimal tissue damage” [Gustilo classification I]“not healed after 6 months” [nonunion]15
Source: Health Data ConsultingSource: Health Data Consulting Inc.16
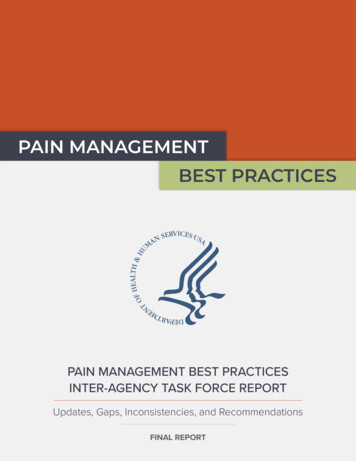
Historical Distribution of ICD-9 Diagnosis Codes3 Years of Data - All claims - All lines of business - 1million LivesTotal Charges by Code3years - 10 Bill80.0%70.0%60.0%50.0%40.0%Charge %30.0%20.0%10.0%0.0%5%next5% Source: Health Data Consulting Inc. 17
Coding SpecificityUnspecified (NOS), Other (NEC) or Symptom/Finding CodesSource: Health Data ConsultingCode TypeAll Professional ClaimsClaimsTotal Charges%Claims%Charges15,352,056 4,030,052,634100%100%‘Unspecified’ (and not ‘Other’ or ‘Symptomor Finding’)2,902,691 709,765,34119%18%‘Other’1,917,163 509,694,93512%13%‘Symptom or Finding’3,530,464 675,662,07323%17%Total 'Unspecified', 'Other' and 'Symptom orFinding'8,350,318 1,895,122,34954%47%Source: Health Data Consulting Inc.18
Coding SpecificityUnspecified (NOS), Other (NEC) or Symptom/Finding CodesSource: Health Data ConsultingCodeDescriptionTotal ChargesClaims78900Abdominal pain, unspecified site 29,331,412123,73771946Pain in joint, lower leg 22,973,23096,7867295Pain in limb 13,668,72278,50578605Shortness of breath 12,533,90943,4639597Knee, leg, ankle, and foot injury 9,979,45741,7077862Cough 9,250,72477,4307851Palpitations 8,181,43928,2287820Disturbance of skin sensation 6,531,67518,23878060Fever, unspecified 5,269,36932,6037823Edema 2,772,54916,450Source: Health Data Consulting Inc.19
Coding PatternsBreast CancerSource: Health Data Consulting Inc.20
Source: Health Data ConsultingAggregationThe Heart of Policies, Rules Edits and Analytics21
AccurateObservationsCompleteConsistent DocumentationWell-defined StandardsCoded DataInformationQualityAccurate implementationRobust Concept SupportSource: Health Data ConsultingSource: Health Data ConsultingAggregationClear definitionNormalizedAccurate inclusion andexclusionsWell definedAnalysisLogically validConsistently appliedSource: Health Data Consulting Inc.22
Aggregating Data - ChallengesSame concept in many places:Current categorization in the ICD-10 tabular indexConditionHypertensionPneumoniaGenitourinary DisordersTabular CategoryNumber of CodesHypertensive Disease14Other Categories (14)115Influenza and Pneumonia38Other Categories (18)42Diseases of the Genitourinary System587Other Categories (14)535Because of the ‘combination’ nature of ICD-10 codes, theymay not be located in the category the user is expecting23Source: Health Data Consulting
Aggregating Data - ChallengesSame concept described many ways:24
Aggregating Data - ChallengesSame concept described many ways:25
Aggregating Data - ChallengesSame concept described many ways:26
Aggregating Data - ChallengesSame concept described many ways:27
Aggregating Data - ChallengesSame concept described many ways:28
Source: Health Data Consulting29
Diagnosis impacts? Quality measures Resource use (cost) measures Adjustments for risk, severity and complexity– Quality measures– Outcomes, complication, potentially preventable re-admissions– Efficiency / utilization measures Current and evolving payment models dependenton conditions and outcomes of careSource: Health Data Consulting30
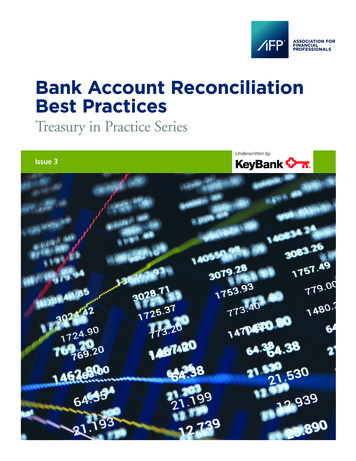
Coding Patterns42731 Atrial fibrillation40.00%7851 Palpitations35.00%42789 Other specified cardiacdysrhythmias30.00%7850 Tachycardia, unspecified25.00%20.00%4279 Cardiac dysrhythmia,unspecified15.00%4270 Paroxysmal supraventriculartachycardia42769 Other premature beats10.00%42781 Sinoatrial node dysfunction5.00%42732 Atrial flutter0.00%% of ClaimsSource: Health Data Consulting Inc.31
Coding PatternsDysrhythmiasN/A Cardiac dysrhythmia, unspecified60.00%42731 Atrial fibrillation50.00%42781 Sinoatrial node dysfunction42732 Atrial flutter40.00%4260 Atrioventricular block, complete30.00%42761 Supraventricular premature beats4267 Anomalous atrioventricular excitation20.00%4264 Right bundle branch block10.00%4263 Other left bundle branch block42611 First degree atrioventricular block0.00%% of ClaimsSource: Health Data Consulting32
Hospital Payment ImpactsSource: Health Data Consulting Inc.3333
Current Distribution of ICD-9 diagnosis codesHistorical Diabetes Coding – 760,556 ClaimsSource: Health Data Consulting Inc.34
Hospital Payment ImpactsSource: Health Data Consulting Inc.35Health Data Consulting 35
Concept Based AnalysisDiabetic RetinopathySource: Health Data ConsultingCondition ParameterPer person charges*Ratio to Average**Diabetes 35,3412.90Diabetes Retinopathy 69,4245.69 118,6549.73Diabetes Retinopathy Proliferative* Average total of all claim charges for a person with any claim in this diagnostic category** Ratio of the average total of all claim charges for a person with any claim in this diagnostic categorycompared to the average for all persons for all claim charges ( 12,200)Source: Health Data ConsultingSource: Health Data Consulting Inc.36
Concept Based AnalysisCMS-HCCsSource: Health Data Consulting37Source: HealthConsulting Inc.Inc.Source: HealthDataDataConsulting37 2016MDMeta
Concept Based AnalysisCMS-HCCsSource: Health Data Consulting38Source: HealthConsulting Inc.Inc.Source: HealthDataDataConsulting38 2016MDMeta
Source: Health Data Consulting39
Education It starts at the source and extends to all stakeholders Establish the value proposition for data gatherers and coders–––––DetailStandardsProfile comparisonsConnection to clinical careEmpower education with incentives Focus on accurately representing the precise nature, risk,severity and complexity of the patient conditionSource: Health Data Consulting40
Data Quality Define data quality measures and reporting Data Governance– Empowered from the top– Participation of all stakeholders and contributors Use data quality measures in a continuous qualityimprovement process Tie data quality to value across the organizationSource: Health Data Consulting41
Aggregation Quality Assure the right resources are established:––––––Clinical expertsFinancial expertsCoding expertsData expertsTechnical expertsCompliance experts Clearly define the intended content of all categories ofanalysisSource: Health Data Consulting42
Aggregation Quality Define the clinical concepts that meet the definition of thecategory– What concepts should be included or excluded based on the definition? Define the code set that:– Includes all codes that should be included– Excludes all codes that should be excluded QA and share Ongoing QA, and monitoring in production Update as standards change and QA requiresSource: Health Data Consulting43
Summary Healthcare is changing rapidly to an environment that is“value-based”. The analytic requirements in this new environment will bemore focused on the precise nature of the patientcondition. Data quality and aggregation quality are critical toproviding reliable, accurate and actionable information tosupport this new environment.Source: Health Data Consulting44
Summary Getting there will require a data governancestructure and data contributors that are:–––––EducatedContinuously informedIncentivizedEmpoweredCommittedSource: Health Data Consulting45
Source: Health Data Consulting46
QuestionsContact information: Joseph Nichols MD joenichols@healthdataconsulting.com 206-478-8227Thank you !* Please remember to complete your online session evaluations.47
Speaker IntroductionThomas HarlanTechnical Team Lead — Reporting ServicesIatric Systems, Inc. 20 years in healthcare IT Business Intelligence lead in Epic, MEDITECH,Lawson, and Banner48
Conflict of InterestThomas HarlanHas no real or apparent conflicts of interest to report.49
Agenda The BI Mental Model – Efficient Delivery of Actionable Data– Break around 10:15am Best Practices for Data Request Triage Best Practices for Report Development– Lunch at 12:30pm Best Practices for ETL Development– Break around 3pm Best Practices for Data Quality Lifecycle Summary and Closing remarks50
Learning Objectives Recognize the importance of having an enterprise BI architecture Outline the structure of a BI team and the BI life cycle from data request todata delivery Define BI best practices Describe how to minimize the cost of maintaining BI51
Welcome! An architecture for Delivering Actionable Business Intelligence Based on standard workflow, standard templates and battle-tested bestpractices You are doing some, none, or all of the things we will talk about Use what you will – or not All improvement is incremental improvement52
Session I – The BI Mental ModelThe Old Approach: “New request new printed report” Reports auto-printed to printers Reports munged into Excel to feed unknown workflows Thousands of reports to update Thousands of reports you’re not sure anyone uses Extraordinary waste53
BI Mental Model – The New Approach What is the User Story Action? Requests for data are expanded to workflow Requests for data have resulting actions defined Request triage is conducted Existing tools are used before implementing new ones Workflows include data quality (DQ) metrics We waste as little effort as possible54
BI Mental Model – Request Management Every request is documented via the ticketing system Focus on the action the end user wishes to take Do not discuss specific technical tools! Request is refined by the analyst Specification of data and source Can it be done? Should it be done? What does the user do next?55
BI Mental Model – Request Triage Follow a standard workflow Match the intended action to the right tool and system Communicate status consistently Hold ticket open until the work is completely done56
BI Mental Model – Reuse First Confirm the data is not already available from the identifiedsystem via a standard output tool Before building new, see if existing tool(s) can be extended Avoid duplicating data into parallel systems, if you can When you have confirmed new is needed, follow best practices forquick development Pre-validate the new output before the end-user sees it57
BI Mental Model – Development Use the tools you have to the fullest Follow best practice for each output tool Establish standard work for development Set a performance metric Use a version control system Pre-plan for updates and upgrades58
BI Mental Model – Data Quality During specification build, call out any known data issues Are they being reported by the DQ process? During validation, watch for missing data / poor capture workflow Loop in informatics and add to DQ process Same goes for end-user validation DO NOT fix the data issues in the report code! Keep your end-users out of Excel, if you can59
BI Mental Model – Training StaffPlan and communicate an expectation that all BI staff will, in time Follow standard work for all development Be able to use all available tools Be able to address any request Be able to meet the performance metricThis means a comprehensive training and role rotation plan.60
BI Mental Model – Retaining Staff How long does it take to be comfortable with a system? Define your process of turning User Story Action Reinforce the use of standard work Define what tools are in use Implement training and role rotation Mentoring Implement a technical career path Burgers must be flipped, but there must also be new cheese61
BI Mental Model – Discussion62
Break!Be back in 15 minutes63
Best Practice – Data Request ManagementStarting from a ticket, we: Define the User Story Refine the data specification Triage the request to available tools Develop (if necessary):- New coding- Valid cycle Closeout64
Best Practice – Data Request ManagementDefine the User Story Who is the user, and what workflow are they trying toimprove? What data do they need to act upon? How does that data need to be presented? Which system should it come from? What actions are they going to take, based on that data? What are the next steps, beyond initial actions? How do we identify data quality issues?65
Best Practice – Data Request ManagementRefine the Data Specification Even reports have a data specification but it is essential for extracts Use a standard template to document the spec Let the template do some of your work for you Encourage the requestor to define the specification Store the filled-in template with the code, in version control Send the specification to development, with the ticket or task66
Best Practice – Data Request ManagementTriage the request to available tools Once the specification is set (which may be quite simple) Is there a tool (report or extract or dashboard or ) which will providethe user with the data they need to act? If there is, note this in the ticket and re-route to the user. If not Use the appropriate system triage map to determine what tool todevelop in (see next slide):67
Best Practice – Data Request Management68
Best Practice – Data Request ManagementDevelop (if necessary): New Coding Assign a Data Request Number (DRN) to the new development Define or modify a version control project to include your new code Leverage existing code where possible – infrastructure objects! Build in a consistent way, using the best practice templates Update your ticket or task to reference the setup For extracts, a wiki or knowledge-base article is critical69
Best Practice – Data Request ManagementDevelop (if necessary): Validation Cycle Never send data via a tool to a user, unless it has been pre-validated If an analyst has done the specification prep, they hand off to thedeveloper The developer works directly with the end-user on: Validating the data Identifying data quality scenarios70
Best Practice – Data Request Management71
Best Practice – Data Request ManagementCloseout Check code into version controlPublish the report, or schedule the extractUpdate the Data Request Number in trackingUpdate the ticket or taskHave the beverage of your choice!All of this is standard work for your BI team. Checklist it, anddo it every time.72
Best Practice – Data Request ManagementDiscussion73
Break!Be back in 15 minutes74
Best Practice – Report DevelopmentFoundation Concepts Correct data Fast to run Correct data Well presented Correct data Easy to maintain75
Best Practice – Report DevelopmentReporting Architecture Drive reports from stored procedures Deploy reports via the web Work to a performance metric Parameterize with data-driven lists Establish and match a site style guide76
Best Practice – Report DevelopmentComponent Naming Reports will be composed of at least two components (query andlayout) Use your Data Request Number (DRN) in the name of eachcomponent Include the DRN on the report layout as well Remember you have Infrastructure Numbers for common objects77
Best Practice – Report DevelopmentServer EnvironmentDATASERVER Production data repository databaseRPTSERVER Web server providing viewable / scheduled reportsFILESERVER Offline copy of all report components78
Best Practice – Report DevelopmentReport DeploymentOn the RPTSERVER, take care to arrange your reports into a cleanfolder structure and Only assign access permissions by groups at the folder level Report server groups should link to AD groups Where possible, use short-cuts or linked reports from a hidden“main” folder79
Report Development – Tool SelectionWhen picking the right reporting tool, we need to consider: What latency is suitable for our end-user using the report? Where does the report need to be visible? Is the data reportable? Do we need to click-through to the chart or account? Does the output need to be scheduled? Do we have to go back quarters or years for data?80
Report Development – Tool Selection81
Report Development – Live vs. Test Developing in TEST is almost always a waste of time Unless the build you’re reporting against is only in TEST Use a DEV instance instead DEV has many advantages82
Report Development – Step by Step1. Create (or re-use) a stored procedure, from a standard template2. Stored procedure is always parameterized3. Parameters are driven by re-usable stored procedures4. Code header is in standard format5. Output is validated before report layout build6. For a new report layout, start from a standard template83
Report Development – Step by Step7. Format the report attractively8. Use dynamic features wisely9. Publish report to \TEST folder for end
Business Intelligence lead in Epic, MEDITECH, Lawson, and Banner. 49 . An architecture for Delivering Actionable Business Intelligence Based on standard workflow, standard templates and battle-tested best practices You are doing some, none, or all of the things we will talk about